Full Length Research Paper
ABSTRACT
Forty-nine tef, Eragrostis tef (Zucc.) Trotter, genotypes comprising 36 improved and 10 farmers’ varieties, and, three elite breeding lines were field evaluated using 7 × 7 simple lattice design at two contrasting locations (Debre Zeit and Alem Tena) in central Ethiopia during the main cropping season. The objective was to assess the extent and pattern of genetic diversity for 23 quantitative pheno-agro-morphological traits. Differences among the varieties were significant for most of the traits except lodging index, thousand seed weight, plant weight and grain yield per plant at each location. Similarity, the pooled analysis over locations showed significant genotype effect for most of the traits except number of total and fertile tillers, lodging index, plant weight and grain yield per plant. The varieties were grouped into seven clusters of different sizes. Improved varieties resulting from direct selection and hybridization were clustered together while local varieties mostly remained solitary. Principal component analysis depicted cumulative effects of a number of traits resulted in the differentiation of the varieties into clusters. Genetic distances among most of the clusters were significant such that crosses between parents selected out of them are expected to generate desirable genetic recombination. Hence, incorporation of farmers’ varieties in the breeding program would be imperative for broadening the genetic base of the released varieties. Moreover, future research strategies on germplasm collection, conservation, rejuvenation, characterization, selection and incorporation must be given due emphasis in the tef breeding program.
Key words: Clustering, genetic diversity, improved varieties, farmers’ varieties, pheno-agro-morphological traits, principal component analysis, tef.
INTRODUCTION
Tef, Eragrostis tef (Zucc.) Trotter, underutilized crop, is the staple food in Ethiopia and Eritrea. Ethiopia is the centre of origin and diversity of tef (Vavilov, 1951). In Ethiopia, tef occupies almost one-third 30% of the total area under cereals and represents about 20% of cereal production with average yield of 1.75 t/ha (CSA, 2018).
The national tef production increased from 5.047 million tons in 2017 to 5.156 million tons in 2018, an increase of 5.24% in a year (CSA, 2018). A number of wild forms are also known to exist and from the total of 350 Eragrostis species 44 of them are found in the country (Phillips, 1995), and 14 (26%) are said to be endemic (Cufodontis, 1974). For effective breeding and germplasm collection and conservation scheme, it is primarily essential to know
the extent and pattern of genetic diversity (Demissie and Bjørnstad, 1997). Cognizant of this fact, various genetic diversity studies have been conducted and revealed tremendous amount of phenotypic variation in tef varieties (Jifar et al., 2011); cultivars (Tefera et al., 1990) and landraces (Assefa 2001a, 2002a, 2003b; Kefyalew et al., 2000; Adnew et al., 2005; Plaza-Wüthrich et al., 2013). These local genetic resources are invaluable in the breeding system as they provide premium genes of different traits to improve the quality and productivity of tef. On top of that, farmers’ seeds are generally considered by agronomists as resources with limited potential, with a share of responsibility for the low productivity of traditional agricultural systems (Vernooy, 2003). This is due to the widespread adoption of traditional tef varieties with low production potential. Undeniably, in traditional agriculture, local varieties constitute the bulk of the plant material used (Missihoun et al., 2012). While improved tef varieties have better agronomic performance, they are not well adopted and thus little cultivated by the growers due to their unavailability (Plaza-Wüthrich et al., 2016), requisite for specific inputs and their organoleptic qualities which still fall sort of meeting users’ needs.
Nowadays, agriculture needs to be focused not only on selecting good performing varieties but also to the diversification of cultivars in seed system (Baco et al., 2007). The study was made to get information about the tef improvement efforts so far done and their contribution towards maintaining genetic diversity. Therefore, the objective of this study were to assess the pattern and extent of genetic diversity among the Ethiopian local and improved tef varieties and to identify the major morphological traits having relative contribution to the overall variation.
MATERIALS AND METHODS
Plant materials
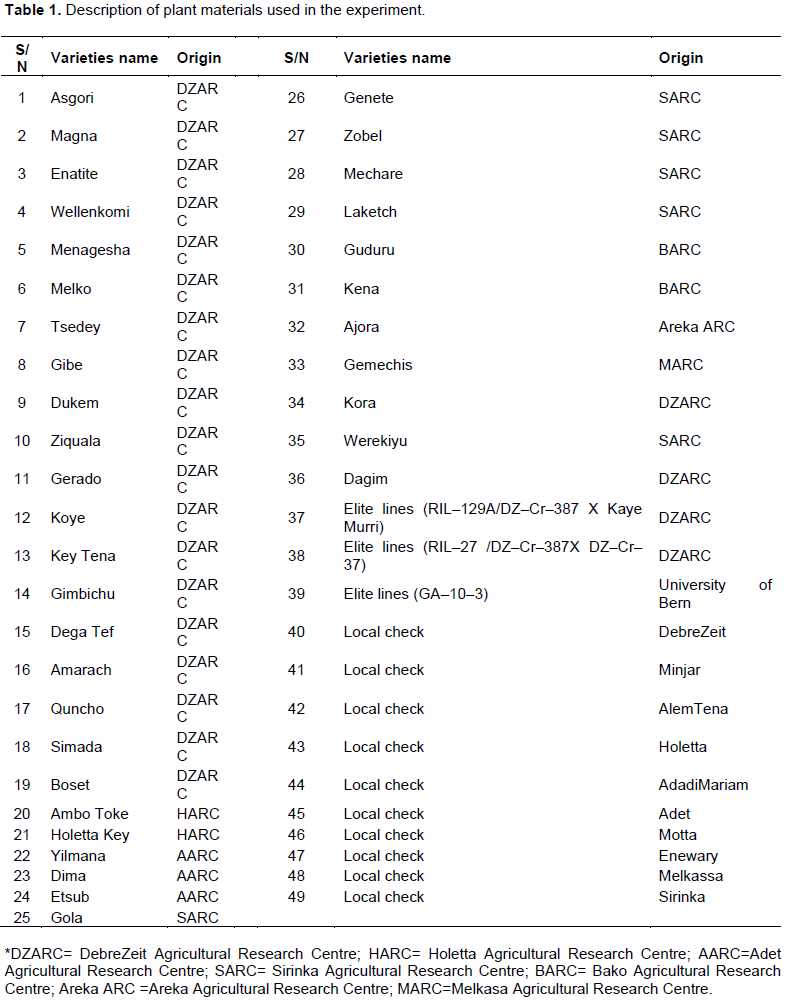
The experimental materials comprised 49 tef genotypes. These including 36 improved varieties which were released by federal and regional agricultural research centres of Ethiopia until the year 2016, three elite lines of which one was introduced from University of Bern, and 10 farmers' varieties widely grown in different areas, and commonly used as local checks in national tef yield trials in the country (Table 1).
Study sites
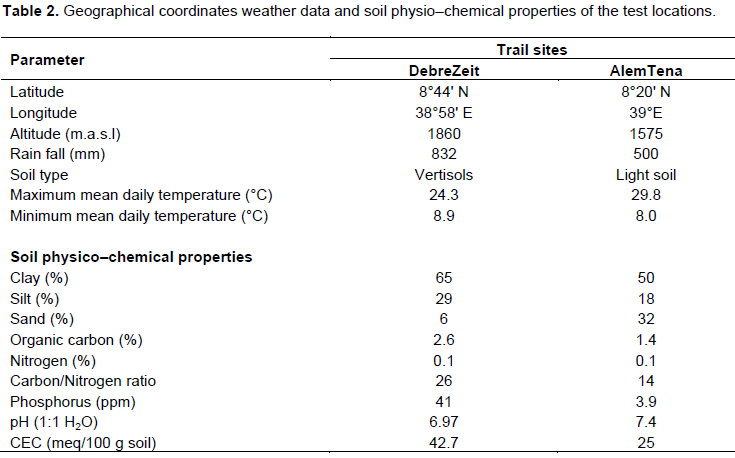
The field experiment was carried out at two contrasting locations (Debre Zeit and Alem Tena) in the central highlands of Ethiopia during the 2014 main season. Debre Zeit is located 47 km and Alem Tena 109 km in southeast of Addis Ababa. The two locations represent two different agro-ecologies of the country. Debre Zeit shows relatively constant rainfall with about 73% of the annual total of 832 mm of rainfall received during the main growing season from June to September. The experimental field at this site is characterized by heavy black soil described as very fine Montmorillonitic Typic Pellustert or Pellic Vertisol (Tsegaye, 1992) with very high moisture retention capacity. In contrast, Alem Tena often receives more than half of the annual total of 500 mm rainfall in only two months (July and August). The poor rainfall is distribution coupled with relatively high temperature and the experimental field at this site is characterized by very light sandy soil (Andosols) with low moisture holding capacity. The weather conditions during the growing season were favorable and the experiments were received sufficient amount of rainfall for normal growth of tef crop at each of the test sites. The geographical coordinates, climatic and soil-related data of the two locations during the growing period have been summarized in Table 2.
Experimental design and management
The field experiment was conducted using 7×7 simple lattice designs with two replications. Each plot (1 m × 1 m) consisted of five rows of 1m length with an inter-row spacing of 0.2 m. The distances were 1 m both between plots and incomplete blocks, and 1.5 m between replications. The varieties were allotted to plots at random within each replication. As per the research recommendations of 15 kg ha–1, 1.5 g plot–1 of seeds was hand broadcasted along the surface of each row. The experiment was planted at Alem Tena (light soil) and Debre Zeit (black soil) in the middle and end of July 2014, respectively. Fertilizers used were 40 kgN and 60 kg P2O5 per hectare for light soil at Alem Tena, and 60 kg N and 60 kg P2O5 per hectare for black soil at Debre Zeit. DAP was applied all at planting, while urea was applied two weeks after sowing and top dressed at tillering stage. Hand weeding was made three times during the crop growth stage.
Data collection
Data for the 23 quantitative pheno-agro-morphological traits were recorded on plot and individual plant basis. The following traits were taken on plot basis:
(1) Days to heading (DTH): The number of days from sowing up to the emergence of the tips of the panicles from the flag leaf sheath in 50% of the plot stands.
(2) Days to maturity (DTM): The number of days from sowing up to 50% of the plants in the plot reaching physiological maturity stage (as evidenced by eye-ball judgment of the plant stands when the colour of the vegetative parts changed from green to colour of straw).
(3) Grain filling period (GFP): Number of days from 50% heading to 50% maturity of the stands in each plot obtained by subtracting the former from the latter.
(4) Lodging index (LOGI): It is measured according to the method of Caldicott and Nuttall (1979). The method was taken as the product sum of the lodging degree taken on a 0-5 scale (0 being erect plant and 5 completely lodged) and the lodging severity as percent of the stand.
(5) Thousand seed weight (TSW): The weight of thousand kernels in milligram sampled from the entire plot.
(6) Biomass yield (BY): Above ground total (shoot plus grain) biomass in gram for the entire plot.
(7) Grain yield (GY): The weight of seeds harvested in gram from each plot.
(8) Harvest index (HI): It is the ratio of grain yield to shoot biomass sampled from the entire plot expressed in percent.
(9) Economic growth rate (EGR): It is the ratio of grain yield to grain filling period considered from the entire plot expressed in percent.
The following traits were taken on individual plant basis, and these observations were made on five random samples of plants from the central row of each plot, and the averages of the five plants were used for analysis.
(1) Plant height (PLH): The length from the base of the stem of the main tiller to the tip of the main shoot panicle at maturity recorded as the average of five plants per plot and measured in centimeter.
(2) Panicle length (PaL): The length from the base of the main shoot panicle where the first branch emerges to the tip of the panicle at maturity recorded as the average of five plants per plot and measured in centimeter.
(3) Culm length (CL): The length of the main shoot culm from the ground level to the point of emergence of the panicle branches at maturity recorded as the average on five of plants per plot and measured in centimeter.
(4) Peduncle length (PDL): The length from the last culm node to the base of the panicle recorded as the average on five plants per plot and measured in centimeter.
(5) Number of total tiller per plant (NTTP-1): It is recorded as the number of all tillers produced per plant assessed as the mean of five random plants per plot.
(6) Number of fertile tillers per plant (NFTP-1): It is recorded as the number of panicles bearing (fertile) tillers per plant assessed as the mean of five random plants per plot.
(7) Numbers of primary branches per main shoot panicle (NPBMPa-1): The average number of primary branches that emerged from the rachis of the main panicle.
(8) Number of spikelets per main shoot panicle (NSpPa–1): It is the average number of spikelet’s on the main shoot panicle of five plants measured in millimeter.
(9) First basal culm internode diameter (FBCD): The girth of the stem of the first internode from the ground level taken using caliper and recorded as the average of five plants measured in millimeter.
(10) Second basal culm internode diameter (SBCD): The girth of the stem of the second culm internode from ground level taken using caliper and recorded as the average of five plants measured in millimeter.
(11) Main shoot panicle weight (MPaW): The average weight of the main panicle of five plants at harvest measured in gram.
(12) Main shoot panicle seed weight (MPaSw): The average weight of the seeds harvested from the main panicle of five plants measured in gram.
(13) Plant weight (PW): The average weight of single plant including tillers harvested at the level of the ground of five plants measured in gram.
(14) Grain yield per plant (Gy P-1): The average weight of seeds for a single plant including all tillers yield of five plants measured in gram.
Data analyses
Analysis of variance (ANOVA)
For each trait analysis of variance was made first for individual location, and eventually upon getting positive results from tests of homogeneity of variances using the method F–max of Hartley (1950), a combined analysis of variance was made across the two test locations. For the analysis of variance, appropriate models suitable for the experimental design were employed (Gomez and Gomez, 1984) using SAS software version 9.00 (SAS Institute, 2002). This was used to get estimates of the variances for the different sources of error for subsequent analysis.
Multivariate analyses
For all multivariate such as cluster, distance and principal component analysis mean records on all traits were pre-standardized to means of zero and variances of unity to avoid bias due to the differences in measurement scales (Manly, 1986).
Cluster analyses
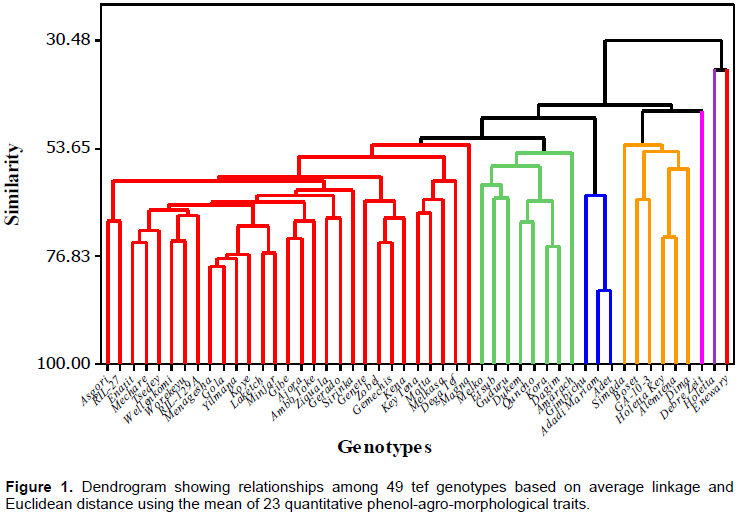
Agglomerative hierarchical cluster analysis was done by average linkage method using the mean data of varieties. The number of clusters was determined based on Pseudo –F and –t2statistics using SAS software version 9.00 (SAS Institute, 2002) and the dendrogram was constructed based on the average linkage and Euclidean distance as a measure of dissimilarity (the distance) technique using the MINITAB14 statistical package.
Distance analyses
Genetic distances between clusters as the standardized mean data were calculated using Mahalanobis's D2 statistics (Mahalanobis, 1936). The D2 values obtained for pairs of clusters were considered as the calculated values of Chi–square (C2) and tested for significance both at 1 and 5% probability levels against the tabulated value of C2 for 'P' degree of freedom, where P is the number of characters considered (Singh and Chaudhary, 1985).
Principal component analysis
Principal components (PC) analyses were employed to identify the main traits accounting much of the total variation among the varieties. In this analysis, only PCs with eigen values greater than one is considered as important.
RESULTS
Variation in pheno–agro–morphological features
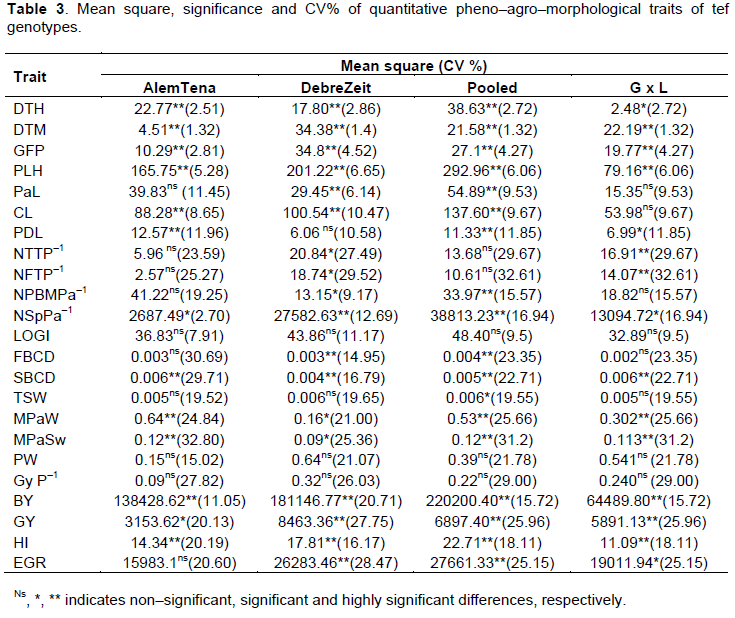
The analysis of variance for each location showed significant variation (p<0.01) among the varieties for all traits except lodging index, thousand seed weight, plant weight and grain yield per plant at both locations. The combined analysis of variance over locations depicted significant genotype variation for all traits except number of total and fertile tillers, lodging index, plant weight and grain yield per plant (Table 3), indicating that these traits could be genetically operated in order to improve the yield of tef and these results are parallel with the previous reports of Chanyalew et al. (2009). Likewise, the genotype x location (G x L) interactions were also significant for most of the traits apart from panicle length, culm length, primary branch per main shoot panicle, lodging index, first basal culm diameter, thousand seed weight, plant weight and plant seed weight (Table 3). The main cause of differences instability between genotypes is the occurrence of substantial genotype x location interactions which is due to both genetic and non–genetic effects, showing the importance of testing the varieties in place and time.
Assembling pattern
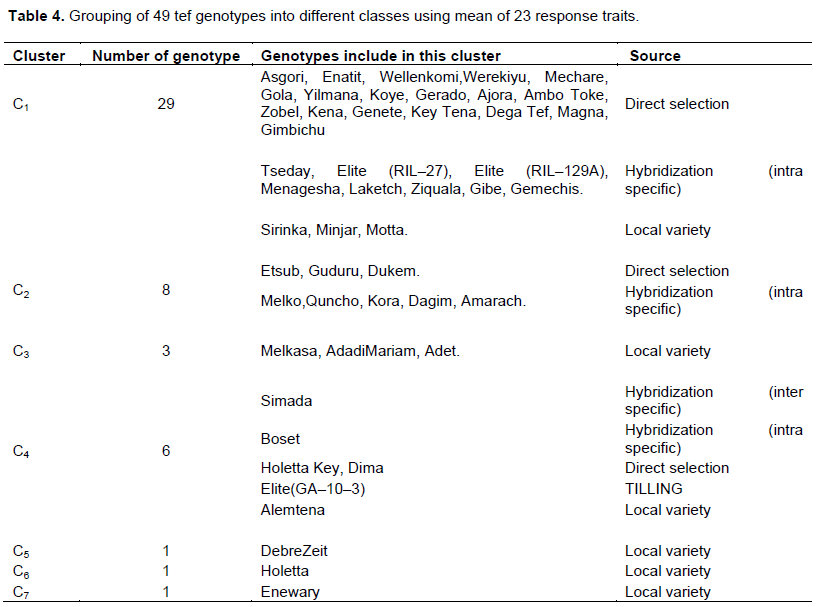
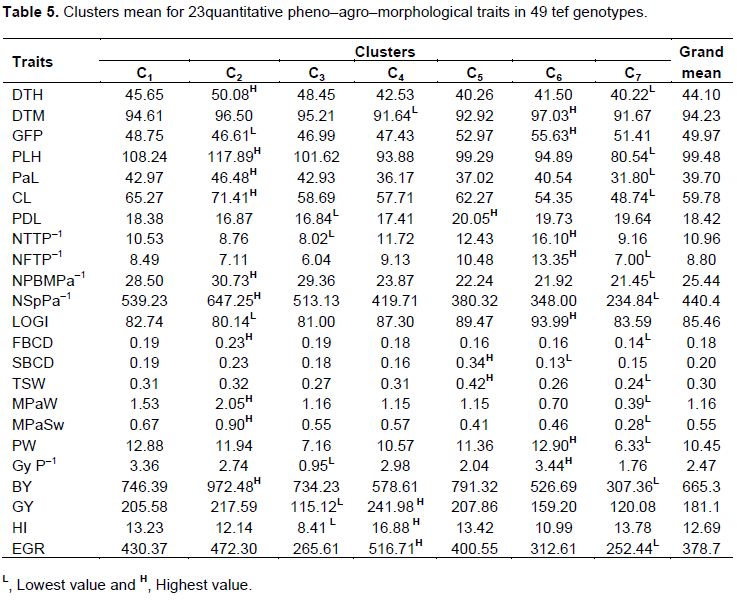
The genotypes were grouped into seven diversity classes (Table 4 and Figure 1), based on the trait considered different members in the same clusters were supposed to be more similar to each other than those in other clusters. The first cluster had the largest number 59% of genotypes resulting from direct selection, hybridization and farmer’s varieties but dominated by varieties resulting from direct selection. These varieties tended to form a sub–group as well. The second cluster comprised eight of the test tef genotypes originated from direct selection and hybridization but dominated by hybridization. These clusters generally contained highest performance in most of desirable traits. Hence, it directs that hybridization might be good approach for accumulating of the disable trait in a single variety. The fourth cluster comprised six of the test tef varieties originating from direct selection, hybridization and local varieties in equal proportion. Though, in this cluster varieties resulting from inter–specific hybridization and elite line resulting from TILLING were included. It also constituted the best yielding varieties with highest harvest index and economic growth rate. Local varieties remain solitary and form their own distinct group in cluster three, five, six and seven. Cluster three and seven encompassed inferior varieties for almost all of the traits. Furthermore, from the agronomic view point the solitary lines appear very fascinating in various aspects (Assefa et al., 2003b). Similar to this finding. the current study revealed interesting features of un–grouped lines (cluster five, six and seven), such as cluster five and six constituted longest grain filling period and peduncle length, highest total and fertile tiller with highest single plant and seed weight this ultimately result the highest lodging index record and this is factual in practical circumstance. While cluster seven depicted inferior performance in most of the trait (Table 5).
The result showed that, in most cases the varieties originating from direct selection and hybridization clustered together while local varieties remained distinct and ungrouped. This may be attributed to an exchange of genetic materials between the two breeding approaches. The local varieties grouped separately due probably to the presence of distinct farmer varieties in different areas. The current cluster analysis indicated that the diversity presented in tef genotypes cannot be reduced into a few numbers of groups as was done in earlier studies (Assefa et al., 2003b; Jifar et al., 2015).
Magnitude of genetic diversity
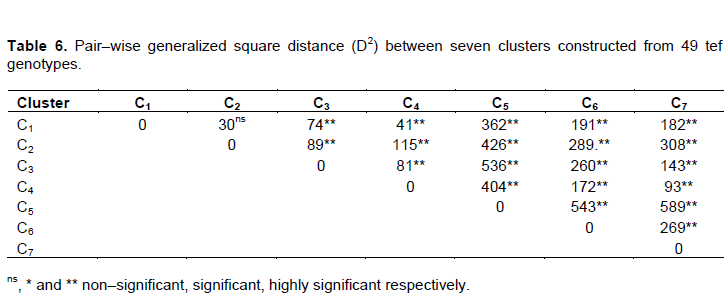
The pairwise generalized squared distances (D2) among the seven clusters is showed in Table 6, members in clusters with non-significant distance were assumed to have more close relationship with each other than they are with those in significantly distant clusters. The genetic distance out of 21 pairs, the genetic divergences between 20 pairs were highly significant at p<0.01. The maximum distance was found between clusters seven and five with D2=589 followed by cluster six and five with D2=543 which was presumably due to the distinct nature of the solitary grouped farmers’ varieties. The minimum and non–significant distances were found between cluster two and one D2=30, representing close relationship among the improved varieties included hybridization and direct selection. In view of that, the high inter–cluster distance values obtained in this study is largely due to the inclusion of the local varieties. It’s recognized that, geographically and environmentally isolated genotype were dominantly found in the growers hand and plays a prominent role to maintain genetic diversity through providing prospects for selection of desirable agronomic traits and for hybridization (Teshome et al., 1997).
Parents for hybridization could be selected on the basis of maximum inter-cluster distance for isolating useful recombinants in the segregating generations (Singh, 1990; Wallace and Yan, 1998; Chahal and Gosal, 2002). It is anticipated that relatively better genetic recombination and broad-spectrum of variability in segregating progenies were obtained from crosses among chosen varieties from these clusters. Moreover, to increase the yield limitation caused by narrow genetic base (Chandel and Joshi, 1983) and to develop varieties with broad genetic base (Chandel and Joshi, 1983; Singh, 1990; Keneni et al., 1997) crosses among parents with high inter–parental diversity might have a significant contribution. Although, the selection of parents must also consider the distinct plus of each cluster and each variety within a cluster depending on the specific purposes of hybridization as described by Singh (1990) and Chahal and Gosal (2002). Ideal level of desired traits for yield, biotic and abiotic stress and quality factors must be other criteria for parent selection beside genetic diversity (Wallace and Yan, 1998).
Principal component analysis
The first six principal components explained about 76% of the total variation among 49 tef varieties evaluated for 23 quantitative pheno-agro–morphological traits (Table 7). The first principal component alone accounted for about 31% of the total variation which is similar to the findings of Assefa et al. (2001a). Clustering within each principal component is highly influenced by the traits with larger absolute values closer to unity than those with lower absolute values closer to zero (Chahal and Gosal, 2002). Consequently, the differentiation of varieties into different clusters was articulated by the cumulative effects of each trait since most traits alone contributed small effects (±0.04-0.44) to the total variation. Nevertheless, the total diversity is relatively influenced by the traits which have comparatively greater weight in PC1.
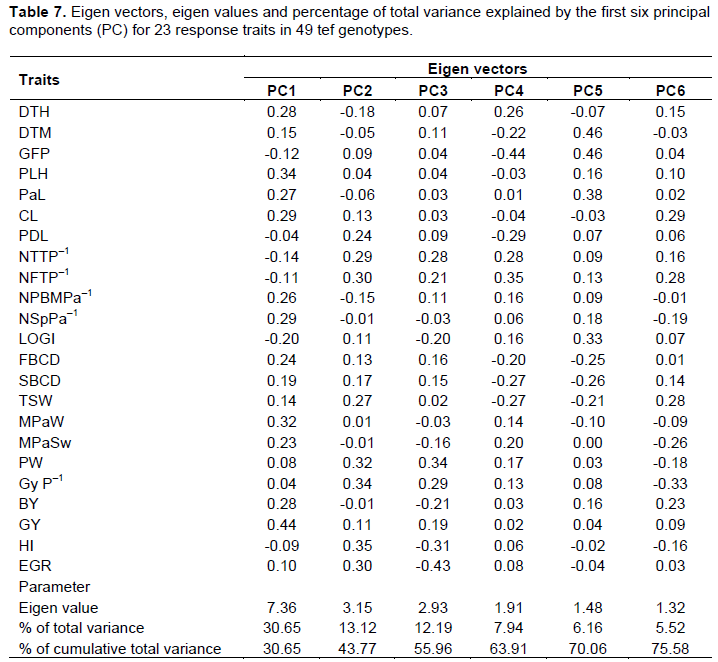
Additionally, the presence genetic diversity among the varieties revealed that the entire variation cannot be explained in terms of few PCs. In the current study, 76% of the variation among 49 varieties with a greater number of PCs from the previous other studies of Assefa et al. (1999) who reported that about 71-74% of the variation in 320 tef germplasm lines was explained by five PCs. On the other hand, only five PCs were reported to have explained about 81% of the gross variation in 1080 (Assefa et al., 2001a) and 60 (Assefa et al., 2003b) tef germplasm lines.
To sum up, the results depicted that there was high genetic diversity in the local tef varieties and this implies that farmer’s seeds have substantial quantitative pheno–agro–morphological trait diversity which can be exploited in the genetic improvement of tef. However, the genetic architecture of improved varieties resulted from hybridization and direct selection showed low genetic diversity among them. Several possible reasons could be given for the genetic similarity among the improved varieties from the two breeding techniques. This included gene flow, use of few parents in the breeding program and utilization of improved variety as a gene donor material. It is suggested that depending on the specific breeding aim, selection of parents for hybridization need to encompass local varieties with discrete desirable traits and genetic diversity. In line with this, high gene recombination would be expected from accessions drawn from significantly distant clusters. Ethiopia is the ace wealthiest country in terms of genetic diversity of tef but this opportunity has not been copiously exploited by the previous breeding efforts. Therefore, in the efforts towards developing farmers and consumers preferred tef variety it is required to perform multiple crossing with distinct parents from different origin. Additionally, further research activities are required to assess the genetic diversity among landraces across the country and point out the desirable traits and incorporate the peak line in the breeding program.
CONFLICT OF INTERESTS
The authors have not declared any conflict of interests.
REFERENCES
|
Adnew T, Ketema S, Tefera H, Sridhara H (2005). Genetic diversity in tef [Eragrostis tef (Zucc.) Trotter] germplasm. Genetic Resources and Crop Evolution 52(7):891-902. |
|
|
Assefa K, Ketema S, Tefera H, Nguyen HT, Blum A, Ayele M, Bai G, Simane B, Kefyalew T (1999). Diversity among germplasm lines of the Ethiopian cereal tef [Eragrostis tef (Zucc.) Trotter]. Euphytica 106:87-97. |
|
|
Assefa K, Tefera H, Merker A, Kefyalew T, Hundera F (2001a). Quantitative trait diversity in tef [Eragrostis tef (Zucc.) Trotter] germplasm from Central and Northern Ethiopia. Genetic Resources and Crop Evolution 48:53-61. |
|
|
Assefa K, Merker A, Tefera H (2002a).Qualitative trait variation in Tef [Eragrostis tef (Zucc.) Trotter] germplasm from Western and Southern Ethiopia. Euphytica 127:399-410. |
|
|
Assefa K, Merker A, Tefera H (2003b). Multivariate analysis of diversity of tef [Eragrostis tef (Zucc.) Trotter] germplasm from western and southern Ethiopia. Hereditas 138:228-236. |
|
|
Baco MN, Biaou G, Pinton F, Lescure JP (2007). The Traditional Farming Knowledge They Still Keep Agrobiodiversity in Benin? Biotechnologie Agronomie Sociétéet Environnement 11:201-210. |
|
|
Caldicott JJB, Nuttall AM (1979). A method for the assessment of lodging in cereal crops. Journal of the National Institute of Agricultural Botany 15:88-91. |
|
|
Chahal GS, Gosal SS (2002). Principles and procedures of plant breeding: Biotechnological and conventional approaches. Narosa Publishing House, New Delhi. |
|
|
Chandel KPS, Joshi BS (1983). Multivariate analysis in green-seeded pea. Indian Journal of Agricultural Science 53(4):198-200. |
|
|
Chanyalew S, Tefera H, Singh H (2009). Genetic variability, heritability and trait relationships in recombinant inbred lines of tef [Eragrostis tef (Zucc.) Trotter]. Research Journal of Agriculture and Biological Science 5(4):474- 479. |
|
|
CSA (2018). Agricultural sample survey for 2018. CSA (Central Statistical Agency) Addis Ababa, Ethiopia. Volume I. Statistical Bulletin 586. |
|
|
Cufodontis G (1974). Enumeration plantaruma Ethiopia espermatophyta. Jardin botanique Brussels. |
|
|
Demissie A, Bjørnstad A (1997). Geographical, altitude and agro-ecological differentiation of isozyme and hordein genotypes of landrace barleys from Ethiopia: implications to germplasm conservation. Genetic Resources and Crop Evolution 44:43-55. |
|
|
Gomez KA, Gomez AA (1984). Statistical Procedures for Agricultural Research. 2nd edition, John Wiley and Sons Incorporated New York, USA. |
|
|
Hartley HO (1950). The maximum F-ratio as a short cut test for heterogeneity of variances. Biometrika 37:308-312. |
|
|
Jifar H, Assefa K, Bekele E (2011).Genetic variability in released tef [Eragrostis tef (Zucc.)Trotter] varieties of Ethiopia. In Proceedings of the Thirteenth Biennial Conferences of Crop Science Society of Ethiopia, Vol. Sebil, 160-169 (Eds K. Assefa, W. Sinebo, A. Fikre, A. Teklewold, L. Korbu, T. Dessalegn, E. Habte and L. Gugsa). Addis Ababa, 31st December 2008-2nd January 2009: Crop Science Society of Ethiopia. |
|
|
Jifar H, Assefa K, Tadele Z (2015). Grain yield variation and association of major traits in brown seeded varieties of tef [Eragrostis tef (Zucc.) Trotter]. Agriculture and Food Security 4:7-16. |
|
|
Kefyalew T, Tefera H, Assefa K, Ayele M (2000).Phenotypic diversity for qualitative and phonologic characters in germplasm collections of tef (Eragrostis tef). Genetic Resources and Crop Evolution 47:73-80. |
|
|
Keneni G, Simane B, Gebeyehu G (1997). Genetic diversity of groundnut germplasm in Ethiopia. Ethiopian Journal of Agricultural Science 16(1&2):1-13. |
|
|
Mahalanobis PC (1936). On generalized distance in statistics. National Institute of Science of India 2:49-55. |
|
|
Manly BFJ (1986). Multivariate Statistical Methods: A Primer. Chapman and Hall, London. |
|
|
Missihoun AA, Agbangla C, Adoukonou-Sagbadja H, Ahanhanzo C, Vodouhè R (2012). Traditional Management and Status of Genetic Resources of Sorghum (Sorghum bicolor L. Moench) Northwest of Benin. International Journal of Biological and Chemical Science 6:1003-1018. |
|
|
Phillips S (1995). Poaceae (Gramineae). In: Hedberg I, Edwards S (eds). Flora of Ethiopia and Eritrea 7. Addis Ababa, Ethiopia and Uppsala, Sweden. |
|
|
Plaza-Wüthrich S, Cannarozzi G, Tadele Z (2013). Genetic and phenotypic diversity in selected genotypes of tef [Eragrostis tef (Zucc.)] Trotter. African Journal of Agricultural Research 8:1041-1049. |
|
|
Plaza-Wüthrich S, Blösch R, Rindisbacher A, Cannarozzi G, Tadele Z (2016). Gibberellin deficiency confers both lodging and drought tolerance in small cereals. Frontiers in Plant Science 7:643. |
|
|
SAS Institute (2002). SAS/STAT guide for personal computers, version 9.00 edition. SAS Institute Incorporated, Cary, NC. |
|
|
Singh RK, Chaudhary BD (1985). Biometrical Methods in Quantitative Genetic Analysis. Kalyani Publishers, New Delhi-Ludhiana. |
|
|
Singh BD (1990). Plant breeding: Principles and methods. Kalyani Publishers, New Delhi. |
|
|
Tsegaye T (1992). Vertisols of the Central Highlands of Ethiopia. Characterization, Classification and Evaluation of the Phosphorus Status. MSc Thesis, Alemaya University of Agriculture, Dire Dawa, Ethiopia. |
|
|
Tefera H, Ketema S, Tessema T (1990). Variability, heritability and genetic advance in tef [Eragrostis tef (Zucc.) Trotter] cultivars. Tropical Agriculture 67:317-320. |
|
|
Teshome A, Baum BR, Fahrig L, Torrance JK, Arnason TJ, Lambert JD (1997). Sorghum [Sorghum bicolor (L.) Moench] landrace variation and classification in North Shewa and South Welo, Ethiopia. Euphytica 97:255-263. |
|
|
Vavilov NI (1951). The Origin, Variation, Immunity and Breeding of Cultivated Plants (translated from Russian by K. Star Chester). New York, Ronald Press, pp. 37-38. |
|
|
Vernooy R (2003). A Focus: Seed the World. Participatory Plant Breeding. CRDI, Canada, p. 120. |
|
|
Wallace DH, Yan W (1998). Plant breeding and whole system crop physiology: Improving crop maturity, adaptation and yield. University Press, Cambridge, UK. |
|
Copyright © 2024 Author(s) retain the copyright of this article.
This article is published under the terms of the Creative Commons Attribution License 4.0


