ABSTRACT
This paper estimated the market shares of four shopping centres/super markets within the Tamale metropolis in Ghana. It employed the Huff model: a probabilistic gravitational model adopted as alternative in the computation and estimation of probabilities and attractiveness as well as the distance in mileage covered by prospective customers to the shopping centres/super markets. The research revealed that 75% of the shopping centres did not have the capacity to compute their own market shares. The computational analysis of four supermarkets under the study are as follows: Supermarket A: 33% market share, Supermarket B: 28% market share, Supermarket C 22% market share and Supermarket D: 17% market share. The paper emphasizes the need for managers of shopping centres/supermarkets to apply tested and proven scientific methods to compute their market shares.
Key words: Grocery industry, Huff model, estimation of market shares, supermarkets in Tamale - Ghana.
Evidence from the literature regarding the Huff model points to its malleability and manipulative nature. Over the years, a series of studies on the modification of the Huff model have been carried (Kim et al., 2011) predicting potential retail markets in South Korea; (Huff, 2003) predicting consumer spatial behavior, delineating trade areas, locating retail and service facilities; (Ramanathan, 2009) ‘Estimating relative attractiveness of locations using data envelopment analysis failing to include its applicability in the estimation of market shares.
This paper seeks to estimate the Market shares of four selected shopping centres within the Tamale metropolis in Ghana using the Huff Model. This model was employed to compute and estimate three-dimensional elements - the distance covered in mileage by customers to these centres, the attractiveness and probability as well as their expenditure budgets. Key computational requirement necessary for the operation of this model include (i) the size of the shopping centres, (ii) the propensity of customers to travel and (iii) the populations of the four (4) selected communities within the catchment areas of the shopping centres.
The fundamental objective of every firm is to improve upon its existing market share.Among other things, companies pursue this objective by appealing to larger demographics, lowering prices or through aggressive mass advertising campaigns. Unfortunately in Ghana market share calculation and its implication on the future prospects on firms and their operation is quite low most especially among small and medium scale enterprises. What seems to be the overall objectives of SMEs especially in Ghana is the proclivity to survive rather than the intricacies of market share calculations. Supermarket owners are mostly interested in estimating their volume of sales and profits on daily and weekly basis. However, the fundamental problem associated with this volume approach is that, it does not portray the actual performance of the company since sales are only one element amongst the several parameters that determines how much the company is able to obtain from the market. Another problem with this volume approach is that it requires the total volume of sales figures from the entire grocery industry which is unavailable at the statistical services in Ghana, signifying that any calculations of the market share without this vital parameter would render the outcome unreliable. The consequences thereof include; (i) erroneous and inaccurate sales forecasting values, (ii) unreliable predictive assumptions, (iii) poor decision-making at management level (iv) and likely reduction in the profitability levels and others.
In the light of the enunciated problems aforementioned, this paper seeks to adopt the Huff model to address the inefficiencies and complexities involved in market share estimation of super markets in Ghana.
Introduced over some forty years ago, the Huff model is suitable for the formulation and evaluation of business location decisions analysis. It has been tested and proven to be viable and reliable, hence, can assist management to take sound decisions that can impact positively on the fortunes of a company. This model is constructively manipulative and conceptually appealing. It is easy to operationalize and is applicable to a wide range of problems in predicting outcomes that would have hitherto been difficult (Huff and McCallum, 2008). This tool has been used by analysts and academics to, among other things, estimate market potential, define and analyze trade areas, evaluate market penetration, assess economic impact, predict consumer shopping selections, profile and target consumers, forecast sales of existing and potential outlets and assess the impact of environmental changes (Huff and McCallum, 2008).
Scientists’ knowledge and understanding of the world is often presented in the form of models. The scientific method is one of creating, verifying and modifying models of the world. The goal of the scientific method is to simplify and explain the complexity and confusion of the world. The applied scientist and technologist then use these scientific models to predict and control the world (Stockburger, 1998).
Models
A model is ‘a representation containing the essential structure of some object or event in the real world’ (Stockburger, 1998). The representation may take two major forms: (i) Physical, as in model airplane or architect’s model of building (ii) Symbolic, as in a natural language, a computer programme, or a set of mathematical equations. In which ever form these models may appear, they often form the basis for taking strategic business decisions. A business model is “the content, structure, and governance of transactions designed so as to create value through the exploitation of business opportunities” (Zott et al., 2010). Models are a representation of a system that allows for investigation of the properties of the system and, in some instances predictions of future outcomes (Stockburger, 1998). Models are normally used both in quantitative and technical analysis and in other cases for fundamental analysis. Evidence from the literature shows that models are either abstract or quasi-abstract in nature. Psillos (2011) reinforced this position by arguing that “Idealization and abstraction are indispensable for the construction of theoretical representations of worldly systems, but their products - the models are not worldly systems. What exactly models are, might still be a matter of dispute, but a central thought is that models (or at least some models) are abstract entities”.
The Huff model
The Huff model is a gravitational model based on Newton’s Law of Gravity. The probability of a given customer shopping at a particular super market becomes greater as the size of that supermarket increases and the distance or travel time to the super market decreases (Huff and McCallum, 2008). Gravity models are based on the assumptions that a certain radius or group of customers within a radius are drawn to stores in a particular area on the basis of variables such as distance to the super market, distance between supermarkets, relative population, store size etc. Huff’s model was originally intended as a tool to forecast trading area size. Extensions to the model are commonly made to change the forecast output to retail demand. Such extensions include the number of customers, expenditure levels, and the number of trips made by the consumer to purchase goods within a specified time frame (Vinturrella, 2004). Considering Huff’s probability and market size variables into a market share produces a more intuitive form of the model. Following the ideas of Francica (2002), the Huff model was described widely as the industry standard for determining the probability of a retail location to attract customers.
Extensions to the Huff model
One major criticism against the original Huff model is that it is over-simplistic since it considers just two factors or variables in describing consumer patronage (Colome and Serra, 2001). Following this critique, some extensions to the model were made to consider additional factors in describing consumer patronage. Nakanishi and Lee (1974) extended the Huff model by including additional factors to represent a facility’s attractiveness (instead of just the area as the only attractiveness attribute in the original Huff model). Subsequently, more factors have been considered in the location model, such as consumer opinion of facility image, facility appearance, number of checkout counters and credit card services to capture the attractiveness, and travel distance and physical distance for the measure of unattractiveness (Thang and Tan, 2003). A more general model considering several factors for a competitive location problem is sometimes known as the multiplicative competitiveness interaction (MCI) model (Gonzáles-Benito et al., 2000; Colome and Serra, 2001).
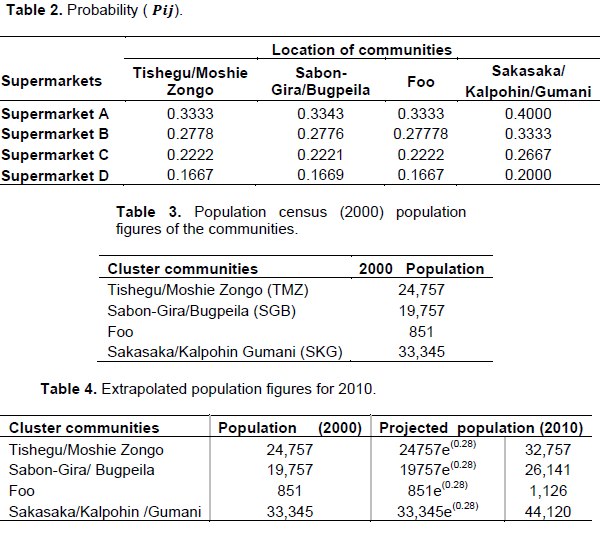
This study was conducted in four selected super markets within the Tamale metropolis. For the purpose of this paper, the names of these selected super markets have been withheld for ethical reasons. However, they are designated as SUPERMARKET-A, SUPERMARKET-B, SUPERMARKET-C and SUPERMARKET D. These stores were purposively sampled. This because each of these supermarkets was considered based on the location theory posited by (Plastria, 2001) as cited in (Ramanathan, 2009) among other authors. Factors like proximity to the principal streets of the Tamale metropolis and the strategic location of these supermarkets were the key factors that influenced the choice of these four. A good location therefore can lead to strong competitive advantage, because location is considered as one of the elements of the retail marketing mix that is “unique” and thus cannot be imitated by competitors” (Zentes and Morschett, 2007). Again, the population of customers within the immediate catchment areas of these supermarkets were considered for the study. These areas included; Tishegu/Moshie zongo; Sabon-Gira/Bugpeila; Foo and Sakasaka/ Kalpohin/Gumani. At the time of conducting this study, the 2010 population figures for these selected communities were not available. Consequently, the researchers adopted the exponential population growth model to extrapolate the population of these selected communities from 2000 to 2010 based on the 2000 population census figures. 200 customers, who were randomly sampled, participated in the study. This afforded each customer an equal opportunity of participation in the study. In computing the market share of these supermarkets, the three fastest selling products from each supermarket were identified from the database of scannable barcodes systems. The floor sizes of each of these supermarkets were established by using the engineering designs of these facilities whilst the information on the distances in millage from these catchment areas to the supermarkets was obtained from the Office of Urban Roads Department in the Tamale Metropolis.
Algorithms of the Huff model
In the Huff model, the probable demand from population Centre i that will be attracted to retail location j is estimated as per the following steps (Fitzsimmons and Fitzsimmons, 2004).
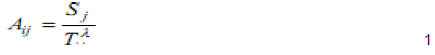
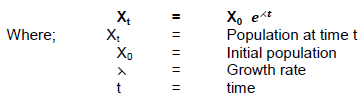
Step 1: Attractiveness of a facility is expressed as:
Where Aij is the attraction to facility j for customers in area i, Sj is the size of the Supermarket in the study area (e.g., square feet), Tij is the travel time from area i to facility j and λ is a parameter reflecting propensity to travel (λ > 0). For the purpose of this study λ is assumed to be 3 which is an average figure between 3.19 and 2.72.It also assumed that customers exhibit similar demographic characteristics and equal shopping behavior (Susilawati, Yakobus, & Sulistyawati, 2002). Normally travel time is assumed to be proportional to the distance travelled. The study is assuming that the distances to the various shopping centres from the catchment areas are equidistant and customers do not rely on the same mode of transportation to these shopping centres.
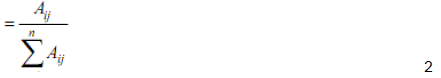
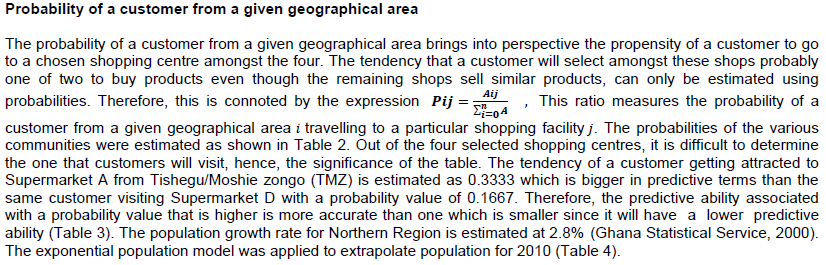
Step 2: If there are several facilities competing for the patronage of the same set of customers, the probability Pij of customers in an area i travelling to a particular facility j is computed as:
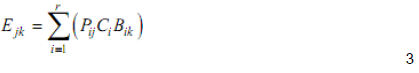
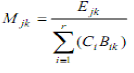
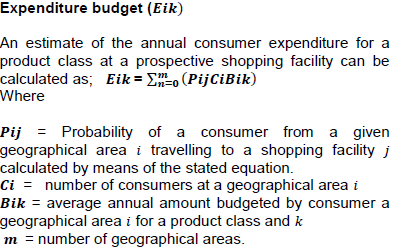
Step 3: The annual customer expenditures Ejk for a product class k at a facility j is calculated as:
Where Ci is the number of customers in area i, Bik is the average annual amount budget for product class k for customers in area i and r is the number of customer areas in the region or the number of statistical areas. In this case study k represents the products like salt, milk, soap, Milo, Toothbrush Tooth paste, e t c that customers buy at the shopping facility.
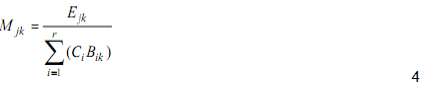
Step 4: Finally, the market share Mjk captured by facility j of product class k is calculated as:
DISCUSSION AND PRESENTATION OF RESULTS
Computational analysis
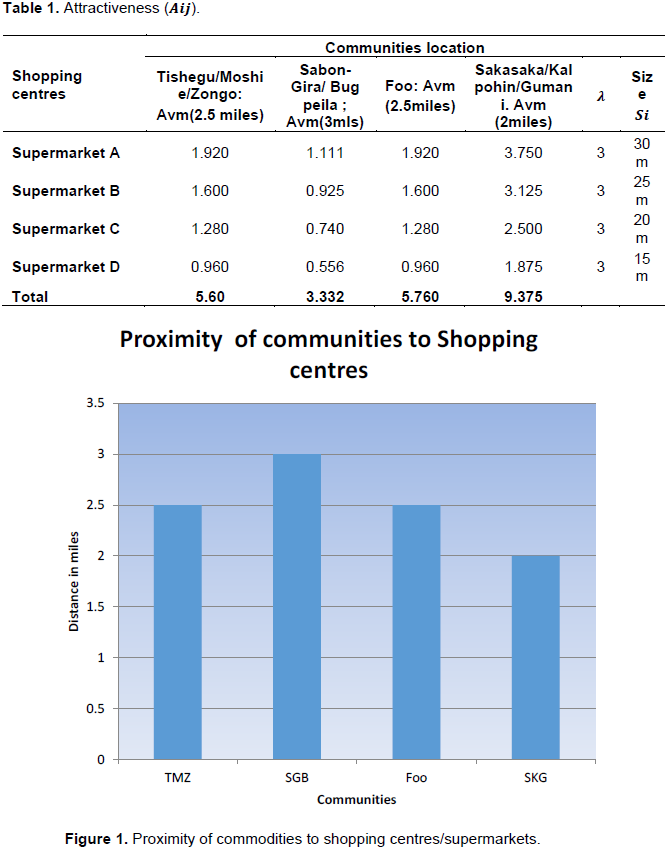
The selected communities for the study included Tishegu/Moshie zongo (TMZ), Sabon-Gira/Bugpeila (SGB), Foo and Sakasaka/Kalpohin/Gumani (SKG) as represented by the attached codes. The calculation of the estimates of attractiveness of the customers from the four communities of the case study to the various shopping centres can be found in Table 1. The value of attractiveness was obtained by dividing the size of the shop by the value of the average mileage travelled by the customer to the supermarket. For instance the attractive-ness of a customer from Tishegu/Moshie zongo to supermarket A.
Attractiveness of customers from the communities to the shopping centres
Table 1 shows the attractiveness of customers from the four selected communities to the four study supermarkets. Customers from Sakasaka/Kalpohin/Gumani (SKG) are more attracted (9.375) to the shopping centres than any of the selected communities and the least (3.332) being customers from Sabon-Gira/Bugpeila(SGB).
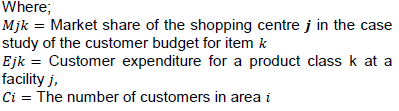
The bar chart in Figure 1 shows the proximity of the communities to the shopping centres. It revealed that communities which were relatively closer to these shopping centres patronized relatively more of the products of these supermarkets. This is obvious because it is consistent with the location theory (Stockburger, 1998). For example, SKG community is closest and SGB appears farthest relative to FOO and TMZ communities, hence, accounting for the high level of attractiveness registered by Supermarket A.
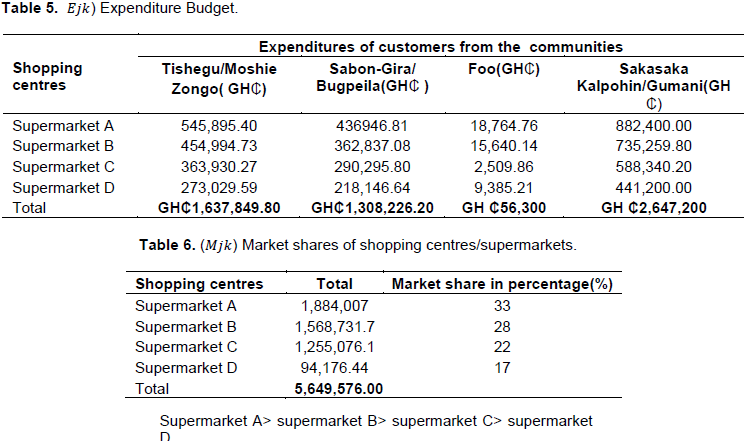
Average monthly budget of individual customers were estimated and used for the computation of their monthly expenditure. The estimation was arrived at by using the fastest selling item. The data for the calculation of the customers’ expenditure budget was derived from the database of the four shopping centres. The results from the table above indicate that the highest expenditure budget of (GH₵1,637,849.80) emanated from Tishegu/ Moshie zongo (TMZ) community whilst the lowest expenditure budget (GH ₵56,300) came from the FOO community (Table 5).
Market shares of the Supermarkets
The market shares estimation is computed by:
The results show that Supermarket A has the highest market share (33%) followed by Supermarket B (28%), Supermarket (22%) and eventually Supermarket D (17%) (Table 6).
Evidence from this paper points to the fact that shopping centres with very large floor spaces tend to attract more customers relative to shopping centres with smaller floor space. Again it is clear from the study that the culture or habits of market share calculation among owners of shopping centres within the Tamale metropolis is low. This could be attributable to the fact that the proclivity to survive rather than the intricacies of market share calculations remains the immediate preoccupation of owners of these shopping centres.
The immediate emphasis of the owners of these centres is the volume of sales and profits on daily and weekly basis hence the finding of this paper that owners of shopping centres within the Tamale metropolis did not understand the implications and relevance of market share to their operations did not come to this paper as a surprise.
Most business executives should be given the rightful exposure about how to calculate their market shares with in-built Huff model software through seminars, training programmes, discussion and specially organized fora.
Executives of supermarkets should take into cognizance the floor size of their supermarkets since the larger the floor size, the more attractive the super market is to prospective customers. For tax purposes, it is recom-mended that Government revenue agencies could adopt this model to help them track down firms or SMEs that have the habit of evading tax.
Though the habit of market share calculation among owners of shopping centres within the Tamale metropolis is low, this statement may not be generalized for the entire country since Tamale is situated in the rural northern part of the country where the average per capita income is relatively low.
It is also recommended that sales discounts and aggressive promotions and advertising campaigns be adopted by owners of these shopping centres to boost their sales and subsequently market shares.
The authors have not declared any conflict of interests.
REFERENCES
|
Colome R, Serra D (2001). 'Supermarkets key attributes and location decisions: a comparative study of British and Spanish 'consumers working paper' Ref.149. Barcelona, Spain: Department of Economics and Business, University of Pompeu Fabra.
|
|
|
|
Fitzsimmons J, Fitzsimmons M (2004). Service management operations, strategy, and information technology, 2nd Edition. Wisconsin: The McGraw-Hill Companies Inc.
|
|
|
|
|
Francica JR (2002). "Are Retail Attractiveness (Huff) Models Misused?" Volume 15, Number 6. GEO World.
|
|
|
|
|
Ghana Statistical Service. (2000). Population and Housing census. Accra,Ghana: Ghana Statistical Service.
|
|
|
|
|
Gonzáles-Benito O, Greatorex M, Munoz-Gallego PA (2000). 4. Assessment of potential retail segmentation variables. An approach based on a subjective MCO resource allocation model. J. Retailing Consumer Services pp. 171-179.
Crossref
|
|
|
|
|
Huff D, McCallum MB (2008). Callibrating the Huff model using ArcGIS model business analyst. ESRI 380 Newyork st., Redlands, CA92373-8100USA.
|
|
|
|
|
Huff LD (2003). Parameter estimation in the Huff model. Boston,USA: ArcUser.
|
|
|
|
|
Kim PJ, Kim W, Chung WK, Youn MK (2011). Using new Huff model for predicting potential retail market in South Korea. Afr. J. Bus. Manage. 5(5):1543-1550.
|
|
|
|
|
Nakanishi M, Lee CG (1974). Parameter estimation for a multiplicative competitive interaction model- Least Squares Approach. J. Market. Res. 11:303-311.
Crossref
|
|
|
|
|
Plastria F (2001). Static competitive facility location: An overview of optimization approaches vol.129. Euro. J. Operat. Res. pp. 461-470.
|
|
|
|
|
Psillos S (2011). living with the abstract: realism and models. DOI 1007/s11229-009-9563-3.
Crossref
|
|
|
|
|
Ramanathan R (2009). 'Estimating relative attractiveness of locations using data envelopment analysis. Int. J. Bus. Perform. Supp.chain Modell. 1(1):99-113.
|
|
|
|
|
Stockburger DW (1998). Introductory Statistics: Concepts, Models, and Applications available at
View.accessed on 15th May 2015.
|
|
|
|
|
Susilawati C, Yakobus S, Sulistyawati L (2002). The influence of travel time and size of shopping center towards the frequencies of visiting cstomers in shopping centers in surabaya. 8th PRRESS conference proceeding, Christchurch, Newzeland pp. 1 - 7.
|
|
|
|
|
Thang L, Tan B (2003). Linking consumer perception to preference of retail store; an assessment of the multi-attributes of store image. J. Retailing consumer services 10:193-200.
Crossref
|
|
|
|
|
Vinturrella B (2004). Demand Forecasting for Wholesale Businesses. . New Orleans: Tammany supply Inc.
|
|
|
|
|
Zentes J, Morschett SK (2007). Strategic Retail Management. Wiesbaden: Gabler.
|
|
|
|
|
Zott C, Amit R, Massa L (2010). The Business Model: Theoretical roots, recent developments, and future research, working paper. WP – 862.
|
|