ABSTRACT
Outsourcing noncore activities are the best solution for many organizations. This study was conducted to study the comparative analysis of university community satisfaction on outsourcing in some selected universities in Ethiopia using both primary and secondary data. Samples were taken from students, teachers and support staff of four universities. The research identified that by outsourcing the different non-core services universities were able to enjoy advantages such as improved resource management, administrative burden decreased, decreased staff complains, timely and quality service improved, operational and recruitment cost decreased. The research has also found that students, support staff and teachers of outsourced universities have a higher level of satisfaction than the non-outsourced counterparts. Based on the findings, the researchers recommend that Samara University can better satisfy its community through outsourcing non-core activities.
Key words: Outsourcing, satisfaction, non-core service, analysis of variance (ANOVA).
Recently, increasingly rapid changes in all aspects of the environments, and in technology and international deregulation have challenged large corporations to compete on a global scale (Hendry, 1995). To meet this competition the giants had to learn to dance, to be flexible themselves, and to “do more with less”. Critically reviewing the sources of their value-added, many were beginning to contract out non-core functions and move towards to fast-moving, fashion-based industries (Hendry, 1995).
According to Sparrow (2004) outsourced projects pose a serious security threats especially in case of customers data protection and firms other confidential matters. According to Swartz (2004) security and privacy risk is greater when off shoring takes place and companies send most sensitive customer information to the vendor. The supplier’s inability to maintain confidentiality is a question mark for outsourcing particularly to an offshore destination.
Outsourcing is growing at an exponential rate, as the
increasingly global marketplace sees an array of competitive factors such as cost, speed, quality, volume, flexibility, and innovation becoming increasingly important, leading firms to move from transactional outsourcing to using more strategic outsourcing as a means of achieving competitive success. Firms which achieve success in their international business are those that perceive the changes in the international environment and who are able to develop strategies that enable them to respond accordingly (Gilley and Rasheed, 2000).
Outsourcing has been in business literature for many years and it has been observed that firms are outsourcing to leverage production to achieve economy of scale and lower the cost, for instance 30 to 40% of Nokia mobile production has been outsourced (Shy and Stenbacka, 2005). “Outsourcing refers to the practice of transferring activities traditionally done within a firm to third party providers within the country or “off-shore” (Sen and Shiel, 2006).
According to Offshore outsourcing is an old phenomenon and many of the multinational companies’ strategies’ to bring the operating cost down. Outsourcing is handing over one or many of the business processes to an outside vendor or the utilization of outside available services provided by third party to carry out business activities is the outsourcing strategy.
Outsourcing does not come without risks; one main risk is that companies leave the supply of the products or services in the hands of someone whom they cannot control, contrary to controlling their own supply (Meresea, 2007).
Globally, outsourcing becomes more sophisticated and complex. The functions that are being outsourced ranges: from non-core functions like janitorial service to the core or main function such as production and marketing (Meresea, 2007). The problem is that organizations have difficulties in selecting, contracting and managing an outsourcing’s service provider in ensuring the expected benefit.
This study attempts to make an important contribution to the management of the university by exploring the satisfaction of university on the issue of outsourcing non-core services. Particularly, addresses the following questions: What common challenges will affect the ability of the university to successfully outsource services? What opportunities will be available for the university because of outsourcing non-core functions of the university? What are the reasons for outsourcing non-core functions? These questions will be answered through a survey carried out in different sampled government universities.
Research questions
(1) What is the students and employee’s attitude towards the level of outsourced services in universities?
(2) What are the challenges and opportunities of outsourcing non-core services in the universities?
Objectives of the study
General objective
(1) To examine the satisfaction and attitude of university community towards outsourced services in universities.
(2) To identify the subjective challenges and opportunities for outsourcing in universities.
Hypothesis of the study
H0: There is no difference in the level of satisfaction between outsourcing and non-outsourcing universities.
H1: Outsourcing results difference in the level of satisfaction between outsourcing and non-outsourcing universities.
Outsourcing definition
The business environment has undergone major changes, particularly in the last six decades. And companies are under significant pressure to maintain and increase their profitability as well as customer service and market share in a global economy. Outsourcing is one more approach that can lead to greater competitiveness (Weston, 1996; as quoted by Embleton and Wright, 1998). Greaver (1999) supports this view and indicates the need for organizations to think about how they should deal with market pressures.
Motivations for outsourcing
There are three major categories of motivations for outsourcing: cost, strategy, and politics. The first two commonly drive outsourcing by private industry. Political agendas often drive outsourcing by public organizations (Kakabadse and Kakabadse, 2000). While there may be three categories, outsourcing activities are likely to be initiated for more than one reason and in fact, may be driven by elements from all three categories. For example, the outsourcing of taxing and health services for the British government was driven by elements from both the cost and political categories (Willcocks and Currie, 1997). The political climate favored privatization because of the belief that private firms are more efficient and provide better service than public counterparts. Cutting the cost of providing services also drove the British government’s outsourcing efforts.
Outsourcing advantages
Outsourcing helps to avoid the costs associated with bureaucracy typically associated with production inside the firm (D‘Aveni and Ravenscraft, 1994; Jensen and Meckling, 1976). Finally, outsourcing opens up the possibility of obtaining rents from relations with suppliers (Dyer and Singh, 1998; Linder, 2004). While firms may now have the opportunity to outsource, outsourcing initiatives do not necessarily fulfill all their expectations. Writing a poor contract and losing control over the outsourced activity has the largest impact on the (negative) outcome of outsourcing efforts (Barthelemy, 2003).
Impact of outsourcing on business performance
An outsourcing project can have both positive and negative impacts on business performance. The outcome ultimately depends on the way the company goes about the outsourcing project and what support the project receives from top-level management. Furthermore, the phase the company is at in the outsourcing project can have a direct impact on business performance. For example, just before or just after signing the contract the benefits reported by companies are not actual but projected benefits, which could lead the company into many problems if they do not consider this (Barthelemy, 2003). The impact of outsourcing can be divided into reasons and challenges of outsourcing.
The expected benefits of outsourcing
The rapid growth of outsourcing suggests that both public and private organizations expect benefits from outsourcing. Naturally, different organizations in different circumstances will expect different benefits. For example, all organizations may expect costs savings even though in government outsourcing, the typical cost savings are only about half of what the private sector achieves (Kakabadse and Kakabadse, 2000). The expected benefits of outsourcing may include realizing the same or better service at a lower overall cost, increased flexibility and/or quality, access to the latest technology and best talent, and the ability to re-focus scarce resources onto core functions. For the political organization, additional expected benefits may include better accountability and management, and a better political posture. There also appears to be an expected benefit of mimicking competitors or “getting rid” of troublesome functions (Willcocks and Currie, 1997).
Potential risks of outsourcing
As with any process, there is a negative side to outsourcing. However, many of the disadvantages of outsourcing are the flipside of the advantages or gains and may arise mainly due to poor outsourcing decisions and management. Embleton and Wright (1998) and Lankford and Parsa (1999) add that determining core competencies, which is key to the outsourcing decision, can be difficult, and a mistaken decision, very costly. They go on to point out that despite the sound financial appeal, outsourcing is also a subject that is still fraught with emotional overtones. The fear of losing control, for example, is a major emotional stumbling block to outsourcing. Companies are also averse to the idea of provider dependency. According to Greaver (1999), outsourcing problems can generally be divided into people, process, technology and other problem areas. People problems can have many causes, from the loss of key people too poor performance to people not getting along well together. Process problems generally result from how the operations are set up; how decision rights, responsibilities, and authorities are distributed; and how the activities are defined. Technology problems generally relate to the acquisition, implementation, and maintenance of equipment or systems. These problems can have their root causes in either party and addressing the problems is a shared responsibility.
Data source, data type and sampling design
Source and type of data
This study was conducted on selected universities in Ethiopia, namely, Adigrat University (ADU), Axum University (AXU), Debre Birhan University (DBU) and Samara University (SU). Among these universities, the first three outsourced some of their non-core services whereas SU is yet to decide on outsourcing of its non-core services. The first three universities were chosen considering some factors such as their experience, similarity of the year of operation with SU, their distance from the center.
In the study, primary data, as well as secondary data were used. The sources of data were students, staffs, directors and vice presidents of the universities. Primary data was collected from students, academic and support staffs, directors and vice presidents of each university. Questionnaires were developed for all respondents, whereas interviews were used in addition to questionnaires. Questionnaires consisting of both closed and open-ended questions for (the vice presidents, procurement directors and staffs, finance directors and staffs, human resource management directors and staffs, estate and facility management directors and staffs, and student service directors) were used. Data was collected about the personal characteristic of the respondent, the level of satisfaction obtained from the various services given by the universities which are considered in this study.
Secondary data was collected from the published and unpublished documents, contract agreements, and procedural manuals.
Sampling technique and sampling design
Two-stage cluster sampling was used to select sample students. In the first stage, graduating students were identified from total students because graduating students spend more years in the university than the rest and know well the services that have been provided. In the second stage, cafeteria users were selected from non-users and which simple random sampling was drawn. The need to select cafeteria users was because only these groups knew the cafeteria service.
On the other hand, a simple random sampling technique was used to draw samples from staffs (support and Academic) of the universities.
Samples drawn from each university were different in size because the universities have a different number of students, teachers, and support staffs enrolled in the year the study was undertaken.
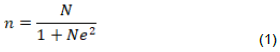
In this study, the researchers selected samples from all four universities. The sample size for the study is calculated using Yamane formula for sample size determination (Yamane, 1973).
Where

is sample size;
N is total population and

is a probability of error. The level of error was 10%.
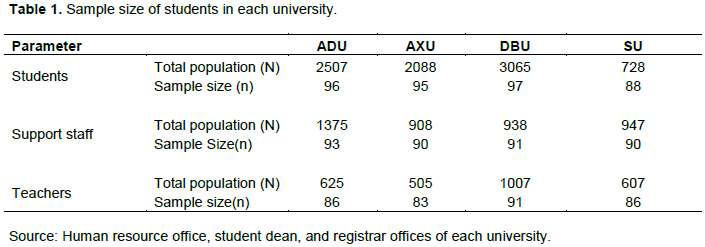
Accordingly, Table 1 shows the sample sizes drawn from each group of respondents and from each university.
Method of data analysis
Two methods of data analysis were used in the study. The first part used an econometric analysis which was used to analyze the model. A model was specified to measure the satisfaction of the university community from the services they have been getting from their universities. In order to estimate parameters with high precision, high efficiency and unbiasedeness, standard tests of CLRM including homoscedasticity, multicollinearity, and normality tests were undertaken.
The second method of data analysis used was a descriptive analysis which was used to analyze the reasons, challenges, and opportunities for outsourcing.
Model specification: The ANOVA model
The attempt in the study was to see if there was a statistically significant difference in the average level of satisfaction obtained from the services (janitorial service, cafeteria service, and security service) between the outsourced universities (ADU, AXU, and DBU) and the non-outsourced university (SU in this case).
To enable comparison of satisfaction between SU and the rest, the names of the universities were incorporated as a dummy variable. This enables to estimate the mean level of satisfaction and to test whether a statistically significant difference in the level of satisfaction was present.
When all the regressors are dummies, an ANOVA model can be specified to make meaningful comparison across those dummy regressors (Gujarati, 2003). Accordingly, the model was specified, to make a comparison of satisfaction across the four universities, as:
The dependent variable being estimated was, the level of satisfaction of the person (student, Academic, or support staff) from the service being given to. It was measured using a Likert scale rated as “strongly agree”=5, “agree”=4, “neutral”=3, “disagree”=2, and “strongly disagree”=1.
When the dependent variable ordered such as this, OLS estimates give an average level of the variable/the category whereas (ordered) logit estimates give the probability that a particular category will occur along with the cut-points. Even though OLS is affected by the values attached to each category, it was chosen in this study because it was intended in the study to show the mean difference across categories.
SU is omitted from Equation 1. When a category is omitted, it is called a benchmark or omitted category. As a result, the interpretation of the estimates of the coefficients is done with respect to SU (the omitted category). An omitted category assumes the value of the constant term. Since SU is the omitted category, it provides two purposes. One, the estimate makes comparisons of satisfaction between SU and the rest of universities easily. Two, omitting a category overcomes the problem of multicollinearity.
In the study, the services students, academic and support staff obtained were not identical. For example, academic and support staffs get janitorial service and security services. Students, on the other hand, get all the student cafeteria service, janitorial service, and security service. As a result, it was found plausible to estimate mean satisfaction of students, academic and support staff separately.
Perception of students, teachers and support staff towards janitorial service
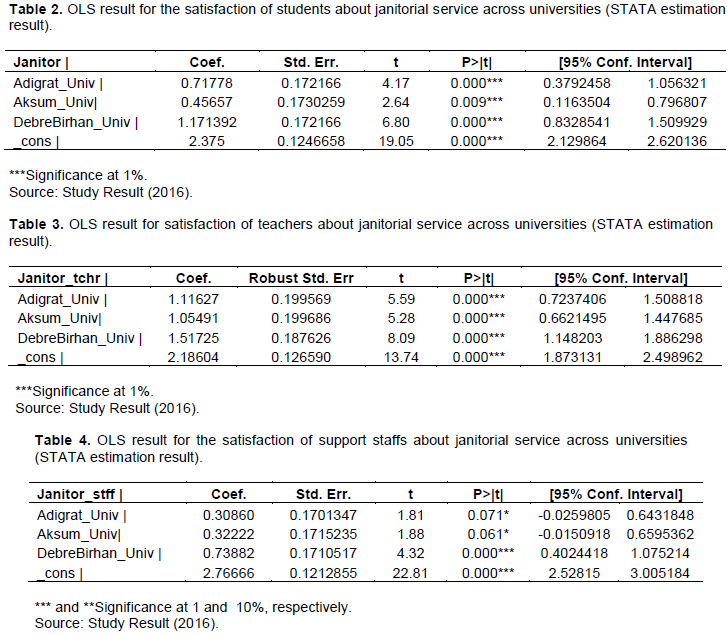
Tables 2, 3 and 4 show separate estimates of perception/ satisfaction of students, teachers and support staff towards janitorial service.

Table 2 shows the estimation result for the satisfaction of students about janitorial service for Adigrat University, Aksum University, Debre Birhan, and Samara University. Samara University represented by the constant term (_cons) is the omitted category, hence serves as a benchmark or reference category for comparison among universities.
The coefficients of all universities are statistically significant at 1% level. Hence, statistics are on our side to reject the null hypothesis stating that there is no average difference of satisfaction of students across the four universities. Accordingly, the following interpretations of coefficients universities are made.
The mean or average estimate of janitorial service, as rated by students of Samara University, is 2.375 and it is found statistically significant. Since SU is the benchmark or omitted category, the rest coefficients indicate the difference in the level of satisfaction from Samara University. For example, a statistically significant coefficient of Adigrat University shows that the average satisfaction of students at Adigrat University is greater than average satisfaction of students at Samara University by the estimated value of 0.71778.
Similarly, the average satisfaction of students of Aksum University is greater than average satisfaction of students of Samara University by the estimate equal value of 0.45657.
Again, the average satisfaction of students of Debre Birhan is greater than average satisfaction of students of Samara University by the estimate equal value of 1.171392.
Since ADU, AXU and DBU have outsourced and since SU does not, the higher satisfaction of students from janitorial service than SU may be because of the improvement of the service brought by outsourcing. To make things clear, when universities outsource services, they set service level agreements and make frequent controls, follow-ups and take corrective measures if services are not being delivered according to service level agreements.
Table 3 also shows the OLS estimate of satisfaction of teachers from janitorial service in ADU, AXU, DBU, and SU.
All the coefficients are significant at 1% level. The estimate for the coefficient of Samara, the benchmark, is 2.18604. The rest coefficients indicate the mean difference in satisfaction from Samara University. The coefficient of Adigrat University shows that the average satisfaction of teachers at Adigrat University is greater than average satisfaction of teachers at Samara University by the estimated value of 1.11627.
Furthermore, the average satisfaction of teachers of Aksum University is greater than average satisfaction of teachers of Samara University by the estimate equal value of 1.05491. In Addition, the average satisfaction of teachers of Debre Birhan University is greater than average satisfaction of teachers of Samara University by the estimate equal value of 1.51725.
Lastly, the OLS estimate for the satisfaction of support staff is shown in Table 4.
Here also, all coefficients are significant but at the different level. Particularly, the coefficients of ADU and AXU are significant with less precision (10%). The average estimate of janitorial service for support staffs of Samara University is 2.76666.
A statistically significant coefficient of Adigrat University shows that average satisfaction of support staff at Adigrat University is greater than average satisfaction of support staffs at Samara University by the estimated value of 0.30860. Similarly, the average satisfaction of support staff of Aksum University is greater than average satisfaction of teachers of Samara University by the estimate equal value of 0.32222. Again, the average satisfaction of support staffs of Debre Birhan is greater than average satisfaction of teachers of Samara University by the estimate equal value of 0.73882.
In general, we infer from the three estimates shown in Tables 2, 3 and 4 that SU had less satisfaction as rated by teachers, students and support staff. The reason for this difference can be attributed to outsourcing, because unlike the remaining three, SU does not outsource. Besides, the difference in the average satisfaction of students, support staff and janitorial service was higher for Debre Birhan University. This may be because DBU has longer experience in outsourcing than the rest. This enables it to make strong controlling mechanisms, improve contract agreements, etc.
Perception of students, teachers and support staff towards security service
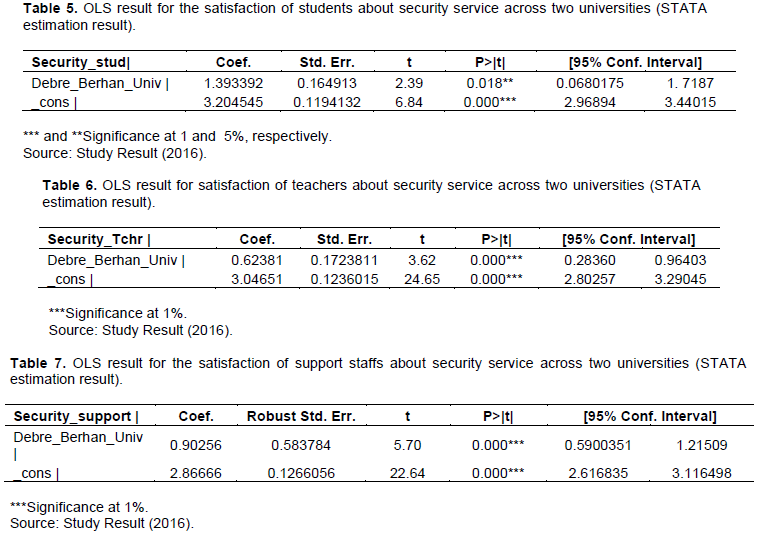
Apart from janitor service, estimates were made for the satisfaction of students, support staff and teachers from security service. Since DBU was the only university which outsourced the service by the time this study was done, we tried to compare satisfaction between DBU and SU.
Tables 5, 6, and 7 show average satisfaction for students, teachers and support staff respectively.
The coefficient of Samara University is 3.204545 and it is found statistically significant at 1% level. On the other hand, the coefficient of Debre Birhan University is significant at 5% level. Since both coefficients are statistically significant, we may infer that the average satisfaction of students of DBU from security service was greater than the average satisfaction of janitor service by the average value of 1.393392. This result is strengthened by the directors’ positive response that theft, crime, and misconduct were reduced after security had been outsourced.
As stated earlier, Table 5 shows the satisfaction of teachers from the security service. Statistically significant coefficients for both DBU and SU indicate that average satisfaction of teachers is greater than average satisfaction of teachers at Samara University by the estimated value of 0.62381.
The last estimate for the satisfaction from security service was done for support staff of both DBU and SU, as presented in Table 7.
Since both coefficients are significant with high precision (1% level), the conclusion is similar to that of estimates for students and teachers. Accordingly, the estimate of average satisfaction estimate of support staff of Samara University is 2.86666. Whereas, the average satisfaction of support staff of DBU is greater than average satisfaction of support staff at Samara University by the estimated value of 0.90256.
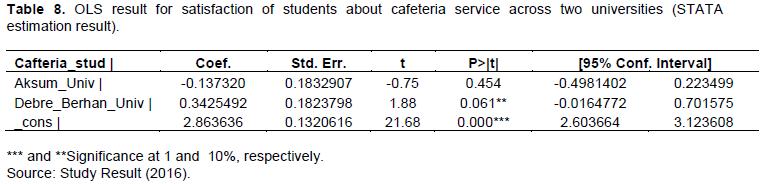
Perception of students towards cafeteria service
Table 8 shows students perception towards the cafeteria service. The estimate shows that the coefficient of DBU and SU are statistically significant. But, the coefficient of AXU is not statistically significant.
The implication is that the average satisfaction of students about cafeteria service at Debre Birhan University is greater than average satisfaction of students at Samara University by a small amount of 0.3425492.
On the other hand, the coefficient of AXU is statistically insignificant. That means, statistically there is no significant difference in average satisfaction between students of AXU and students of SU from cafeteria service. This could be plausible because SU has outsourced student cafeteria partially.
The coefficient of Aksum University is statistically insignificant therefore we do not reject the null that its coefficient is zero.
(1) Outsourcing results difference in the level of satisfaction in the university communities, that is, Students, Academic and support staff of outsourced universities have a higher level of satisfaction than the non-outsourced counterparts.
(2) There is positive attitude towards outsourcing and by outsourcing the different noncore services universities were able to enjoy advantages such as improved resource management, administrative burden decreased, decreased staff complain, timely and quality service improved, operational and recruitment cost decreased.
Based on the findings, the researchers recommend that Samara University can better satisfy its community through outsourcing non-core services.
The author has not declared any conflict of interests.
REFERENCES
|
Barthelemy J (2003). The seven deadly sins of outsourcing. Academy of Management Perspectives 17(2):87-98.
Crossref
|
|
|
|
D'aveni RA, Ravenscraft DJ (1994). Economies of integration versus bureaucracy costs: Does vertical integration improve performance? Academy of Management Journal 37(5):1167-1206.
Crossref
|
|
|
|
|
Dyer J, Singh H (1998). The relational view: Cooperative strategy and sources of inter- organizational competitive advantage. Academy of Management Review 23(4):660-679.
Crossref
|
|
|
|
|
Embleton PR, Wright PC (1998). A practical guide to successful outsourcing. Empowerment in Organizations 6(3):94-106.
Crossref
|
|
|
|
|
Gilley KM, Rasheed A (2000). Making more by doing less: an analysis of outsourcing and its effects on firm performance. Journal of Management 26(4):763-790.
Crossref
|
|
|
|
|
Greaver MF (1999). Strategic outsourcing. A structured approach to outsourcing decisions and initiatives. Amazon Books: New York.
|
|
|
|
|
Hendry J (1995). Culture, community and networks: the hidden cost of outsourcing. European Management Journal 13(2):193-200.
Crossref
|
|
|
|
|
Jensen M, Meckling W (1976). Theory of the firm: managerial behavior, agency costs, and ownership structure. Journal of Financial Economics 3(4):305-360.
Crossref
|
|
|
|
|
Kakabadse A, Kakabadse N (2000). Sourcing: new face to economies of scale and the emergence of new organizational forms. Knowledge and Process Management 7(2):107-118.
Crossref
|
|
|
|
|
Meresea M (2007). Outsourcing in Ethiopia. Unpublished Master's Thesis, Addis Ababa University.
|
|
|
|
|
Lankford WM, Parsa F (1999). Outsourcing: a primer. Management Decision 37(4):310-316.
Crossref
|
|
|
|
|
Linder JC (2004). Transformational Outsourcing. Sloan Management Review 45(2):52-58.
|
|
|
|
|
Sen F, Shiel M (2006). From business process outsourcing (BPO) to knowledge process outsourcing (KPO): Some issues. Human Systems Management 25(2):145-155.
|
|
|
|
|
Shy O, Stenbacka R (2005). Partial outsourcing, monitoring cost, and market structure. Canadian Journal of Economics/Revue Canadienne d'économique 38(4):1173-1190.
Crossref
|
|
|
|
|
Sparrow EA (2004). A guide to global sourcing. BCS, The Chartered Institute.
|
|
|
|
|
Swartz N (2004). Offshoring privacy. Information Management 38(5):24-26.
|
|
|
|
|
Willcocks LP, Currie WL (1997). Information technology in public services: towards the contractual organization?. British Journal of Management 8(1):S107-S120.
Crossref
|
|
|
|
|
Yamane T (1973). Statistics: An Introductory Analysis, 2nd Ed., NeYork: Harper and Row.
|
|