In this study, we examined vegetation structure and regeneration status of woody plants in the Hallideghie wildlife reserve, Ethiopia. We collected data on abundance, height and diameter at breast height (DBH) of woody plant species with DBH >2.5 cm within sixty-six 20 m × 20 m sample plots and counted number of individuals of seedlings (that is, individuals with height <1.5 m) and saplings (height >1.5 m and DBH <2.5 cm) of each species within five 1 m × 1 m subplots nested within each main plot. To describe vegetation structure, we computed DBH and height size frequency distributions of individuals and species importance value indexes (IVI). Overall, we recorded 986 individuals of tree/shrub stems, belonging to 46 woody plant species. Both the number of species and individuals represented in each DBH size class and height size class showed decreasing trends with increasing size classes. However, different species showed varying patterns of DBH size structure. IVI of species varied from 0.3 to 69.1. The average density of seedlings, saplings and matured woody plants in the HWR were 1345, 899 and 374 individuals/ha, respectively. Balanites aegyptiaca and Acacia tortilis, species with high IVIs, were also among those species that exhibited poor regeneration status.
Tropical forests and woodlands are being lost at an alarming rate due to increasing human populations and corresponding land use changes (Pimm et al., 2006; Jhariya et al., 2014; Kittur et al., 2014; Behera et al., 2017). Most of natural vegetation losses are occurring in the tropical developing countries like Ethiopia where the livelihoods of their nations are directly or indirectly linked to natural resources (UNFAO, 2010). Such unprecedented rate of deforestation results in rapid transformation in plant and animal communities, drastically altering not only the ecological processes and functions that maintain appropriate ecosystem services but also is adversely impacting the socio-economic development and well-fare of human-beings (Hurni, 1988; Lemenih and Woldemariam, 2010). Thus, having better ecological information, such as vegetation structure and regeneration status, in protected areas has been growing globally to prioritize species for conservationmanagement actions so as to mitigate the adverse effects posed on them due to the increasing rate of deforestation (Aliyi et al., 2015).
Ethiopia has the fifth largest floral diversity in tropical Africa (Soromessa et al., 2004), which mainly is as a result of the great variations in altitude (ranging from 110 m b.s.l to over 4530 m a.s.l), topography, rainfall and temperature in the country that have provided favorable environmental conditions necessary for the evolution and persistence of a wide variety of floral, as well their-associated faunal species (Yalden and Largen, 1992; Awas, 2007; Lemenih and Woldemariam, 2010; Bayeh, 2013). However, this tremendous wealth of natural resources and biological diversity of the country has been facing serious conservation challenges due to the high (~3% per annum) growth rate of the country’s human population (World Bank, 2013). This high population increase has been causing rapid and widespread conversion of natural habitats (forests, woodlands and grasslands) in the country for human settlements, cultivation, livestock grazing, charcoal and firewood harvesting (Hurni, 1988; Campbell, 1991). These human-associated threats to vegetation cause changes in species’ (i) reproduction and recruitment status of that vegetation (Burju et al., 2013; Aliyi et al., 2015), (ii) population structure (Senbeta, 2006; Aliyi et al., 2015) and (iii) ecological significance (Bekele et al., 2014). Currently, relatively intact natural habitats in Ethiopia are found in protected areas such as National Parks and Wildlife Reserves (Soromessa et al., 2004). However, most of such protected areas of the country have been mis-managed, and lack adequate ecological information on the status of the biophysical resources they contain which would help managers to develop biodiversity conservation plans. This is especially the case of some remotely located protected areas such as the Hallideghie Wildlife Reserve (HWR), which was established in 1965 mainly to conserve the remnant population of the globally endangered Gravy’s zebra (Equus gravii) and other ungulates occurring in the area (Tadesse, 2009; Wami and Mekonnen, 2013).
In addition to its significance for the conservation of several key wildlife species, HWR area is also the major communal livestock grazing area for Afar and Ethiopian Somali pastoral communities (Tadesse, 2009; Kebede et al., 2012). Despite its immense importance for biodiversity conservation and socio-economic development of the surrounding community, the reserve has been subjected to a number of threats, including deforestation, overgrazing, uncontrolled fire, invasion of alien plant species and bush encroachment (Tadesse, 2009). These factors are supposed to lead to decrease in diversity and cover of native and palatable woody plant species, poor regeneration of ecologically important plant species (Khumbongmayum et al., 2006), degradation of wildlife habitats, reduced number of wild animal populations and further promotion of ecosystem invasion by exotic plant species (particularly Prosopis juliflora) in the reserve (Kebede et al., 2012). However, ecological studies on vegetation of the reserve, that would help develop and implement appropriate ecosystem and species management measures, have not been undertaken so far. Specifically, there is lack of information on population structure and regeneration status of vegetation of the reserve. The availability of such information would have helped to (i) understand past and present disturbance histories to species, (ii) forecast the future trend of the populations of different priority species and (iii) to develop threat mitigation strategies (Shimelse et al., 2010). The present vegetation study was, therefore, intended to fill this knowledge gap and to provide valuable ecological information on vegetation of the reserve needed for managers of the reserve to practice informed management decisions. The specific objectives of the study were to examine the population structure (DBH, height, density, frequency and Importance values) and to assess the regeneration status of woody plant species in Hallideghie Wildlife Reserve.
Study area
The study was conducted in the Hallideghie Wildlife Reserve, which is located in the Great Rift Valley in the southwestern Afar Regional State (at 8°30' to 9°30' N and 39°30' to 40°30' E), northeastern Ethiopia (Figure 1). It was established in the 1965 with the main aim to protect the endangered Gravy’s zebra (Equus grevyi) and other several conservation significant mammal and bird species (Hillman, 1993; Tadesse, 2009; Kebede et al., 2012). The reserve covers an area of 1,832 km2 and altitude ranges from 700 m to 945 m a.s.l (Hillman, 1993). The area is characterized by a semiarid ecosystem with annual rainfall ranging between 400 and 700 mm (Gemechu, 1977). The mean seasonal temperature ranges from 25 to 30°C, but the daily maximum temperature may be as high as 38°C in June, while the minimum daily temperature can drop to 15°C in December (Gemechu, 1977).

The landscape in the Halledeghi Wildlife Reserve area is dominated by grassland plain with high mountains rising on the eastern border (Tadesse, 2009). The vegetation of the reserve consists of grasslands, bush land, shrub land, wooded grassland, shrub grassland, gallery/reverie forest and highland forest (Tadesse, 2009; Wami and Mekonnen, 2013). The reserve hosts ~31 and ~213 species of mammals and birds, respectively (EWNHS, 1996). At present, the reserve is home to Ethiopia’s largest population of Grevy’s zebra (Kebede et al., 2012).
Data collection
A reconnaissance survey was undertaken form 2 to 5 September 2015 to get a general overview of the vegetation physiognomy of the study area and identify sampling sites for the data collection. Field data were collected from 6-17 September 2015 along five transects of 2.4-3 km long. Transect layout was done systematically in stratified way to ensure that sample sites cover representatives of major vegetation types occurring in the reserve; namely, savanna (3 transects), riverine (1), thicket bush land (1) and deciduous woodlands (1). Along each transect, twelve to fifteen 20 m by 20 m quadrats (totaling to 66 quadrats) were established at ~200 m distance interval. Accordingly, 12 quadrats in the savanna, 12 in the riverine, 27 in the thicket bush land and 15 in the deciduous woodlands were sampled. For assessment of regeneration status of woody species, number of seedlings and saplings of each species were counted and recorded in five 1 m by 1 m subplots established at each corner and center of each main quadrate. GPS locations of each transect and quadrates were fed in to Garmin 60 GPS and were used for navigation to sampling points.
A complete list of all woody plant species (trees and shrubs; as only three species of lianas were recorded they were treated with shrubs) encountered in each quadrate was made, and for each species number of individual stems were counted and measurements of their diameter at breast height (DBH) and height were taken. Trees and shrubs, and matured/adults, saplings and seedlings were defined following the descriptions of Mueller-Dombois and Ellenberg (1974) and Van der Maarel (1979). Accordingly, trees were defined as a single-stemmed woody plant taller than 5 m; shrub as a multiple stemmed woody plant; seedling as a young woody plant with height less than 1.5 m; and sapling as a woody plant with height greater than 1.5 m but whose DBH is less than 2.5 cm. Circumference of each tree/shrub was measured by meter tape and DBH values were estimated by dividing circumference by phi (3.14) and height was estimated using Santo Clinometers (Newton, 2007). For shrubs and trees possessing several stems rising from below breast height, DBH and height were measured separately for each branch and their average was used for data analysis (Mueller-Dombois and Ellenberg, 1974). In addition, disturbance conditions of the reserve were assessed by recording the presence and degree of different disturbance types (grazing/browsing, fuelwood collection, burning, charcoal production, etc) in and around each quadrate, following Asefa et al. (2015). Species identifications were made at field using floral guidebooks (Fitchlt and Adi, 1994; Bekele, 2007) and further confirmed at Ethiopian National Herbarium using existing specimens and Ethiopian flora books.
Data analysis
Woody plant structural composition of the study area was described based on the analyses of the distribution of individual plants in various DBH and height size classes, and computation of basal area (the actual space covered by the tree and shrub stems), dominance, density, frequency), and Importance Values Index.
To examine tree/shrub DBH size distribution, DBH data were classified into nine size classes as: 1= 2.5-6 cm, 2 = 6.01-12 cm, 3 = 12.01-18 cm, 4 = 18.01-24 cm, 5 = 24.01-30 cm, 6 = 30.01-36 cm, 7 = 36.01-42 cm, 8 = 42.01-46 cm and 9 = >46 cm. Similarly, tree/shrub height data were classified into seven height size classes as: 1 = 1.5-3 m, 2 = 3.01-6 m, 3 = 6.01-9 m, 4 = 9.01-12 m, 5 = 12.01-15 m, 6 = 15.01-18 m, and 7 = 18.01-21 m. The number and percentage of individual tree/shrub stems in each DBH and height size classes were then calculated and graphically illustrated. In addition, the relationship between the number of species and number of individual tree/shrub stems represented in each DBH size class category was examined using Pearson’s correlation coefficient. Similar procedure was used to examine the relationship between the number of species and number of individual tree/shrub stems represented in each height class category. Both analyses were undertaken in SPSS version 20 software (IBM Corporation, 2001).
The following equations were used to analyze the rest of vegetation structural variables.
Frequency (Fi) = (N
Where Fi = frequency of species i; Qi = number of plots in which a species i occurred; and Qt = Total number of quadrates surveyed.
Relative Frequency (RFi) =
Where Fi is frequency of species i; s = total number of species.
Density (Di) =
Where Di = density of species I; Ni = total number of individuals of species i recorded; and A =total area sampled (in ha).
Relative Density (RDi) =
Where, RDi = relative density of species i; s = as defined above.
Basal area, for stems with DBH of > 2.5 cm, (BA in m2) =
Where di = average DBH (in cm) of individual stems of species i.
Dominance (DOi) = (Mean basal area of a species i × Total number of stems of a species i).
Relative dominance (RDOi) = =
Where RDOi = dominance value of a species i; others = as defined above
Importance Value Index (IVIi) = RDi + RFi + RDOi.
Where IVIi = importance value index of species i; others = as defined above.
To assess patterns of regeneration status of woody plants in HWR, sum of number of individuals of seedlings, saplings and matured trees/shrubs counted for each plant species was computed and these values were standardized (that is, converted to density values) to account for the different sample sizes used for counting both seedlings and saplings (which were sampled within five 1 m by 1 m plot) and for matured trees (which were sampled within 20 m by 20 m). Then, the relationship between species’ stem density of seedlings vs saplings, seedlings vs matured, and vs saplings vs matured woody plants were examined using Pearson’s correlation coefficient in SPSS version 20 software (IBM Corporation, 2001).
DBH size class distributions
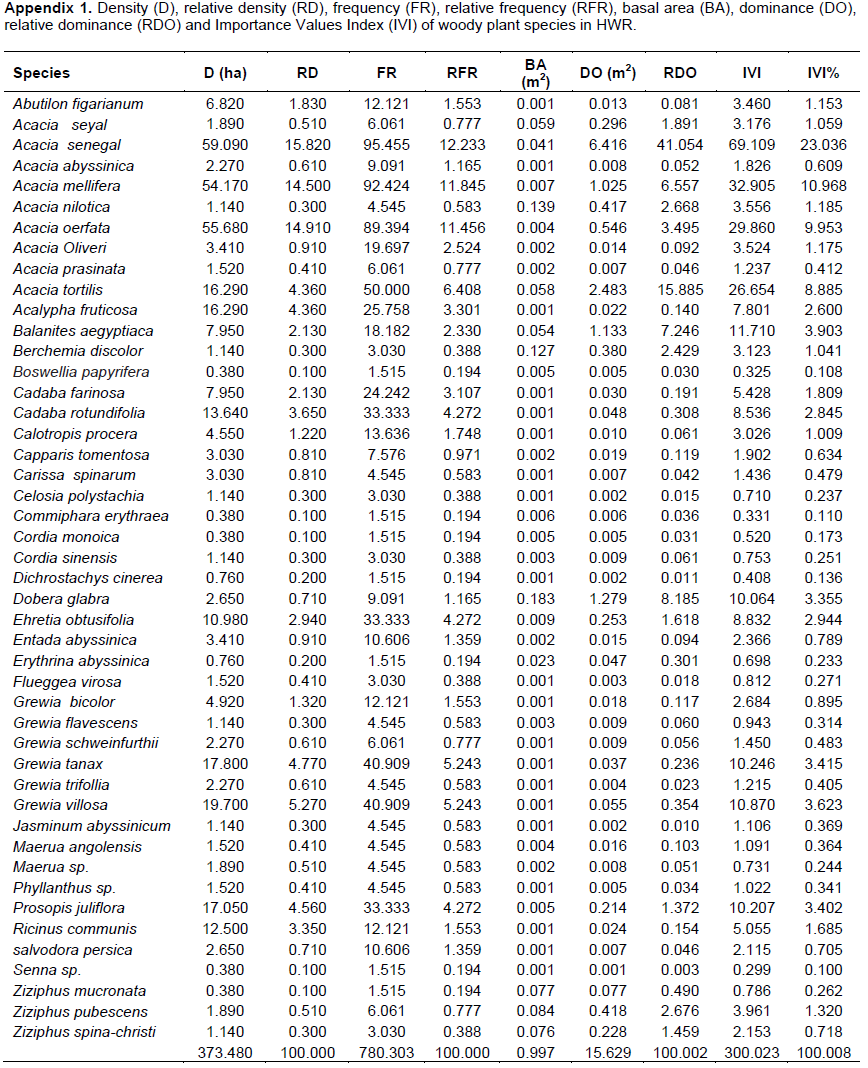
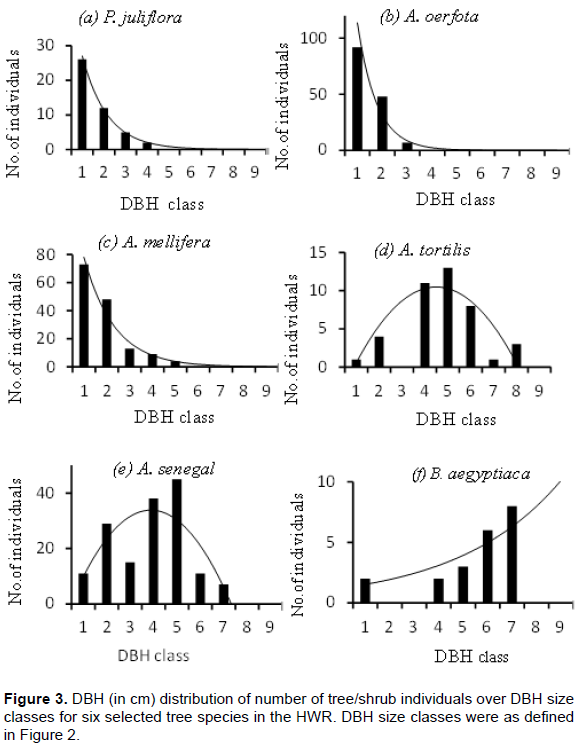
Of the 46 species of woody plants included in this study, the majority of them were represented in the first (37 species, 79%) and second (19 species; 40%) DBH size classes, while only few species were found in the last two size classes (6 species, 13%) (Figure 2a; Appendix 1). Similar trend was found when the number of individual woody plants (stem abundance) represented in each DBH size class was considered, with the largest number of individuals being represented in the first and second DBH size classes and the lowest in the last two classes (Figure 2a). These findings suggested that there was a monotonic declining, with a strong and statistically significant (r = 0.99, n = 9, P <0.001), relationship between the number of species and individual tree/shrub from the first to the last DBH size classes. Only 33 (3.3%) individuals of woody plants belonging to nine species (19% of total species) had DBH values greater than 36 cm (that is, in the last three DBH size classes) (Figure 2a). Among species that attained such over 36 cm DBH size included: Acacia tortilis, Balanites aegyptiaca, Dobera glabra and Ziziphus pubescens. The occurrence of highest number of individual stems in the lower DBH size classes and a gradual decrease towards the higher classes in vegetation of a particular area is often referred to as an ‘inverse J-shape’ curve, which is indicative of good reproduction and recruitment status of that vegetation (Burju et al., 2013; Aliyi et al., 2015).
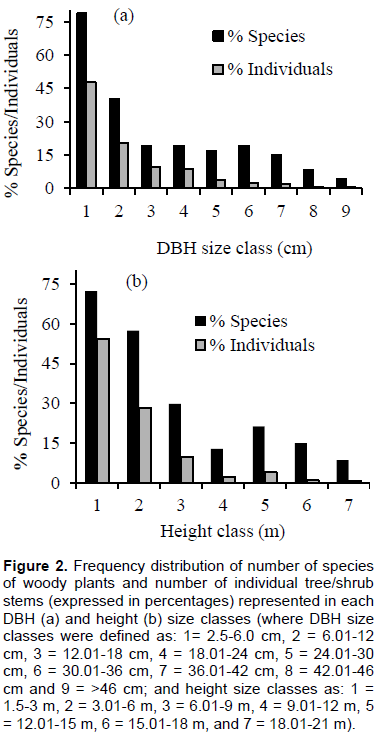
The general pattern of ‘inverted J-shape’ curve seen when all the species was considered together was not detected when species-specific DBH size distributions was examined separately. Three different patterns were revealed based on the analysis of the number of individuals in each DBH size class for six selected species. Three of these species, P. juliflora, Acacia mellifera and Acacia oerfota, showed ‘inverted J-shape’ pattern (Figure 3a-c), having many individuals at the lower diameter classes and decreasing number of individuals at successively higher diameter size classes. Species with such population structural pattern can be considered as in a good reproduction and healthy regeneration condition (Senbeta, 2006). Other species, such as A. tortilis and Acacia senegal showed relatively a ‘bell-shape’, where number of individuals in the middle diameter classes are high but are low in lower and higher diameter classes (Figure 3d-e). These species, therefore, can be considered to be with poor reproduction and recruitment, which could be associated with intense competition from the surrounding trees and/or other forms of disturbances such as browsing activities (Senbeta, 2006; Gebrehiwot and Hundera, 2014). Finally, a ‘J-shape’ pattern was displayed by B. aegyptiaca, with low number of individuals in the lower DBH size classes and high number of individuals in the higher DBH size classes (Figure 3f). Several studies (e.g. Senbeta, 2006; Gebrehiwot and Hundera, 2014; Tilahun et al., 2015) have also reported such declining population of B. aegyptiaca in different parts of Ethiopia. These authors, given that this species is one of the most economically important tree species in the country across all its ranges (Beyene, 2010), have attributed their findings of poor regeneration state of the species to: 1) over-exploitation of matured trees that might have led to reduced reproduction (that is, flower production, pollination and seed production); and, 2) livestock browsing activities (uprooting/removal and cropping of seedlings) that might have probably inhibited seedling/sapling growth and recruitment.
Basal area and dominance
The total basal area of woody plants in HWR was 0.997 m2 per ha (Table 1), which is found to be lower compared with what has been reported from other areas with similar semi-arid savanna vegetation [e.g. in Yangudi Rasa National Park: BA = 3.120 m2/ha, Beyene 2010); in Babile Elephant Sanctuary: BA = 13.9 m2/ha, Belayneh and Demissew (2011); and, in Nechisar National Park: BA = 882.23 m2/ha, Shimelis et al. (2010)]. Nonetheless, woody plant basal area in the HWR was greater than that of other ecologically similar areas such as Taltalle woodland [BA = 0.44 m2/ha; Lemessa (2009)]; Awash National Park [BA = 0.822 m2/ha; Yohannes et al. (2013)]; and, Dalfaqar National Park [BA = 0.84 m2/ha; Mekonnen (2006)].
Basal area provides a better measure of the relative importance of the species than simple stem count (Alemu, 2011; Aliyi et al., 2015). Thus, species with the largest contribution to the total basal area in a given ecosystem/habitat can be considered as the most important species in that habitat. Otherwise, in most cases shrubs could be the dominant species, if only we consider density as a measure to indicate the overall dominance of the species. In this study, D. glabra had the highest basal area 0.1828 m2/ha (14%), followed by Acacia nilotica 0.1390 m2/ha (13%), Berchemia discolor 0.0837 m2/ha (9%) and Ziziphus spinachristi 0.0836 m2/ha (9%) (Appendix 1). However, basal area of most species (~93% of woody plant species) recorded in the area was found to lie in the ranges between 0.0005-0.0500 m2/ha, may be indicating that most of these species display, as is true for may savanna ecosystems, small growth habit due to the constrains posed on them by ecological factors (moisture deficit and high temperature) and/or anthropogenic disturbances (e.g. livestock browsing and human exploitation for house construction and charcoal making) (Lemessa, 2009).
The top six dominant woody plant species in HWR were A. senegal, A. tortilis, B. aegyptiaca, A. mellifera, D. glabra and A. oerfota, collectively accounting for 82% of the total dominance value of woody plant species in the reserve (Table 1). According to Mueller-Dombois and Ellenberg (1974), such dominant species can be seen as the most ecologically significant, and the most successful species in regeneration, pathogen resistance and/or the least preferred by animals.
Height size class distribution
Overall, both the number of species and of individual woody plants represented in each height size class showed decreasing trends with increasing height size classes (that is, an ‘inverted J-shape’ pattern) (Figure 2b), with strong positive correlation between the number of species and of individual woody plants represented in each height size class (r = 0.974, n = 7, P <0.001). The majority of individuals contributing to the first and the second height size classes came from A. mellifera, A. senegal, A. oerfota, Grewia villosa, Grewia bicolor, Capparis tomentosa, Cadaba rotundifolia and Grewia tanax (Data not shown). Only 16 individuals (~2%) of the woody plant individuals from four species (z. pubescens, A. tortilis, Acacia seyal and Acacia abyssinica) attained height sizes of greater than 15 m (that is, represented in the last two het classes). The decreasing trend in number of individuals represented as one moves from lower to higher height size classes (that is, inverted J-shape’ curve) indicates the dominance of small-sized individuals, which could be a characteristic of high rate of regeneration and/or high rate of mortality in large-sized individuals. Such type of population structure is referred to as stable size distribution which is common in many natural forests (Gemechu, 2014). Vegetation vertical structure (height) can be used as an indicator of age distribution of vegetation of a particular site and its importance as a wildlife habitat; the more structurally complex a habitat is, the more diversity of animal species it harbors (Newton, 2007). However, height size class distribution of dry land vegetation is not good indicator of the vegetation regeneration, reproduction and recruitment status because most plant species found in such areas are usually dwarf due to environmental and genetic factors or browsing activities (Newton, 2007).
Density and frequency of woody plants
The total density of woody plants (DBH > 2.5 cm) in HWR was 374 individuals per ha and density among species ranged between 0.5-67.4, with most species (~45%) having density values of >50 individuals per ha (Appendix 1). Species contributing most to the total plant population density of the area were A. senegal (67 individuals /ha, or 19%), followed by A. mellifera (60 /ha, 179%) and A. oerfota (60, 17%) (Appendix 1). Comparing the total density of woody plants reported here with other similar savanna ecosystem sites in Ethiopia indicated that it was comparable to that of Dilfaqar National Park (Mekonenn, 2006) and Taltalle woodland (Lemessa, 2009), but was greater than that of Nechisar National Park (Shimelse et al., 2010), Yangudi Rasa National Park (Beyene, 2010), and Awash National Park (Yohannes et al., 2013).
Analysis of species-specific frequency of occurrence across the sampling plots showed that three species (A. Senegal, A. mellifera and A. oerfata) appeared to be disproportionately the most frequent; occurring in more than 90% of the plots, they together contributed over one-third (36%) of the cumulative relative frequency of the entire species. However, most species (20 species or 44%) occurred only in less than four plots (Appendix 1).
Importance Value Index (IVI)
Importance Value Index (IVI) is a good measure for summarizing vegetation characteristics of a given habitat and is useful to compare the ecological significance of species and for conservation practices (Bekele et al., 2014; Gedefaw and Soromessa, 2014; Tilahun et al., 2014). It reflects the degree of dominance and abundance of a given species, and thus its ecological importance, relative to the other co-occurring species in the community (Kent and Cooker, 1992). In the present study, IVI of species varied from 0.3 (0.1% of the total IVI) to 69.1 (23.4%) and only five species contributed over 60% of the IVIs: A. Senegal (23%), A. mellifera (11%), A. oerfota (10%), A. tortilis (9%), B. aegyptiaca (4%) and G. villosa (4%) (Appendix 1). Over half of the all species [25 (54%) species] had IVI of greater than 1, while species relatively considered to be the most rarest in the HWR included Senna sp. 0.30 (0.10%), Boswellia papyrifera 0.33 (0.11%), Commiphara erythraea 0.34 (0.11%), Dichrostachys cinerea 0.41 (0.14%), Erythrina abyssinica 0.70 (0.23%) and Cordia sinensis (0.76 (0.25) (Appendix 1).
Regeneration status
Assessment of regeneration status of plant communities has a paramount importance for sustainable conservation and management (Khumbongmayum et al., 2006). The average density of seedlings, saplings and matured woody plants in the HWR were 1344.70, 899.24 and 373.5 per ha, respectively (Figure 4a). According to Khumbongmayum et al. (2006), when the number of seedlings of woody plants is greater than saplings and of sapling is greater than mature trees/ shrubs, as was the case in the present study, it indicates that the vegetation has a good regeneration status. However, when species-specific contributions to the overall regeneration of woody plants of the study area was considered, some species such as A. oerfota, Acalypha fruticosa, A. mellifera, A. senegal and P. juliflora had the highest seedling density in the reserve, whilst other species such as Flueggea virosa, B. aegyptiaca, Z. spinachristi and Berchemia discolor were characterized by the lowest densities of seedlings (Table 1). Furthermore, three species (Boswellia papyrifera, Cordia simensis and Grewia flavescens) had no individuals at both seedling and sapling stages and seven more species (15%) had no seedlings (Table 1). Species characterized by such lack of individuals at seedling stage are considered as not regenerating and are most vulnerable to local extinction (Khumbongmayum et al., 2006). Nonetheless, there was strong positive correlation between stem density of seedlings and saplings (r = 0.93, n = 46), but very weak relationships between each of them and density of matured plants (Matured vs seedling, r = 0.09; matured vs saplings, r = 0.12), indicating that species with abundant seedlings were also represented abundantly by saplings, but are not necessarily represented by matured individuals.
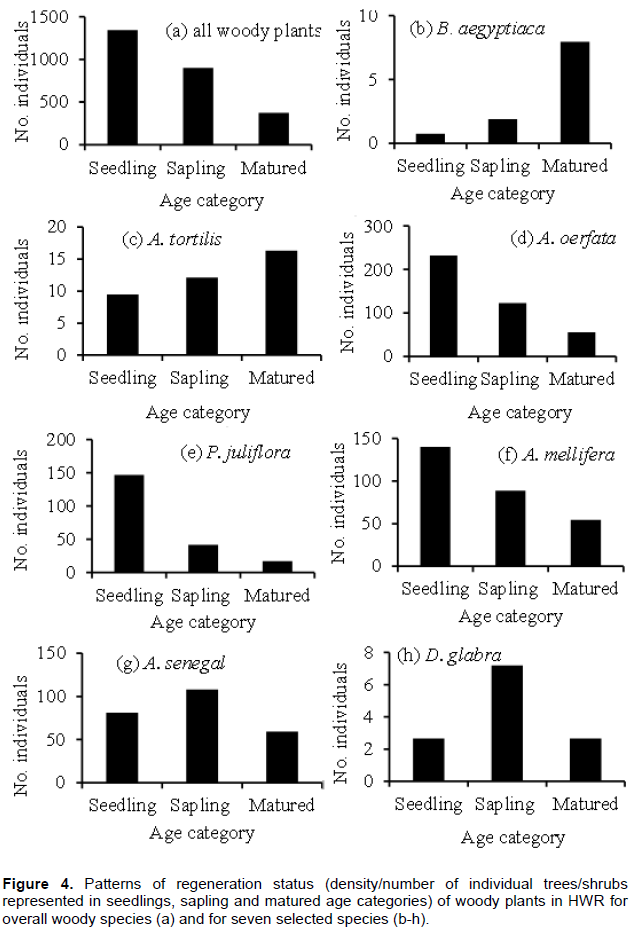
Detailed examination of the regeneration status of seven selected species (based on their dominancy, ecological and economic importance) revealed three general patterns of regeneration (Figure 4 b-h). The first distribution pattern was characterized by lowest density of seedling, medium density of sapling and highest density of matured individuals, a pattern often referred to as ‘J-shape’ curve and was displayed by B. aegyptiaca and A. tortilis (Figure 4b and c). These findings contrast with results from other studies (Mekonnen, 2006; Mekonnen et al., 2009; Belayneh and Demissew, 2011) that both A. tortilis and B. aegyptiaca have reported to show ‘U-shape’ regeneration curve, and A. tortilis exhibited an inverse ‘J-shape’ curve (Beyene, 2010). These tree species are more palatable to livestock and have more economical importance for the local people (for house construction, charcoal and firewood) compared with other woody plant species in the HWR. Thus, the discrepancy among previous studies and the present study could be due to varying nature and levels of biotic pressures (tree cutting and browsing) posed on the different age sizes of these species at different sites. In HWR, it seems that selective removal of pole-sized (saplings) individuals by people and livestock browsing of seedlings or samplings might have led the population structures of these species to exhibit such poor regeneration and/or abnormal recruitment. From conservation point of view, these two species are at higher risk of local extinction and hence should be prioritized for conservation management actions.
The second distribution pattern was that highest number of seedlings than saplings and decreasing number of individuals successively at saplings and matured stages (that is, inverted ‘J-shape’ curves, indicating good regeneration status (Khumbongmayum et al., 2006). Species that exhibited this pattern of regeneration status were A. oerfota, P. juliflora and A. mellifera (Figure 4d-f). The finding that these three species are at good regeneration state is unsurprising given that they, particularly the exotic invasive P. juliflora, have been reported to be expanding in the region in expense of the other natural vegetation (Tadesse, 2009). The third group of species, A. senegal and D. glabra, displayed a ‘bell-shaped’ distribution pattern where the highest population was represented in sapling stage class and medium in seedling and matured age classes (Figure 4g and h), which is an indication of a poor regeneration and recruitment status (Senbeta, 2006; Tilahun et al., 2015). There are a number of factors that could potentially contribute to such type of regeneration pattern; for example, seed predation, seedling browse, canopy cover for seedling recruitment, nature of seeds dormancy breakage in relation to environmental factors and pathogen attacks could affect the germination and growth of seedlings (Mekonnen et al., 2009; Kebede et al., 2014).