ABSTRACT
The present study was conducted for the conservation and management of vegetation in a socio-ecological mountain landscape through assessment of floristic composition, community types and structure of woody species in the Wabe River catchment of the Gurage Mountains in Ethiopia. The preferential sampling technique was applied to collect floristic and vegetation structure data, and within each plot, woody species diameter at breast height (DBH) was measured. R statistical software was used to analyze the vegetation cluster, diversity and structure. As a result of the heterogeneous nature of the catchment vegetation, the optimum number of six clusters (community types) were identified which were named through high ranked species. The majority of the community types had high diversity indexes and equitability or evenness. Most of the species had lower DBH classes and frequency. Besides, the important value index (IVI) for most of the species showed high value. This information facilitated for sustaining the biodiversity through identification of high plant diversity spot community types to be protected, degraded vegetation areas to be rehabilitated and fragmented vegetation areas to establish ecological connectivity. Further studies on the ecosystem services provided by the vegetation could be important for understanding their value and to advance the planning and management mechanisms.
Key words: Community type, floristic composition, diversity, equitability, structure, important value index (IVI), landscape planning.
Biodiversity plays a significant role in the ecosystem delivery (Mace et al., 2012), either to ensure ecological processes (for example soil fertility) or to provide provisioning services (for example food and water), regulating services (for example climate regulation, erosion mitigation and water purification) and cultural services (for example aesthetic appreciation and recreation). It is fundamental to universal ecosystem functions such as the absorption and transfer of energy and the uptake and loss of carbon dioxide, water, and nutrients (MA, 2005) which, in turn, deliver ecosystem services. Experimental manipulation of biodiversity and ecosystem functioning has shown a consistently positive effect on diversity in the generation of ecosystem services for a range of organisms, habitats and services (Balvanera et al., 2006; Quijas et al., 2010). Biodiversity has an apparent relationship with ecosystem functions, and measures that protect or enhance biodiversity may also be beneficial to the provision of ecosystem services. Biodiversity loss in turn reduces the efficiency by which ecological communities capture biologically essential resources, produce biomass, decompose and recycle biologically essential nutrients (Cardinale et al., 2012). For services like carbon sequestration, specific key species such as leguminous tree species in grasslands and long-lived trees in forests are important (Harrison et al., 2014).
Habitat and species protection improves the chance of sustaining a diverse flora and fauna that, in turn, provides the benefits of biodiversity (Dobson et al., 2006). Ethiopia is endowed with diverse landscape features and climate, resulting in both floral and faunal diversity and making the country an important centre of diversity and endemism (Woldu, 1999). The number of higher plants is composed of more than 6,500 species, of which about 10.5-12% are probably endemic (CBD, 2009). However, Ethiopia’s natural vegetation is under considerable pressure due to the rapidly increasing population, expanding agricultural activities and increasing deforestation (Eshetu, 2014). In the past, most of Ethiopia’s highlands were believed to have been covered with dense forests. The existence of numerous isolated mature forest trees of approximately the same species composition in the remaining areas of closed forest and in many churchyards, they evidently indicate that the extent to which the highlands of Ethiopia were once forested (Friis and Demissew, 2001). In 1930s, about 20% of the land in the Gurage zone, was covered with natural forests. The forest covers successively decreased and reached their peak during the years 1991 and 1992.
This could be due to the political system changes in the country. In parallel, since at the beginning early 1960s the inhabitants started to grow eucalyptus on an increasing scale, which increased the amount of land being covered with trees (Bekalu and Feleke, 1996; Zerga, 2016). According to the land use land cover classification of the Gurage zone (EMA, 2011), 18.4% of the area was covered by different types of vegetation (for example Afro-alpine vegetation, shrub land, woodland, eucalyptus plantation and forest with forest covering only 3.8%. Wabe River catchment in the Gurage zone had relatively higher coverage of total vegetation (24%) and forestland (7.6%). Although the Wabe River catchment covers 8.9% of the Gurage zone, it contains 42% of the vegetation coverage of the zone. The Governments of Ethiopia tried to implement different interventions to rehabilitate the degraded areas and to maintain the remaining forests (Eshetu, 2014). In similar way, forest protection and watershed management activities were implemented in the Gurage Mountains. However, lack of information on plant diversity has hindered the identification of biodiversity hotspots and intervention areas, which require special attention for conservation and management.
Botanical assessments of different vegetation such as floristic composition, species diversity and structural analysis studies are essential for understanding forest ecology and ecosystem functions, and forest management purpose (Giriraj et al., 2008; Pappoe et al., 2010). Knowledge of floristic composition and structure of forest is also useful for conservation by identifying ecologically and economically important plants and their diversities, protecting threatened and economically important plant species (Addo-Fordjour et al., 2009). For proper planning and management of biodiversity, and ecosystem services provided in the Wabe River catchment, the information on plant diversity is required. Thus, the aim of this study was to assess the floristic composition, diversity and structure of woody species and use this information for conservation and management of biodiversity and ecosystem services in the Wabe River catchment of the Gurage Mountains in South Central parts of Ethiopia.
Study area
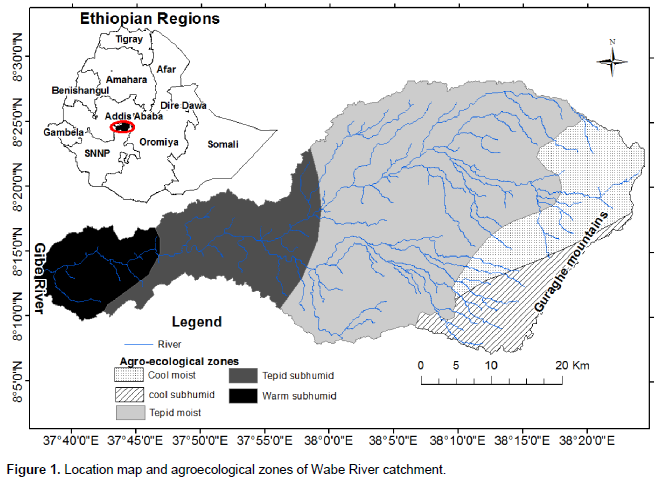
The Gurage Mountains extend from the Awash River Basin in the north to the Hadiya zone in the south, partitioning the Gurage Zone in half. The mountains form a watershed boundary between the Omo–Gibe River Basin in the west and the Great East African Rift Valley in the east. Wabe River catchment is a sub-catchment of the Omo–Gibe. The catchment is located between 08° 21′ 30′′ and 08°30′ 00′′ N and 38° 05′ 40′′ and 37° 49′ 00′′ E. The Gurage Mountains, with altitudes of 3,611 m above sea level, make up the highest area in the catchment and the lowest altitude of 1,014 m is found in the Western Gibe River (Figure 1). The catchment covers a drainage area of about 1,860 km2. The five-agroecological zones existing in the catchment are the cool moist mid-highlands, the cool subhumid mid-highlands, the tepid moist mid-highlands, the tepid subhumid mid-highlands, and the warm subhumid lowlands (MOA, 2000). The Wabe River catchment’s maximum temperature ranged from 20°C (in the wet season) to 39°C (in the dry season), while the minimum temperature is in the range 0 to 19°C. The average temperature is 18°C. The mean annual rainfall ranges from 1,200 to 1,320 mm (NMA, 2016). The pellic vertisols are the dominant soil type according to the FAO soil classification. Land use within the Wabe River catchment is primarily oriented to Enset based subsistence agriculture, though there have been reported increases in the plantation of eucalyptus trees and Khat (Catha edulis), and cultivation of cereals (Woldetsadik, 2004). Enset crop plants are the main food source in the Gurage Mountains area.
Vegetation data collection
As a result of large area coverage and habitat heterogeneity, the preferential sampling technique was used to collect floristic and vegetation structure data in the Wabe River catchment. Google Earth and SPOT imageries were used to identify the clear distinction between vegetation and habitat heterogeneity before vegetation sampling. Then at every 100 m altitude difference, the vegetation data were collected along the rivers and in forest patches using 20 × 20 m sample plots. In total, 90 sample plots were examined. Within each plot all woody species with DBH (1.3 m above ground) > 5 cm were measured for their DBH and height. Voucher specimens were collected for identification at the National Herbarium of Addis Ababa University using the Floras of Ethiopia and Eritrea.
Vegetation data analysis
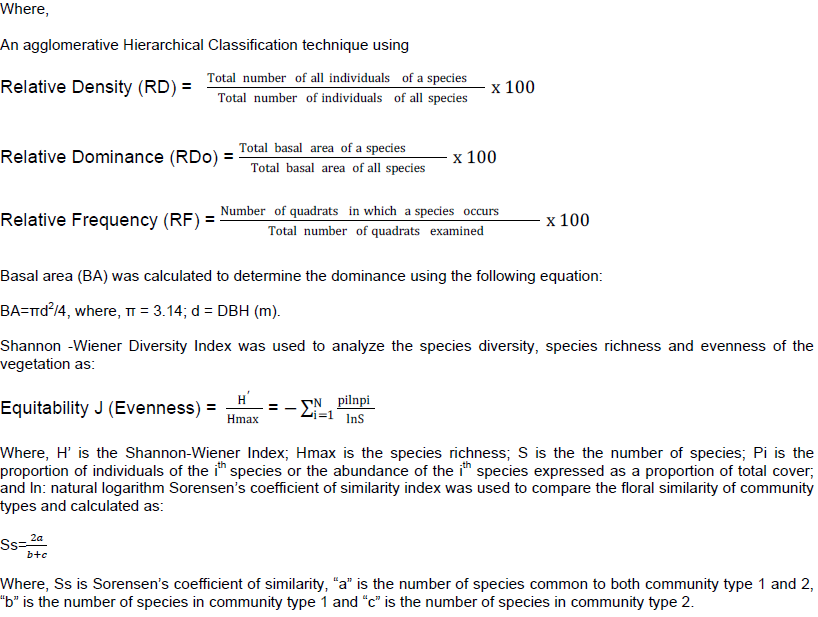
Euclidean distance and Ward’s method was used for clustering the vegetation data using R statistical software (Woldu, 2012). Through careful inspection of the dendrogram using K- value, the optimum number of clusters was identified. The K- value was also confirmed for consistency using the partitioning method that was obtained by plotting the sum of squares within the groups versus the number of clusters and observing where there is a sharp break in the graph. The value on the x-axis where there is a sharp break in the graph represents the optimal number of clusters in the dendrogram. The clusters were considered as "plant community types" and named using two characteristic species having the highest mean abundance values of their community type. The synoptic table of species analyzed using R software was used to obtain information about each cluster’s highest cover abundance. The vegetation structure was described using frequency distribution of density, DBH, basal area, frequency and Importance Value Index (IVI). IVI was computed for all woody species based on relative density (RD), relative dominance (RDo) and relative frequency (RF) to determine their dominant position. Importance value index (IVI) = Relative density + relative dominance + relative frequency
Where,
An agglomerative Hierarchical Classification technique using
Floristic composition
Eighty-eight species belonging to 71 genera and 48 families were recorded from the study area. About 45% of the families recorded from the area were represented by two and more species, while about 54% of the families were represented by only a single species. Fabaceae was the most dominant family and represented by 12 species. The families Myrtaceae and Oleaceae were the next dominant and had four species each. The families Anacardiaceae, Combretaceae, Ebenaceae, Euphorbiaceae, Moraceae, and Salicaceae have three species each. From the investigated vegetation, 25% of the families had two species each. The remaining 26 families that contributed 54% of the total species were represented by one species each. Out of the 3,632 total woody plant individuals which have DBH > 5 cm recorded from the study area, the trees represented 78.5% whereas shrubs were 21.5%.
Vegetation classification
Plant community types
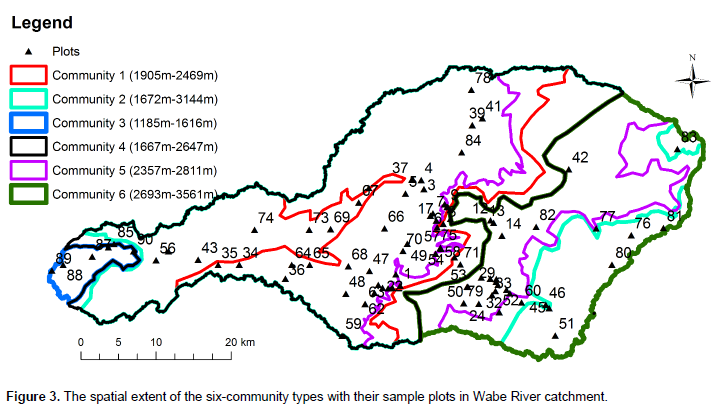
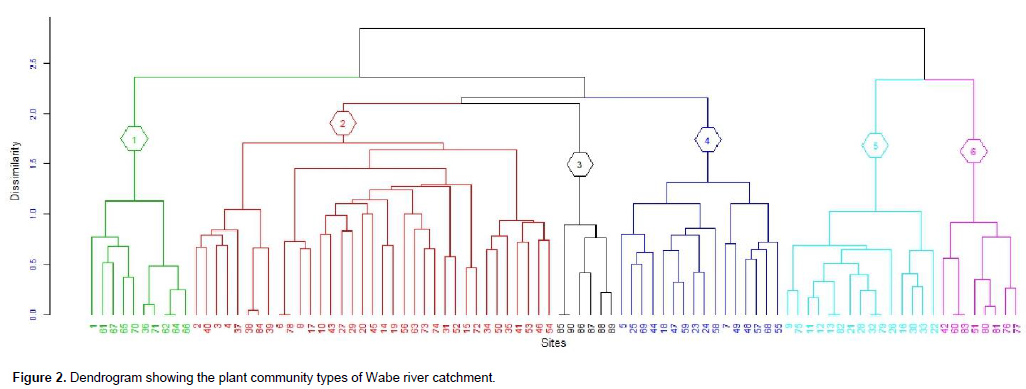
Cluster analysis resulted in grouping of 90 sample plots into six clusters (Figure 2). The resulting clusters were then considered as "plant community types" and named after two characteristic species. These are Euclea divinorum- Scolopia theifolia (Community type 1), Juniperous procera- Olea europaea subsp cuspidata (Community type 2), Combretum collinum- Grewia villosa (Community type 3), Podocarpus falcatus- Euclea racemose (Community type 4), Eucalyptus grandis- Croton macrostachyus (Community type 5) and Erica arborea-Lobelia rynchopetalum (Community type 6). The community type 1 was dominated by E. divinorum and S. theifolia species. It was represented by 10 plots and comprised 28 species. Species like J. procera, Schrebera alata, Rhus vulgaris, Olea europaea subsp. cuspidata, Bersama abyssinica and Prunus africana were the other most dominant species in the community type. Large numbers of the investigated plots (35) were under community type 2 wherein 58 woody species were recorded. J. sprocera- O. europaea subsp. cuspidata community type was found in ranges of 1,500 m altitude difference from warm (1672 m) to cool (3144 m) climatic conditions (Figure 3). In addition to J. procera and O. europaea subsp. cuspidata, there are also other dominant species in this community type such as Podocarpus falcatus, Euclea racemose, Olinia rochetiana, Carissia spinarum, Prunus africana, Euclea divinorum, Dodonaea viscosa and Ficus elastica.

The dominant species in the community type 3 were Combretum collinum, Grewia villosa, Combretum molle, Cambretum aculeatum, Lonchocarpus laxiflorus, Lannea fruticose, Acacia polyacantha and Celtis africana. In total, 25 woody species were recorded from this community type. Podocarpus falcatus - Euclea racemose community type (4) was found at altitudes ranging between 1,667 and 2,647 m in the catchment (Figure 3). This community type composed of 29 species. Podocarpus falcatus, Euclea racemose, Juniperous procera, Syzygium guineense and Jasminum abyssinicum were the dominant species in this community. This community type respectively shared 13, 18, 10 and 9 species with community types 1, 2, 5 and 6. Community type 5 dominant species were Eucalyptus grandis and Croton macrostachyus. In addition, J. procera and P. falcatus were the other dominant species in this community type. This community type contains 25 species recorded from 16 sample plots. The endemic species of Ethiopia- Millettia ferruginea was also found in this community type.The last community type is found at the top mountain areas of the catchment. The Afro-alpine species Erica arborea and Lobelia rynchopetalum were the dominant species in this community. Species like J. procera, C. macrostachyus and Eucalyptus globulus were the other dominant species recorded. Twenty-two woody species were recorded from eight sample plots.
Diversity of woody species in the plant community types
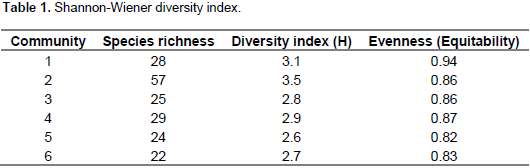
Shannon-Wiener diversity index analysis of the six plant community types shows that community 2 had the highest diversity followed by community 1 while community 5 showed the least diversity (Table 1). Community type 2 had the highest species richness, whereas the last species rich community was community type 6. However, evenness (equitability) which measures the relative abundance of different species present in each community showed relatively the highest value in community 1 followed by community 4 and the lowest was in community 5.
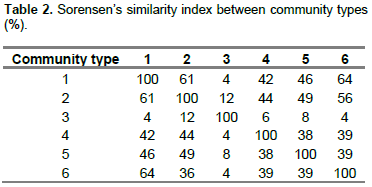
Similarity between plant community types
Based on Sorensen’s Coefficient Index (Table 2), the highest similarity was observed between communities 1 and 6 while less similarity was observed between communities 1 and 3, and 3 and 6. The result from the analysis showed community 1 and 6, community 2 and 1, and community 2 and 6 shared about 64, 61 and 56% similarity in species composition, respectively. Community type 1 shared 26, 12, 10 and 16 species with community 1, 4, 5 and 6, respectively. Community type 3 shared five species with community type 2, one species with community type 4 and 6, and two species with community type 5. Twenty species of community type 5 were similar to community 2. Nevertheless, only two of the species were similar to community type 3. Community type 5 shared 12, nine and eight woody species with community types 1, 4 and 6, respectively. The community type 6 shared 16 woody species with community type 1, 10 species with community type 4 and nine species with community type 5.

Structural analysis of woody species
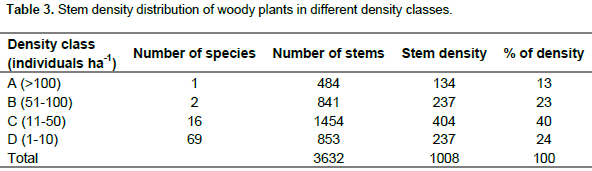
Density
The total stem density of woody species with DBH ≥ 5cm was 1,008 individuals ha-1 (Table 3). From this, 40% of the total density was contributed by 16 species from the density class C. Species which had a higher stem density relative to other species in the Wabe River catchment are J. procera, E. grandis, Erica arborea, P. falcatus, Ficus elastica and Combretum collinum. Of these species, J. procera had a density above 100 densities per ha and contributed to 13% of the total density. Although 69 woody species belonged to density class D, and contributed to only 24% of the total density.
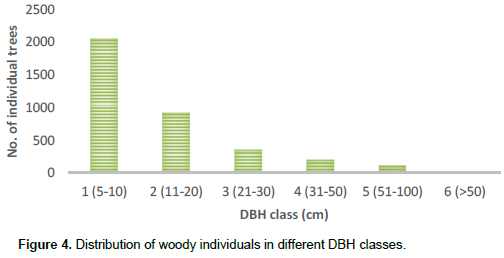
DBH class distribution
Most of the stems (56%) had the highest number of individuals in the lowest DBH class and the number of individuals progressively decreased with increasing diameter class (Figure 4).

Frequency
About 84% of the total woody species was distributed in the lowest frequency class, whereas 13% of the individuals was distributed in the second frequency class. With a frequency of 43%, J. procera is the most frequent species followed by P. falcatus (28%) and O. europaea subsp. cuspidata is the third most frequent species (23%).
Basal area
The total basal area of the vegetation under study area was 118 m2ha-1 for woody species > 5 cm in DBH. About 47% of basal area was contributed by individuals with a diameter above 50 cm and the lowest by individuals with a diameter below 10 cm.
Importance Value Index (IVI)
From the total 88 woody species, 56 species had IVI greater than 5:00. These species are considered dominant because they have higher relative density, relative frequency and relative abundance in comparison with other species in the catchment. J. procera, P. falcatus and E. grandis with IVI of 206, 114 and 107 respectively were the top three species with the highest IVI values in the Wabe River catchment while Allophylus abyssinicus, Rhamnus staddo, Oncoba spinosa, Myrica salicifolia, Spathodea campanulata, Acacia abyssinica, Dovyalis abyssinica, Premna schimperi, Pilliostigma thonningii and Arundinaria alpina had the lowest IVI value.
Floristic composition
The result of floristic study revealed that Wabe River catchment is very rich in woody plant species diversity. The family Fabaceae, which is dominant in the catchment, was one of the most reported families in the floristic region (Yineger et al., 2008; Alemu, 2011; Dibaba, 2014). The dominance of the family Fabaceae in the study area is also in contour with the assessment results in the Flora of Ethiopia and Eritrea. Fabaceae might have got the dominance position probably due to efficient pollination and successful seed dispersal mechanisms that might have adapted themselves to a wide range of ecological conditions in the past (Kelbessa and Soromessa, 2008). The low number of endemic species in our study areas is because of our focus on woody species with DBH >5 cm, while most of the endemic species of Ethiopia were shrubs and herbs (Hedberg et al., 2006; Tadesse, 2004) with smaller diameter.
Vegetation classification
The six plant community types recognized in our study area is higher than the number of plant community types identified from other vegetation studies in Ethiopia (Alemu et al., 2011; Erenso et al., 2014; Atsbeha, 2015; Kassa et al., 2016). This could be due to the fact that the study area is found in warm, humid, moist and cool agro-ecological zones supporting different vegetation types. In addition, the catchments have a difference in altitude, aspect, soil, human impacts and grazing intensity that can limit the ecological distribution of plant species that might have attributed to variation (Bekele, 1993; Kassa et al., 2016). The Shannon-Weiner diversity index, normally varies between 1.5 and 3.5 and rarely exceeds 4.5 (Šmilaue, 2001). In the present study, the overall diversity ranges between the lowest 2.6 (in community type 5) and the highest 3.5 (in community type 2) shows that there is a high diversity. There is more or less even representation of individuals of most woody species in the sampled quadrats. High and low species evenness can be attributed to environmental disturbances, variable conditions for regeneration and selective exploitation of some species (Kidane, 2003).
Except community type 5, the other community types in this study had almost the same species diversity (equitability or evenness) with high species evenness. The community type 5 in the upper catchment has a relatively low evenness and it needs much attention. The similarity between community types in the Wabe River catchment is believed to depend on altitude. The community types with higher similarity were found to overlap in their altitudinal distribution (Figure 3). There was no altitudinal overlap seen by community types with least similarity. In addition to altitudinal gradient, other environmental factors of the catchment such as aspect, slope, and soil physical and chemical properties could have considerable effects on patterns of vegetation in communities and make the other communities to have good similarity (Derje, 2007). The existence of low similarities between communities indicates that the communities are important in terms of floristic diversity and needs attention from a conservation point of view (Fekadu et al., 2014).
Vegetation structure
Most of the measured stems (56%) existed in the lower DBH class, showing that shrubs and small trees represent the largest portion of the vegetation. The existence of the number of individuals in the lower DBH class was similar to studies in Wof-Washa and Chilimo (Bekele, 1993), Bibita (Derje, 2007), and Magada (Tura and Reddy, 2015) forests of Ethiopia. As the DBH class increased, the density decreased, which means that the vegetation has a small quantity of big trees in the higher DBH classes. The highest proportion of stem density was contributed by a few individuals of woody species that have greater density class. This pattern indicates that Wabe River catchment vegetation has a good natural reproduction and recruitment potential. The highest number (84%) of the total species was distributed in the lowest frequency class and a few species were distributed in the highest frequency class. This indicates that most of the species were recorded from few plots. The few woody species with highest frequency value are those recorded from most sample plots and are well distributed in the vegetation of the study area. According to Kidane et al. (2003), this situation indicates the dominating position of the species in the vegetation. The most frequently found species in the catchment such as J. procera, P. falcatus and O. europaea had good distribution status.
Basal area provides a better measure of the relative importance of the species (Bekele, 1994). The high basal area of this study area (118 m2ha-1) shows that the catchment vegetation had a higher basal area compared to similar studies in Ethiopia; 68.52 m2ha-1 by Bekele (1993) and 81.9 m2ha-1 by Yeshitela and Bekele (2003). Thus, most of the species found in the catchment are important. The result indicates that the majority of the woody species had IVI greater than 5.00 even though high IVI was attributed to fewer species. These species are those which are well adapted to the high pressure of disturbance, natural and environmental factors, and the effects from local communities. This indicates that most of the species were very important for providing ecological services in the catchment (Fekadu et al., 2014). As those with the greatest importance value are dominant in specified vegetation (Shibru and Balcha, 2004) and might also be the most successful species in regeneration (Kenea, 2008).
Implications for conservation and management of Afromontane vegetation
Protect current patterns of plant diversity
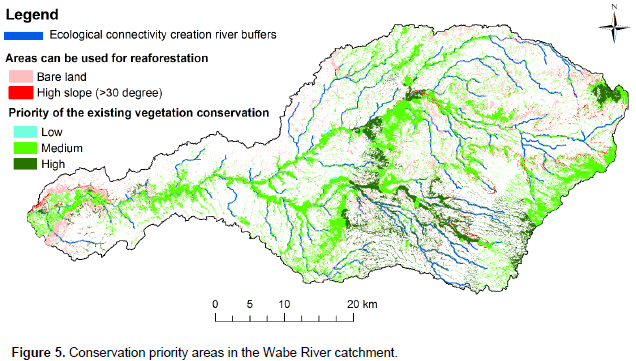
Conservation management is required to protect species where they are today. Without protection, species, especially those that are rare and threatened, will have little chance of persisting until other adaptive approaches are possible or effective (Schmitz et al., 2015). Even though conservation is needed in all parts of the vegetation landscape in this study area, priority is needed for the areas that have high species diversity, found in high altitude areas, low similarity between community types and low species evenness between community types (Figure 5). Thus, community types 3 and 6 are due to low similarity; community type 2 is due to high diversity; and community type 5 due to low evenness should have been given more attention for conservation. High altitudes are given a high priority due to the conservation of the upper catchment that provides a number of benefits to lower catchment, especially regulating the ecosystem services of water, soil erosion and nutrient retention.
Identifying and protecting requiring rehabilitation
The Wabe River catchment has large areas with a high slope due to undulating topography and the bare lands are mostly degraded (Figure 5). Thus, landscape planners and decision makers of the area can use the bare land and high slope areas for rehabilitation to increase biodiversity and ecosystem services.
Maintain and establish ecological connectivity
Even if we succeed in conserving today’s portfolio of large natural and semi-natural landscapes and habitat connecting corridors, species will shift their range within these landscapes due to different factors. Connecting areas with corridors, stepping stones, or working lands creates landscape permeability for plant and animal movement (Schmitz et al., 2015). The connected areas sustain gene flow among species populations that can prevent local extinctions (demographic rescue), and facilitate re-colonization after local extinction. Most of the Wabe River catchment vegetation is found along rivers and is thus connected by river buffers. However, some patches of forests remain unconnected. Taking the advantages of the river networks in the catchment, the patches of forests can be reconnected through river buffer afforestation and reforestation using the information on the floristic composition of this study (Figure 5).
Plant diversity study in Wabe River catchment shows that the catchment has a diversified woody species. Since the vegetation is found in various agro-ecological zones of the catchment, the cluster analysis resulted in six community types (clusters). Most of the community types have a good diversity index and equitability or evenness showing that they are under good protection. But, the community types found in the upper catchment have relatively low equitability showing that they are under pressure. While some of the community types have high similarity, those found in the lower and upper catchments were isolated and have no similarity contributing to the diversity of species in the catchment. Therefore, these vegetation types require special conservation attention. Even though the catchment species have a variety of IVI, most of the species have good indexes showing that they are important for ecological services. Thus, proper conservation of the variety of species available in the catchment to maintain and enhance the existing ecosystem services is needed. Assessing plant diversity in this way improves our understanding of vegetation status in a given area. Our approach helps land use planners, local policy and decision makers to enhance vegetation conservation mechanisms and thereby ecosystem services. Such study could also greatly contribute to developing conservation strategies at different scales and embed them in their respective vegetation in the social-ecological environment. Studies on the quantification and mapping of ecosystem services provided by the vegetation would be recommendable to enhance the planning and conservation approach.
Authors appreciate the Financial and logistic supports provided by Wolkite and Addis Ababa Universities. The partial financial support provided by The International Foundation for Science (IFS) with Grant number D/5915-1 is also acknowledged.
The authors have not declared any conflict of interests.
REFERENCES
|
Addo-Fordjour P, Obeng S, Anning A, Addo M (2009). Floristic composition, structure and natural regeneration in a moist semi deciduous forest following anthropogenic disturbances and plant invasion. Int. J. Biodvers. Conserv. 1(2):021-037.
|
|
|
|
Alemu S, Argaw M, Kelebisa E (2011). Woody species composition, diversity and structural analysis of Angada Forest in MertiWereda, Arsi Zone of Oromia Region, Ethiopia. Thesis, Addis Ababa University, Ethiopia.
|
|
|
|
|
Balvanera P, Pfisterer, AB, Buchmann N, He JS, Nakashizuka T, Raffaelli D, Schmid B (2006). Quantifying the evidence for biodiversity effects on ecosystem functioning and services. Ecol. Lett. 9(10):1146-1156.
Crossref
|
|
|
|
|
Bekalu M, Feleke D (1996). Ethiopian Village Studies: Imdibir Haya Gasha, Gurage. Addis Ababa University and Oxford University, Addis Ababa and Oxford.
|
|
|
|
|
Bekele T (1993). Vegetation ecology of Afromontane forests on the central plateau of Shewa, Ethiopia. Acta Phytogeogr Suec 79:1-59.
|
|
|
|
|
Bekele T (1994). Phytosociology and ecology of a humid Afromontane forest on the central plateau of Ethiopia. J. Veg. Sci. 5(1):87-98.
Crossref
|
|
|
|
|
Cardinale BJ, Duffy JE, Gonzalez A, Hooper DU, Perrings C, Venail P, Narwani A, Mace GM, Tilman D, Wardle DA, Kinzig AP (2012). Biodiversity loss and its impact on humanity. Nature 486:59-67.
Crossref
|
|
|
|
|
Convention on Biological Diversity (CBD) (2009). Connecting
|
|
|
|
|
Derje D (2007). Floristic composition and ecological study of Bibita forest (Gura Ferda), south west Ethiopia. Thesis, Addis Ababa University, Ethiopia.
|
|
|
|
|
Dibaba A, Soromessa T, Kelbessa E, Tilahun A (2014). Diversity, structure and regeneration status of the Woodland and Riverine Vegetation of Sire Beggo in Gololcha District, Eastern Ethiopia. Momona Ethiop. J. Sci. 6(1):70-96.
|
|
|
|
|
Dobson A, Lodge D, Alder J, Cumming GS, Keymer J, McGlade J, Mooney H, Rusak JA, Sala O, Wolters V (2006). Habitat loss, trophic collapse, and the decline of ecosystem services. Ecology 87(8):1915-1924.
Crossref
|
|
|
|
|
Eshetu AA (2014). Forest resource management systems in Ethiopia: Historical perspective. Int. J. Biodivers. Conserv. 6(2):121-131.
Crossref
|
|
|
|
|
Ethiopian Mapping Agency (EMA) (2011). Land use land cover map of Gurage zone, Addis Ababa, Ethiopia.
|
|
|
|
|
Fekadu E, Melesse M, Wendawek AM (2014). Floristic composition, diversity and vegetation structure of woody plant communities in Boda dry evergreen Montane Forest, West Showa, Ethiopia. Int. J. Biodivers. Conserv. 6(5):382-391.
Crossref
|
|
|
|
|
Friis I, Demissew S (2001). Vegetation maps of Ethiopia and Eritrea. A review of existing maps and the need for a new map for the flora of Ethiopia and Eritrea. Biol. Ser. 54:399-439.
|
|
|
|
|
Giriraj A, Murthy M, Ramesh B (2008). Vegetation composition, structure and patterns of diversity: a case study from the tropical wet evergreen forests of the Western Ghats, India. Edin. J. Bot. 65(3):1-22.
Crossref
|
|
|
|
|
Harrison PA, Berry PM, Simpson G, Haslett JR, Blicharska M, Bucur M, Dunford R, Egoh B, Garcia-Llorente M, Geamănă N, Geertsema W, Lommelen E, Meiresonne L, Turkelboom F (2014). Linkages between biodiversity attributes and ecosystem services: A systematic review. Ecosyst. Serv. 9:191-203.
Crossref
|
|
|
|
|
Hedberg I, Kelbessa E, Edwards S, Demissew S, Persson E (2006). Flora of Ethiopia and Eritrea. Vol 5, Gentianaceae to Cyclocheilaceae. The National Herbarium, Addis Ababa University, Addis Ababa and Uppsala.
|
|
|
|
|
Kassa Z, Asfaw Z, Demissew S (2016). Plant diversity and community analysis of the vegetation around Tulu Korma Project Centre, Ethiop. J. Plant Res. 3(2):292-319.
|
|
|
|
|
Kelbessa E, Soromessa T (2008). Interfaces of regeneration, structure, diversity and uses of some plant species in Bonga Forest: A reservoir for Wild Coffee Gene Pool. SINET: Ethiop. J. Sci. 31(2):121-134.
|
|
|
|
|
Kenea F (2008). Remnant Vegetation and population structure of woody species of Jima Forest, Western Ethiopia. Thesis, Addis Ababa University, Ethiopia.
|
|
|
|
|
Kidane L (2003). Floristic composition and human interaction in the Huqumuburda Gratkassu forest. Thesis, Addis Ababa University, Ethiopia.
|
|
|
|
|
Mace GM, Norris K, Fitter AH (2012). Biodiversity and ecosystem services: a multilayered relationship. Trends Ecol. Evol. 27(1):19-26.
Crossref
|
|
|
|
|
Millennium Ecosystem Assessment (MA) (2005). Ecosystems and Human Well-Being: Synthesis. Island Press, Washington.
|
|
|
|
|
Ministry of Agriculture (MOA) (2000). Agro-ecological zones of Ethiopia, Addis Ababa, Ethiopia.
|
|
|
|
|
National Metrological Service Agency (NMA) (2016). Weather stations data around Gurage Mountain. Addis Ababa, Ethiopia.
|
|
|
|
|
Pappoe AN, Armah FA, Quaye EC, Kwakye PK, Buxton GN (2010). Composition and stand structure of a tropical moist semi deciduous forest in Ghana. Int. Res. J. Plant Sci. 1(4):95-106.
|
|
|
|
|
Quijas S, Schmid B, Balvanera P (2010). Plant diversity enhances provision of ecosystem services: A new synthesis. Basic Appl. Ecol. 11(7):582-593.
Crossref
|
|
|
|
|
Schmitz OJ, Lawler JJ, Beier P, Groves C, Knight G, Boyce Jr DA, Bulluck J, Johnston KM, Klein ML, Muller K, Pierce DJ (2015). Conserving biodiversity: practical guidance about climate change adaptation approaches in support of land-use planning. Nat. Areas J. 35(1):190-203.
Crossref
|
|
|
|
|
Shibru S, Balcha G (2004). Composition, structure and regeneration status of woody species in Dindin Natural Forest, Southeast Ethiopia: An implication for conservation. Ethiop. J. Biol. Sci. 3(1):15-35.
|
|
|
|
|
Šmilauer P (2001). Vegetation description and analysis. A Practical Approach 101-103.
|
|
|
|
|
Tadesse M (2004). Asteraceae (Compositae). In: Hedberg I, Friis I, Edwards S (eds) Flora of Ethiopia and Eritrea. Vol 4 (1). The National Herbarium, Addis Ababa University, Addis Ababa and Uppsala.
|
|
|
|
|
Tura GB, Reddy PR (2015). Floristic composition and structure of the vegetation of Magada forest, Borana zone, Oromia, Ethiopia. Univ. J. Plant Sci. 3(5):87-96.
|
|
|
|
|
Woldetsadik M (2004). Impacts of population pressure on land use/land cover change, agricultural system and income diversification in West Gurageland, Ethiopia. Norwegian J. Geogr. 58:46.
|
|
|
|
|
Woldu Z (1999). Forests in the vegetation types of Ethiopia and their status in the geographical context. In: Forest Genetic Resources Conservation: Principles, Strategies and Workshop Proceedings. Institute of Biodiversity Conservation and Research, and GTZ, Addis Ababa.
|
|
|
|
|
Woldu Z (2012). Environmental and ecological data analysis basics, concepts and methods. Lambert Academic Publishing, Germany.
|
|
|
|
|
Yeshitela K, Bekele T (2003). The woody species composition and structure of Masha Anderacha forest, Southwestern Ethiopia. Ethiop. J. Biol. Sci. 2(1):31-48.
|
|
|
|
|
Zerga B (2016). Extent and causes of eucalyptus tree farming expansion in Eza Wereda, Ethiopia. Int. J. Adv. Eng. Sci. 5(1):31-52.
|
|