Full Length Research Paper

ABSTRACT
A study to estimate population size and distribution of elephants in the Rubondo Island National Park (RINP) was conducted between March and July 2014. It involved elephant dung survey methods. In estimating elephant dung pile density, a total of 217 dung piles were enumerated in 58 transects (each 1 km). The on-site dung decay rate computed from 100 marked fresh dung piles was estimated to be 0.01542 per day. By combining estimated dung pile density, on-site decay rate and defecation rate of 17 dung piles per day, the study found an estimate of about 102 elephants (95% CI, 72-144). Furthermore, results of this study indicate that, elephants were found to be more concentrated on the central and northern zones, which are the areas of the park that have some open glades allowing elephant to access the area easily to lake shores. The information generated from the study can be incorporated into setting up future management strategies for elephant conservation in RINP.
Key words: Rubondo Island National Park (RINP), distance sampling, dung pile density, decay rate.
INTRODUCTION
The African elephant (Loxodonta africana) is the largest terrestrial mammal and an icon of the African wilderness, the population of which is declining across its range (Blanc, 2008). The species is known to exist in a variety of habitats ranging from tropical forests, savannah to deserts and the species tends to extend habitats in searching for food, water and cover (Blanc, 2008 Stephenson, 2007). Some findings have shown that elephants need large home ranges and require extensive areas to meet their basic metabolic requirements (Shannon et al., 2008).
The elephant populations are declining in most protected areas across the region due to poaching and habitat loss (Blanc, 2008). In 2007, it was estimated that elephant numbers on the African continent were between 472,269 and 689,671 (Blanc et al., 2007). Currently, it is estimated that the African elephant population ranges between 419,000 and 650,000 individuals, and these are predominantly found in Southern and Eastern Africa (IUCN/AfESG, 2013). Blanc et al; (2007) estimated that 39% of the African elephant’s range is found in Southern Africa, 29% in Central Africa, 26% in Eastern Africa and only 5% in West Africa (UNEP/CITES/IUCN/TRAFFIC, 2013). Population estimates of large herbivores can aid management decisions if estimates are accurate and precise. Therefore, survey intensities should be done in a way that could yield accurate and precise population estimates and detect population changes for several African elephant populations. Based on ground and aerial censuses the elephant population in Tanzania was estimated to be about 109,051 individuals (TAWIRI, 2009). In 2013, it was reported that, there were only about 13,084 (± 1,816 SE) elephants in the Selous - Mikumi ecosystem and these estimates are stated to be the lowest records since the time when census began in 1976 (TAWIRI, 2013). By 2014, there were about 43,521 (± 3,078 SE) elephants in Tanzania (TAWIRI, 2015). Hence, there is a decline by 60% from 109,051 (± 5,899 SE) elephants in 2009 (TAWIRI, 2015).
Since introduction of six immature elephants (two males and four females) between 1972 and 1973 (TANAPA, 2003), the park management has been lacking reliable updated information on population size of the elephants and their interaction with various habitats in RINP. It is impractical to use the direct count surveys in estimating abundance of elephants in forest areas. The dung count method was employed in estimating the population of the elephants in RINP, as it is recommended for areas where the observer(s) cannot openly and clearly see the animals in the study area (Barnes, 2001).
The dung count technique provides precise estimates that could be comparable to both direct counts and aerial surveys (Barnes, 2001, 2002). The combination of dung pile density, defecation and decay rate of dung piles is used for estimating population sizes of animals in forest areas (Barnes and Jensen, 1987). Dung count surveys provide good estimates with reasonable confidence limits (Barnes, 2002; Eggert et al., 2003). The minimum samples suggested for indirect surveys in the field ranges between 60 and 80 (Varma et al., 2012). For example, the dung count method was used to estimate the population size of 124 elephants (95% CI, 44-242) in Sapo National Park, Liberia with an estimated area of 630 km2 (Yaw and Sani, 2009). Following RINP to have closed vegetation, may impose difficulty for aerial and ground surveys. The dung count method is suitable for providing information for long-term management of elephant population and habitats on the Island.
MATERIALS AND METHODS
Study area description
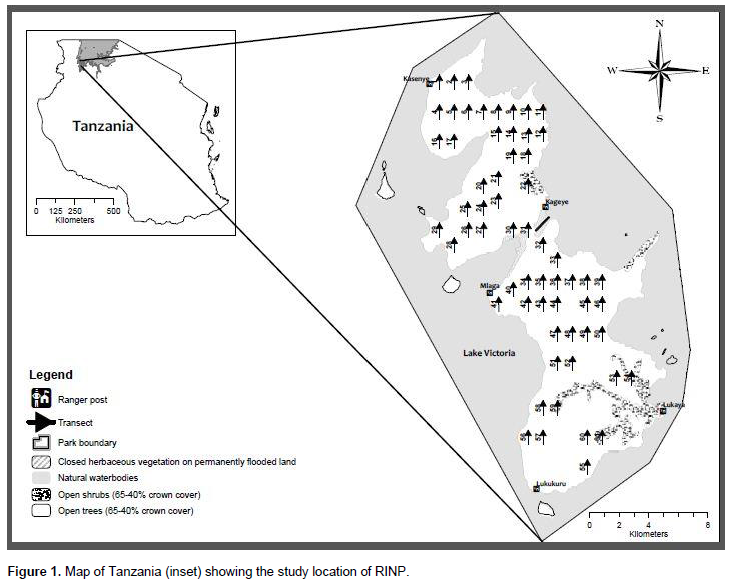
The study was carried out in RINP, in the south-western portion of Lake Victoria that lies 2° 18′ S and 31° 50′ E (Figure 1). Rubondo Island National Park was gazetted in 1977 and became the tenth National Park in Tanzania (TANAPA, 2003). The park covers a total area of 456.8 km2, of which half (236.8 km2) is dry land (TANAPA, 2003). The altitude of the park ranges from 1,100 to 1,500 m. It receives bimodal rainfall with long rains occurring from March to May, short rains from October and December and a dry season of January-February (TANAPA, 2003). Temperature is moderate ranging from 16 to 26°C (TANAPA, 2003).
Vegetation consists of mixed evergreen and semi-deciduous forest with common species including Croton sylvaticus, Drypetes gerrardii and Lecaniodiscus fraxinifolius. The island consists of a dense understory of lianas, or woody vines (Moscovice et al., 2007). Common native fauna include the vervet monkeys (Cercopithecus aethiops), sitatunga (Tragelaphus spekei) and bushbuck (Tragelaphus scriptus). Several mammals were introduced on the island including black rhino (Biceros bircornis), chimpanzees (Pan troglodytes), giraffes (Giraffa camelopardalis), black and white colobus monkeys (Colobus abyssinnicus) and Suni antelopes (Neotragus moschatus) (TANAPA, 2003). Black rhino has become extinct on the island during the wave of poaching in East African countries including Tanzania in 1980s (TANAPA, 2003).
Study design and data collection
Elephant dung pile-decay rate
The decay rate study was designed based on the information of sites reported to have frequent elephant visits. In addition, some fresh dung piles that were encountered during survey of dung density were included in the dung decay study. Due to limitation of time and financial resources, the prospective method was employed. Through this method, fresh dung piles were marked and monitored at specific time intervals until their disappearance. Searches and monitoring of marked fresh dung piles took about three (3) months. Following the methods established by Alfred et al. (2010), elephant dung piles were classified as fresh meaning less or equal to 24 hours post-defecation based on the presence of flies, odour and moisture. Fresh dung piles were marked with wooden rods and tagged with pieces of printed tape of 1 m in length. Monitoring of decay rate was done after every five to seven days for a period of three months. The dung disappearance score was assessed during the monitoring time period based on the categories of classification as established by (Barnes, 2002; Alfred et al., 2010).
Other parameters pertinent to dung decay rate including presence of flies, dung beetles, vegetation type, canopy cover, altitude, local name of the site and weather were also noted. The location of dung piles was marked by GPS to aid monitoring and estimation of dung disappearance rate. Other tools used during data collection included, measuring tape, digital camera, field knife and folder file.
Dung pile density
The standard line transect method was used in estimating elephant dung pile density (Buckland et al., 2001). Surveys for enumerating number of dung piles on the island along the designed line transects took three months. Prior to data collection line transects were systematically distributed on a map of RINP with a fixed length of 1 km and at intervals of 1 km apart (Figure 1). Transects were all designed to run in a south to north direction. Estimation of density of elephant dung piles was based on three major assumptions; dung piles within each transect could be detected with certainty, dung piles were detectable at their initial location and measurements of perpendicular distances were exact (Buckland et al., 2001). The tape measure was used to work out perpendicular distances from transects to the centre of the dung piles encountered.
Classification of dung piles for enumeration used in estimation of dung pile density was based on criteria (S1-S5) developed by Alfred et al. (2010). A total of 58 transects were used for dung survey in determining elephant density and distribution in RINP. To obtain comprehensive information on dung counts, surveys were conducted between 9 am and 4 pm every day to minimize the effect of canopy cover on detecting dung piles along the line transects. A team consisting of three personnel (one researcher, one field assistant and one armed park ranger) walked along transects.
Distribution of elephants in RINP
Elephant dung piles encountered through transect surveys were recorded as indicators of distribution. Other indicators of distribution such as elephant trails, wallowing sites, live elephants, foraging signs, carcasses and foot prints were also noted.
Data analysis
Elephant decay rate and dung piles density
The statistical programme GENSTAT was used in calculation of the mean survival time of dung piles (Meredith, 2007). Elephant dung pile decay rate was obtained by finding the mean survival time of all decayed samples and then the reciprocal value obtained was considered to be the estimate value for decay rate per day in the area (Buckland et al., 2001).
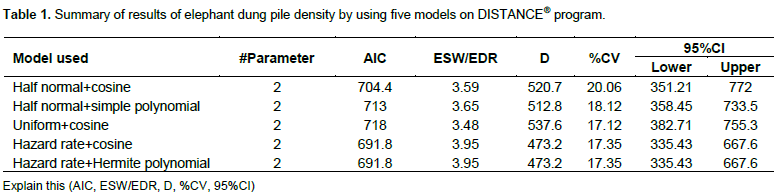
Computation of dung pile density was performed by using the DISTANCE 6.0 program (Thomas et al., 2010). Five models were fitted to obtain precise estimate of the elephant population as recommended in distance sampling (Table 1). There was no difference on the outputs when truncation applied to various models. The hazard rate model with some adjustments (Cosine and Hermite) gave consistent results with lowest Akaike’s Criterion Information (AIC) values. Hence, by having lower AIC value and sound histogram, these models were considered as the best estimators for density of elephant dung piles.
Elephant density and numbers
The dung pile density obtained by the distance programme (Buckland et al., 2001) was converted to elephant density. Due to limitation of time and financial resources, adopted defecation rate of 17 dung piles per day for Kibale National Park in Uganda was used in estimating the population size of elephants (Wing and Buss, 1970). Calculation of density and number of elephants was done according to McClanahan (1986), Barnes and Jensen (1987).

Where, E represents elephant density, D is the dung pile density obtained from distance analysis (Buckland et al., 2001), R is the dung decay rate and Y represents the defecation rate.
The combination of estimates of dung pile density, decay and defecation rates was used to give an estimate of population size of elephants in Rubondo Island National Park. The distribution of indicators of elephants was analysed by assessing the percentage of encounters of indicators in different habitats on the island.
RESULTS
Dung decay rate, dung piles density and elephant population estimates
Five sites encountered with fresh dung piles were surveyed; Maji Matakatifu (4 dung piles- woodland), headquarters (23 dung piles-woodland), air strip (21 dung piles-open woodland), road to Mlaga ranger post (30 dung piles-woodland) and Mlaga campsite (25 dung piles - glade), Kamea road (1 dung piles - woodland) and Mlaga to Lukaya/Lukukuru road (11 dung piles - woodland). Although 115 fresh dung piles were marked and monitored in various habitats, 100 dung piles were used for the determination of decay rate as 15 were not relocated. This was due to the disturbance led by road maintenance of road from headquarters (Kageye) to Mlaga ranger post.
Mean survival time for dung piles was 64.842 (S.E. ± 1.36) days with coefficient of variation of 2.097. The elephant dung pile decay rate was 0.01542 per day. A total of 217 dung piles were enumerated in a total length of 58 km of parallel line transects. The elephant dung piles density was estimated to be 473.22 (95% C.I. 335.43- 667.60) dung piles per km2 (Table 1). Akaike’s Information Criterion (AIC) provides a quantitative method for model selection and model with lowest AIC is selected for final analysis and inferences (Buckland et al., 1993). It attempts to identify how the model that fits with the data well. Based on the findings of this study in determining the dung piles density, Hazard rate with cosine and hermite polynomial adjustments gave the lowest AIC values (691.8) (Table 1). Effective strip width (ESW) is the average distance where dung piles were detected during dung count survey. The coefficient of variation (CV) gives a measure of precision of the estimate and is usually expressed in percentage. Outputs having low variances are considered to be more precise. The model which was considered to give the precise estimate has a percentage of coefficient of variation of 17.35 (Table 1). The 95% confidence interval (CI) is used in determining the lower and upper value of an estimate. In DISTANCE program AIC, ESW, %CV and 95%CI are computed automatically.
Basing on the findings of this study, RINP was estimated to have about 102 elephants (95% CI, 72-144). The density of elephants in the RINP was estimated to be less than one elephant (0.43) per km2.
Distribution of elephants on the Island
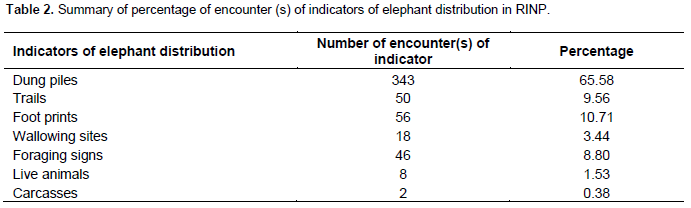
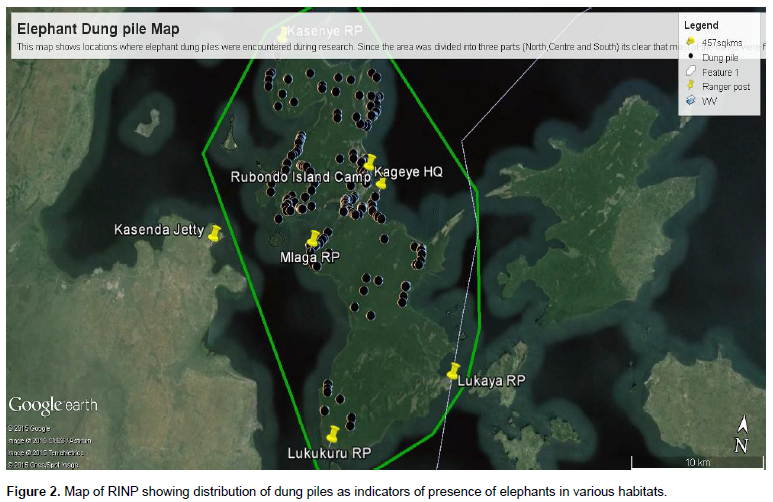
About 523 of elephant signs were recorded during the survey. Dung piles including other indicators such as elephant trails, carcasses, live elephants, wallowing sites, foot prints and foraging signs were also observed. It was found that 65.58% (N=343) of dung piles and 0.38% (N=2) of carcasses as the highest and lowest encounters, respectively (Table 2). Two carcasses of elephants were found in the central and southern zones of the park with tusks intact. Elephant activities were mostly observed to be concentred on the central and northern zones of the study areas (Figure 2). Frequent visits of elephants have been reported to ranger posts associated with feeding activities. Most encountered plant species browsed by elephants included Annona senegalensis, Phoenix reclinata, Ekerbegia capensis and Aeschynomene elaphroxylon.
DISCUSSION
Elephant dung pile decay rate
The study of elephant dung pile decay rate as a means of estimating abundance of elephants was the first to be conducted in RINP. A precise estimate of decay rate in the study area was considered to yield precise estimates of elephant numbers in forest areas. Dung piles, deposited in areas with high vegetation canopy cover were observed to decay faster compared to those underlow or no canopy cover. This may be due to the steady environmental temperatures which favour a higher rate of dung decomposition. Deposition of dung piles in habitats without canopy cover exposes microorganisms (dung beetles, termites and microbes) to unfavourable conditions for decomposition to take place. The climate variables (rainfall, irradiance and temperature) and elephant diet are also considered as the determinant of elephant dung piles decay rate (Barnes, 2001). Moreover, the nature of food materials of plant species eaten by elephants has great influence on disappearance of deposited dung piles.
Elephant density and population estimate
Results from this study show that, there has been an increase in the number of elephants from six (6) in 1973 to 102 elephants in 2014, implying that the RINP elephant population is increasing. Forage biomass, forage quality, water availability, shade and plant species composition has correlation with density and distribution of elephants (Harris et al., 2008). Increase in elephant population in RINP may be contributed by receipt of enough rainfall annually, presence of water body surrounding the island, high canopy covers. Availability of shades almost over the island makes RINP as the suitable habitat for elephants in regulating metabolism of these large herbivores.
These findings are indicative of the fact that, elephant population growth on Rubondo Island is promising. Based on the physiognomy, paved paths and resources utilized by elephants on the island, findings of this study suggest that the island is able to support the existence of wildlife species. However, due to limited size of the island with only dry land of 236.8 km2, large number of elephants may exceed the carrying capacity of the area probably in the future. As a result, the ecosystem on the island may lose its aesthetic value due to overexploitation of resources by elephants. Until the time of the survey, only three elephant carcasses with tusks had been reported in all three incidents, it is possible that the deaths were caused by natural factors. There has been no field report of elephant poaching on Rubondo Island. The detection probability during transect survey in enumerating number of dung piles was affected by a number of factors, including composition of understory since the nature of vegetation in RINP is vast rain forest type. Cloudy weather and canopy cover also influenced poor performance of
Distribution
High density of dung piles was found at the central and northern parts of the park indicating presence of more elephants in these areas (Figure 2). Some studies have shown that, resources availability and accessibility influence the elephant activities (Shannon et al., 2008). Raphia swamps were found to have high level of elephant activities in Sapo National Park in Liberia (Yaw and Sani, 2009). In fact, suitable habitats are preferred by elephants. Presence of good road network and tracks at the central and northern zones enhance easy movement of humans and animals near or along the tracks. Occurrence of elephants in small herds encourages flexible movement between different habitats. High density of dung piles was also encountered close to the lake shore, revealing that availability of water predicts movement and activities of elephants in RINP. During periods of shedding leaves by trees, elephants were observed to prefer utilizing habitats along the lake. In some circumstances elephants were observed browsing on Aeschynomene elaphroxylon, which is found in water near the lake shore. In some other instances, elephant signs were encountered in habitats where lemon trees are found. Remains of lemon fruit were observed among contents of some elephant dung piles. Phoenix reclinata is mostly utilized by elephants because it can easily be uprooted and eaten. Foot prints, trails, carcasses, wallowing sites and elephants themselves were regarded as other signs indicative of presence of the mega herbivores and their related activities in various habitats.
CONCLUSION
Findings of this study have shown that, the elephant population in RINP is increasing. This remark may be due to low level of poaching and successful adaptation of elephants to environments in forest areas on the island. High concentration of dung piles at the central and northern zones of the park may imply the availability of suitable habitats for elephants. It is recommended that, park management should continue to monitor population trend of the elephant on the island in specific interval of time. Moreover, further studies are needed to determine the carrying capacity of the island. This may be helpful in controlling the number of elephants so that cannot disrupt the welfare of other wildlife species on the island. In context of contemporary management of endangered wildlife species, in future there is a need to undertake genetic studies to undertake the inbreeding risks of isolated small population on the island.
CONFLICT OF INTERESTS
The authors have not declared any conflict of interests.
ACKNOWLEDGEMENTS
We thank the Government of United Republic of Tanzania through the Commission for Science and Technology (COSTECH) and The Nelson Mandela African Institution of Science and Technology for funding this research. We acknowledge Professors Stephen Buckland and Len Thomas for their technical assistance and training on survey design and data analysis for estimation of population size of elephants in forests. Mwita Machoke and Laurent Nzuki assisted on design
REFERENCES
|
African Elephant Specialists Group (AfESG). (2013). Unpublished updated numbers of total African elephant population numbers. IUCN/SSC African Elephant Specialist Group. |
|
|
Alfred R, Ahmad AH, Payne J, Williams C, Ambu I (2010). Density and population estimation of the Bornean elephants (Elephas maximus borneensis). Online J. Biol. Sci.10:92-102. |
|
|
Barnes RFW, Jensen KL (1987). How to count elephants in forests IUCN African Elephant & Rhino Specialist Group Technical Bulletin I: 1-6. |
|
|
Barnes RFW (2001). How reliable are dung counts for estimating elephant numbers? Afr. J. Ecol. 38:1-9. |
|
|
Barnes RFW (2002). The problem of precision and trend detection posed by small elephant populations in West Africa. East African Wildlife Society. Afr. J. Ecol. 40:179-185. |
|
|
Blanc J (2008). Loxodonta africana. The IUCN Red List of Threatened Species. Version 2014.2.<www.iucnredlist.org>. Downloaded on 04 August 2014. |
|
|
Blanc JJ, Barnes RFW, Craig GC, Dublin HT, Thouless CR, Douglas-Hamilton I, Hart JA (2007). African elephant status report 2007: An update from the African Elephant Database. Gland (Switzerland): IUCN. |
|
|
Buckland ST, Anderson DR, Burnham KP, Laake JL. (1993). Distance Sampling Estimating Abundance of Biological Populations. Chapm& Hall, London, UK. |
|
|
Buckland ST, Fernanda FC, Marques TA, Goffin D, Dixon CE, Borchers DL, Mayle BA, Peace AJ (2001). Estimating Deer Abundance From Line Transect Surveys of Dung: Sika Deer in Southern Scotland. J. Appl. Ecol. 38:349-363. |
|
|
Eggert LS, Eggert JA, Woodruff DS (2003). Estimating population sizes for elusive animals: the forest elephants of Kakum National Park, Ghana. Mol. Ecol. 12:1389-1402. |
|
|
Harris GM, Russel GJ, Van Aarde RI, Pimm SL (2008). Rules of habitat use by elephants (Loxodonta africana) in southern Africa: insights for regional management. Oryx. 42:66-75. |
|
|
MCclanahan TR (1986). Quick population survey method using fecal droppings and a steady state assumption. Afr. J. Ecol. 24:37-39. |
|
|
Meredith M (2007). CITES MIKE Program, Africa. |
|
|
Moscovice LR, Issa MH, Petrzelkova KJ, Snowdown CT, Huffman MA, Keuler NS (2007). Fruit Availability, Chimpanzee Diet, and Grouping Patterns in Rubondo Island, Tanzania. Am. J. Primatol. 69:487-502. |
|
|
Shannon G, Druce DJ, Page BR, Eckhardt HC, Grant R, Slotow R (2008). 'The utilization of large savanna trees by elephant in southern Kruger National Park.' J. Trop. Ecol. 24:281-289. |
|
|
Stephenson PJ (2007). WWF Species Action Plan: African elephants, 2007-2011, WWF, Gland, Switzerland. |
|
|
Tanzania National Parks (TANAPA). (2003). General Management Plan for Rubondo Island National Park 2003-2013. Arusha, Tanzania. |
|
|
Tanzania Wildlife Research Institute (TAWIRI) (2009). Tanzania Elephants Management Plan 2010-2015. Arusha, Tanzania. |
|
|
Tanzania Wildlife Research Institute (TAWIRI) (2013). Population Status of African Elephant in Selous – Mikumi Ecosystem, Dry Season. Arusha, Tanzania. |
|
|
Tanzania Wildlife Research Institute (TAWIRI) (2015). Population Status of Elephant in Tanzania. Arusha, Tanzania. |
|
|
Thomas L, Buckland ST, Rexstad EA, Laake JL, Strindberg S, Sharon L, Hedley SL, Bishop JRB, Marques TA, Burnham KP (2010). Distance software: design and analysis of distance sampling surveys for estimating population size. Colorado State University, USA. |
|
|
Varma S, Baskaran N, Sukumar R (2012). Field Key for Elephant Population Estimation and Age and Sex Classification. Resource material for synchronized elephant population count using block count, line transect dung count method and waterhole count. Asian Nature Conservation Foundation, Innovation Centre, Indian Institute of Science, Bangalore. |
|
|
Wing LD, Buss IO (1970). Elephants and forests. Wildlife Monographs. 19:3-92. |
|
|
Yaw B, Sani MM (2009). Status of the Sapo National Park elephant population and implications for conservation of elephants in Liberia. CITES MIKE Programme, 01 BP 1618, Ouagadougou, Burkina Faso. |
|
Copyright © 2024 Author(s) retain the copyright of this article.
This article is published under the terms of the Creative Commons Attribution License 4.0


