ABSTRACT
Riparian forest buffers (RF) are integrative part of the savanna agricultural landscape. However, they are under threat of deforestation from agricultural intensification. To ascertain the impact of the deforestation, this study used remote sensing techniques and field inventorying to assess riparian woody plant diversity on farmland (FA) and forest reserve (FR) along Tankwidi rivercourse in the Sudanian savanna of Ghana. Post-classification analysis of Landsat images revealed a reduction in forest cover from 1986 (23%) to 2014 (7%) in the river basin. Ground survey of sixty randomly selected plots (500 m2 per plot) equally divided between FA and FR along the river in a 50 m buffer zone showed a reduction in the number of woody species (diameter ≥ 5 cm) from FR (40) to FA (19). Anogeissus leiocarpus and Mitragyna inermis were the most abundant species in both FR and FA. Shannon-Wiener Index for species diversity reduced from FR (2.5±0.09) to FA (1.8±0.14). Within FR, there were more species (58%) in the lower diameter class (5 to 15 cm) than the higher diameter classes (15 to 50 cm) suggesting successful regeneration. The reverse was observed in FA where the individuals in the lower diameter class were fewer (26%) than the higher diameter classes. Reduction in species density from FR (355±21) to FA (146±11) will increase the surface exposure of the riparian area in farmland to heighten risks to climate disasters such as fires and flooding. Managing the risks will not be possible unless a conscious effort is made to educate farmers on the roles of RF, replanted to enhance diversity or riparian buffer excluded from farming for vegetation recovery.
Key words: Riparian buffer, biodiversity, Sudanian savanna, agricultural watershed.
Abbreviation:
SWI, Shannon-Wiener; SI, Simpson; RF, riparian forest; FA, farmland; FR, forest reserve; TM, thematic mapper; ETM+, enhanced thematic mapper plus; OLI, landsat operational land imager; SR, species richness.
Grassland riparian habitats in savanna or any other wooded grassland-type biomes can be seriously impacted by broadcast effects of climate change, especially due to changing river hydrology and altered animal movement patterns (Sambare et al., 2011). However, certain outcomes of climate change can be mitigated by maintaining intact riparian landscapes- including retaining soil moisture, regulation of localized fire, and provision of refuge and dispersal corridors for fauna (Goetze et al., 2006; Azihou et al., 2013). Ecologically, riparian forests (RF) are important as they protect farmlands from flooding, drying and sedimentation (Gray et al., 2014). They provide shade and moderate stream temperatures for aquatic life. Their litter production from trees is an important component of the river foodweb. Further, the forest cover reduces erosion and stabilises river banks (Surasinghe and Baldwin, 2015). Riparian forests also serve as habitat for fauna such as birds, insects and other organisms that are essential for crop pollination, seed dispersal and nutrient cycling (McCracken et al., 2012; Gray et al., 2014). Social benefits including oppor-tunities for tourism, medicines, nutrition, firewood, and raw material for different crafts and construction are derived from riparian forests (Ceperley et al., 2010). Culturally, riparian forests are sometimes designated as sacred groove (Ceperley et al., 2010). Due to these functions and many others, some RF are protected by Ramsar convention, other national laws and policies (McCracken et al., 2012; Gray et al., 2014).
Within the water-limiting savanna environment, riparian basins are suitable for agricultural production (Natta et al., 2003; Goetze et al., 2006). As a result, the riparian forests are under threat of deforestation which could change their microclimatic conditions to increase climate change effects on species and associated functions (Callo-Concha et al., 2012). In this savanna region, land areas dedicated to agricultural production are much greater than protected forest reserve areas (Traore et al., 2012; Gray et al., 2014). This means that the agricultural landscapes cannot be excluded from plant diversity conservation (Gray et al., 2014). With appropriate management, agricultural landscapes can contribute to the preservation of plant diversity and delivery of ecosystem services (McCracken et al., 2012; Gray et al., 2014). However, in spite of the knowledge on the threat of agricultural production to riparian forests, our understanding in this area is limited in the tropical savannas of Ghana and West Africa in general (Natta et al., 2003; Ceperley et al., 2010; Sambare et al., 2011).
Studies have shown that the intensification of farming and commercialization of agriculture cause deforestation and reduce the plant diversity on farmlands (Ceperley et al., 2010; Okiror et al., 2012). In other studies, the mosaic nature of heterogeneity of farmlands supports high plant diversity (Fahrig et al., 2011; Traore et al., 2012; Morelli, 2013). This suggests that not all farming practices have negative effects on plant diversity (Gray et al., 2014). To assess the impacts of agricultural production activities on riparian forests in the savanna agricultural landscape of the Tankwidi river, this study compared woody plant diversity in riparian buffer of farmlands and forest reserve of the Tankwidi river basin in the Sudanian savanna of Ghana. Because of agricultural activities, it is hypo-thesized; firstly that riparian buffer in reserve area would have higher woody plant diversity than in farmland. Secondly, it is expected that the tree size distribution of the woody plants would differ between forest reserve and farmlands. It is envisaged that the study will serve as an important baseline for the management of farmland woody plant diversity as well as the enforcement of the freshwater buffer zone policy of Ghana.
Study area
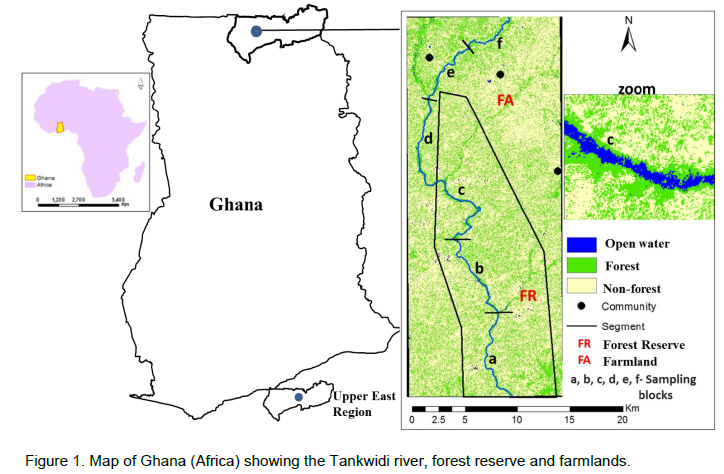
The study was conducted in farmland (FA) and Tankwidi forest reserve (FR) along the Tankwidi rivercourse in the Sudanian savanna of the Upper East region of Ghana (Figure 1). The climate is influenced by tropical monsoon (Callo-Concha et al., 2012). The area has unimodal type of rainfall with a mean annual rainfall of 800 mm and a mean annual temperature of 36°C. The soils consist of light top soils with variable texture and coarse sandy loams to heavier sub-soils with varying amount of gravel (Callo-Concha et al., 2012; BirdLife, 2014). The topography is flat to gently undulating with maximum elevation of 150 m (BirdLife, 2014). The Tankwidi forest reserve has an area of 19,221 ha. It protects the tributaries of the Tankwidi river. Logging is not allowed in the reserves. Communities fringing the reserve, however, have special use rights in the collection of non-timber forest products. The reserve is a key habitat of migratory birds from Europe (BirdLife, 2014). The farmlands are affected by various anthropogenic activities including extensive livestock grazing, bush fires, and various harvestings of timber and non-timber forest products such as wood, leaves, bark, flowers and fruits (Callo-Concha et al., 2012).

Forest cover dynamics of Tankwidi riparian basin (1986-2014)
Selection of Landsat images for broad landscape assessment
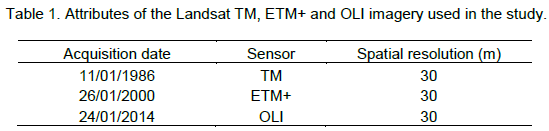
Medium resolution satellite data inputs for multi-temporal studies of forest cover were obtained from the Landsat Thematic Mapper (TM), Landsat Enhanced Thematic Mapper Plus (ETM+), and Landsat Operational Land Imager (OLI). The images (Table 1) were downloaded from the United States Geological Survey National Center for Earth Resources Observation and Science via the GLOVIS data portal (http://glovis.usgs.gov/). Images with no cloud cover and which were available within the time frame in 1986, 2000 and 2014 were downloaded. All the dates of the selected images were within the dry season when the grassy layers have been scorched thereby increasing the detectability of forests. The satellite images had the same flight path (path = 194, row = 53). Universal Transverse Mercator was the projection system of the images WGS 84.
Collection of ground control points
During the fieldwork from September to December, 2013, ground control points and forest canopy density data were collected within the Tankwidi river basin using GPS and spherical densitometer, respectively. The data from this fieldwork was used to classify the 2014 Landsat image into “forest” and “non-forest” areas. Further, ground control points for the classification of the 2000 Landsat image was also collected on the field with the aid of historic Landcover map prepared for the study area under the GLOWA-Volta Project (Volta Basin Authority Geoportal, 2000). This was done by first identifying the features on the Landcover map prepared in 2000 and which could still be verified during fieldwork. This entailed identifying stable landcover in the forest reserve, along the Tankwidi river, farms and settlements, which had been in existence since 2000. In the case of the 1986 image, “forest" was selected from stable vegetation along rivers.
Forest classification in Tankwidi river basin (1986-2014)
Supervised classification procedures using ERDAS Imagine 2011 software were implemented to classify the Landsat images of 2000 and 2014 using Maximum Likelihood Classification algorithm. Areas with tree canopy of 20% and greater were located on the image and signature were selected and used as training set for classifying “forest areas”. Areas with less than 20% of canopy were classified as “non-forests”. This procedure was undertaken with reference to Potapov et al. (2009). Qualitative assessments of the classified images were further done by examining the classified images visually and relating it to the knowledge obtained from the interview of local people. This ensured that the classified map output reflected reality on the ground. Forest reserve boundary layout was obtained from the geodatabase of the Forestry Commission of Ghana. Analysis of forest cover in terms of area (ha) for 1986, 2000 and 2014 were carried out in ArcGIS 10.1.
Accuracy assessment of forest classification
Fifty percent (50%) of the collected ground control points (test data set) were used for the accuracy assessment of the Landsat map of 2000 and 2014. The classified images were then crossed with the test data to generate confusion matrix. The confusion matrix was used to calculate the different accuracy measures, that is, producer’s, user’s accuracy, class mapping accuracy for each class and the overall accuracy. Kappa statistics were also calculated as additional information for evaluating the accuracies of the maps. It was not possible to carry out accuracy assessment for the 1986 map because of the lack of satellite derived historical reference map. It is however, assumed that the accuracy assessments for the Landcover maps of 2000 and 2014 are sufficient to shed light on the overall classification procedures adopted for this study.
Woody vegetation inventory
Sampling along Tankwidi river
The study used high resolution satellite image (ALOS AVNIR) for mapping riparian forests to support the field sampling. This is because riparian forests are too small to be detected using traditional satellite remote sensing data such as Landsat (at 30 m resolution) or broad scale GIS data (Johansen et al., 2010). The ALOS AVNIR image comprises 4 bands from visible to the near infra-red range (0.42 to 0.89 µm) and has spatial resolution of 10 m. It is managed by Japanese Aerospace Exploration Agency (Bagan et al., 2012). The ALOS AVNIR image was obtained through the Forestry Commission of Ghana. The date of the space acquisition of the satellite image is 27 February, 2011. Maximum likelihood classification algorithm was used for mapping “forest” along the Tankwidi river. The classification accuracy was 84% and the Kappa was 0.73 (confusion matrix not shown). This mapping was done to facilitate the inventory of the riparian woody species with stratified randomized design in farmland (FA) and forest reserve (FR). It was also used for selecting the position of random plots along the riverine area. Whether in FR or FA, the rivercourse was divided into 3 segments; each of length of approximately 8 km. Small variations in the length of the segments were done to accommodate the effects of the roads and bridges on the river. The study was restricted within a buffer zone of 50 m on each side of the river channel. The 50 m buffer zone was chosen as it is a prescribed width for perennial rivers enshrined in the Ghana Riparian Buffer Zone Policy for managing freshwater bodies (Government of Ghana, 2011). The inventory for species with diameter at breast height (DBH) ≥ 5 cm was conducted in sixty random rectangular plots (500 m2 per plot), 30 each in FR and FA and 10 plots per segment. Tree caliper was used to measure the DBH of the species and the height was measured with Vertex IV and Transponder III, Haglof Sweden. Specimens of the species recorded were taken to the herbarium of the Forestry Research Institute of Ghana for confirmation of identification.
Data analysis
Species richness and diversity of woody species
Shannon-Wiener (SWI) (Shannon, 1948) and Simpson (SI) (Simpson, 1949) indices were calculated as measures of woody species diversity. Shannon-Wiener is an index of overall diversity; combining both species richness and abundance, and sensitive to sampling size (Soetaert and Help, 1990). Simpson is an index of heterogeneity of species distribution. Further Pielou Equitability index (Natta et al., 2003) was used to assess the evenness of the species distribution. The selected indices of this study have been used for species diversity assessment in Ghana and West Africa in general (Traoré et al., 2012; Tom-Dery et al., 2013). They were adopted in the research to facilitate comparison of the findings. Species richness (SR) used in this study refers to the number of different species recorded in a plot.
Density, basal area and size-class distribution of woody species
For each landuse management regime (FR or FA), the following structural parameters were calculated:
(i) Woody species density (Zeide, 2005); the average of the number of individuals per hectare.
(ii) Basal area (Zeide, 2005); the average cross-sectional area of woody species per hectare was calculated from the DBH below:
Basal area = ∑ (DBH2π4-1) where π = 3.14
To establish the size-class distributions, diameters of all species were used to construct histogram with size classes of 5 cm interval. This was similarly done for the heights of species at 5 m interval classes. Student’s t-test was used to estimate the significance of the differences between the protected area and farmland after testing for normality using Statistical Package Software for the Social Sciences, Version 17. Results were considered significant at P < 0.05.
Accuracy assessments and landcover dynamics
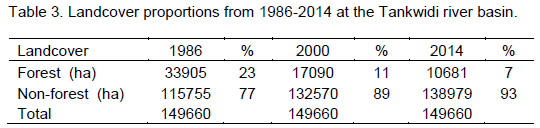
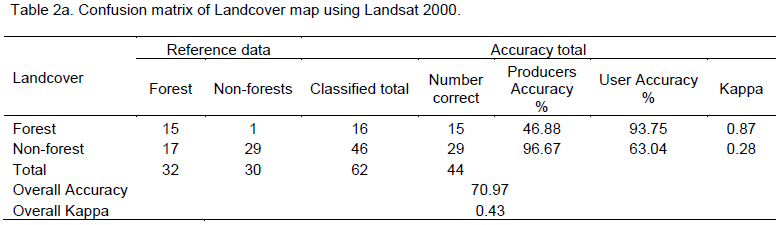
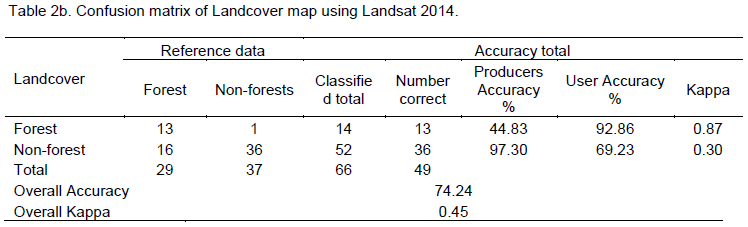
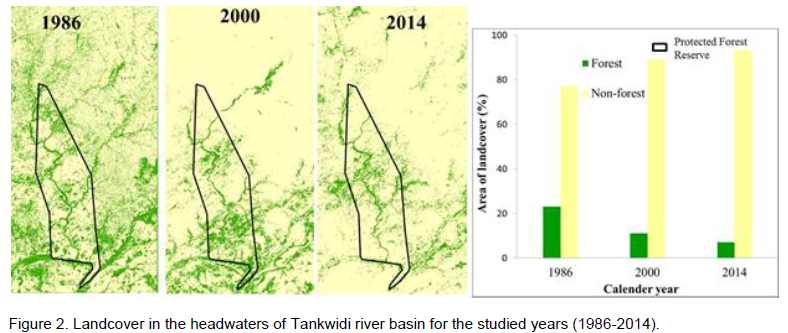
The overall accuracy of the 2000 image of 71% was lower than 2014 image classification accuracy (74%). Kappa coefficient followed a similar trend and in that case the 2000 and 2014 had values of 0.43 and 0.45, respectively. Producer accuracy of the “forest” for 2000 and 2014 were lower than the “non-forest”. The user accuracy of “forest” was nevertheless, higher than the “non-forest” for both 2000 and 2014. Results of the classification accuracy assessments for the maps of 2000 and 2014 are presented in Table 2a and 2b, respectively. The assessment of forest cover in the Tankwidi river basin showed increasing deforestation from 1986 through 2000 to 2014 (Table 3 and Figure 2). In 1986, the forest cover was estimated at 23% of the area studied. It was reduced to 11% by 2000. Currently, the area of forest cover is 7% of the study area. The “non-forest” which comprises primarily of farmland and grassland have been increasing in area coverage since 1986 (77%) through 2000 (89%) to 2014 (93%).

Woody species richness and diversity
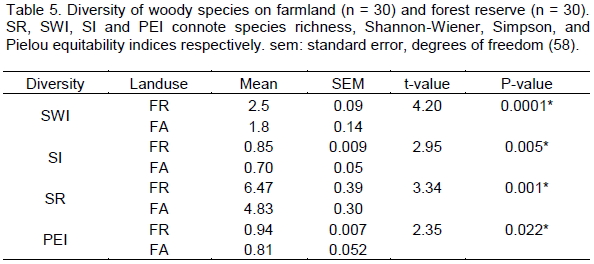
Forty woody species were recorded along the Tankwidi river in forest reserve (FR), whereas 19 species were observed along the same river in farmland (FA) (Table 4). The most species rich farmilies in the FR were Combretaceae (22%), Rubiaceae (20%), Mimosaceae (11%) and Papilionaceae (9%). In the FA, the dominant families were Rubiaceae (19%), Combretaceae (15%), Mimosaceae (13%) and Moraceae (13%). The total number of specimen recorded along the Tankwidi river was 751 with 532 in FR and 219 in FA. Woody species richness and diversity (SR, SWI, SI, PEI) of riparian forest (RF) in the FA was significantly (P<0.05) lower than in FR (Table 5).
Density, basal area and size-class distribution of woody species
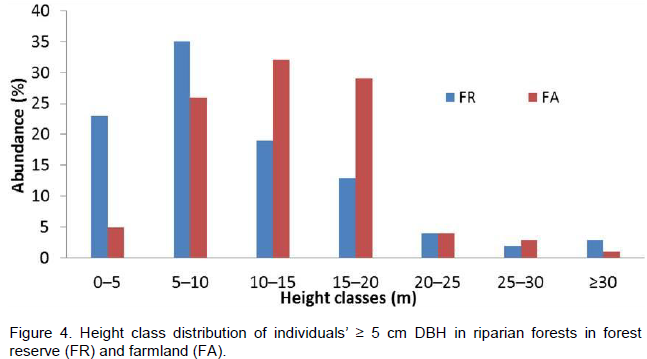
The diameter class distribution of woody species in riparian forest (RF) on forest reserve (FR) showed a reverse “J” shaped curve (Figure 3), whereas the pattern in farmland (FA) showed a deviation from the FR at the lower diameter class (5 to 15 cm). In the FR, majority (58%) of the riparian woody species were in the lower diameter classes (5 to 15 cm) than higher classes (15 to 50 cm). The reverse was observed in the FA where the individuals in the lower diameter class were fewer (26%) than the higher diameter classes (15 to 50 cm). The height classes’ distribution of the woody species followed a similar trend as the diameter (Figure 4). The density of riparian woody species per ha was significantly higher (t = 8.9, df = 58, P < 0.0001) in the FR (355 ± 21) than the FA (146 ± 11). Nonetheless, the mean basal area of woody species per hectare was significantly higher (t = 3.523, df = 58, p = 0.001) in FA (11592 ± 1484) than FR (6022 ± 545).
Landcover map accuracies
The confusion matrix of the 2014 classification was an improvement over the 2000 classification map (Table 2a and 2b). This could be as a result of the use of current validation dataset as observed during fieldwork as opposed to the 2000 classification where reference was made to historic Landcover map and local knowledge in the collection of the validation data. For both 2000 and 2014 classifications, errors were minimized by choosing only two landcover classes (forest/non-forest), with spectrally distinct signatures. The classification accuracy values for both 2000 ((71%) and 2014 (74%) were lower than the 85% overall accuracy threshold used by the United States Geological Survey to determine acceptability (Chai et al., 2009). Nonetheless, the accuracy values of both 2000 and 2014 were similar to that reported in other savannas (Ruelland et al., 2010; Schetter and Root, 2011). The lower accuracy of mapping could be as a result of the heterogeneity of forest patches which according to Ruelland et al. (2010) is difficult to detect in the savanna matrix by using medium resolution satellite image such as Landsat.
Forest cover change
The result of the landcover change analysis shows the deforestation of the Tankwidi basin in both forest reserve and farmlands from 1986 through 2000 to 2014 (Figure 2; Table 3). The deforestation could be attributed to farming activities that remove woody vegetation and in turn replace them with crops. Also, the farmers depend on fuelwood as their main source of energy, and the increasing demand by the populace contribute to the reduction in forest area. Again due to the uncontrolled slash-and-burn activities of farmers, wildfire is prevalent within the forest reserve and farmlands of the study area, which according to Goetze et al. (2006) contributes to tremendous forest loss. The finding on deforestation is however, not peculiar to the study area. This is because evidence of deforestation has been reported in other sub-Saharan African countries and across the tropics (Chai et al., 2009; Traore et al., 2012). The effect of the deforestation includes changes in elements such as light and wind which influence the microclimatic conditions of forest remnants to exert a strong effect on biologica diversity (Goetze et al., 2006). Additionally, the deforestation result in the modification of habitat structure (Goetze et al., 2006), resource availability and distribution (Morelli, 2013), energy and nutrient cycling, temperature and moisture states of the forests (Morandin and Winston, 2006).
Changes in riparian woody species richness and diversity
Although, not all forest cover conversions have negative effects on plant diversity (Traore et al., 2012), field inventory in this study revealed that agricultural activities have reduced the richness of woody plants in the Tankwidi riparian buffer in farmlands. The richness of riparian buffer in disturbed landscapes are normally hindered due to the limitations in the flow of nutrients’ and seeds from vegetation in the adjacent landscape (McKinney, 2008; Okiror et al., 2012). The finding was however, surprising as riparian forest is designated as protected area in all landscapes under the freshwater buffer zone policy of Ghana (Government of Ghana, 2011). The poor enforcement of the policy prescription prohibiting agricultural activities within the buffer zone may have heightened the problem of deforestation in the Tankwidi riparian basin (Government of Ghana, 2011). The result (Table 5) further showed that the riparian forest in forest reserve (FR) has high woody plant diversity than in farmland (FA) (Ceperley et al., 2010; Okiror et al., 2012) and on that basis, the first null hypothesis of the study is accepted. Species diversity is always higher in less disturbed reserves than on farmlands where clearing of land for crop cultivation and burning causes disappearance of woody plants (McKinney 2008; Okiror et al., 2012). The Shannon-Wiener index value recorded for the FR was within the range (2.4 to 5.4) reported in other savannas of West Africa, whereas that observed in the FA was lower (Natta and Porembski, 2003; Natta et al., 2003). In contrast to this research, it has been found in other studies that the species diversity value on agricultural watershed in the tropics is enhanced by the deliberate preservation of trees by farmers (Boakye et al., 2012; Traore et al., 2012; Gray et al., 2014). The fact that the RF on farmland is less diverse is likely to reduce its resilience to disturbance as studies have confirmed that such eco-systems are prone to climatically induced catastrophes such as diseases and alien species invasions (Scherer-Lorenzen et al., 2005). Again the loss of plant diversity results in poor habitats conditions for insects, earthworms and soil micro-organisms that perform such critical ecosystem services as the pollination of crops and breaking down of organic matter in the soil, to the farmland birds facilitating seed dispersal and pollination (Morandin and Winston, 2006; Gray et al., 2014). Changes in any of these services could have damaging effects on crop production and greatly increases concerns over food supply (Eilu et al., 2003; Manning et al., 2006; Okiror et al., 2012).
Changes in riparian woody species density, basal area and size-class distribution
The result on the size class distribution in forest reserve (FR) differs from the farmland (FA) and on that basis the second null hypothesis of this study is accepted. The distribution of the woody species in the FR showed a reverse J-shaped curve suggestive of a stable ecosystem where woody plants are good enough to regenerate naturally and face no danger of extinction (Sambare et al., 2011). According to Lykke (1998), for a population to maintain itself, it needs to have abundant juveniles which will recruit into adult size classes. The reduced number of young individual (5-15cm) on farmlands however, suggests that the riparian forest is poor in recruitment: meaning lower survival of seedlings to sapling stage. This could be as a result of limitation of seed dispersal; which can be due to reduced diversity of animals that are granivores and frugivores or increased abundance of seed predators (Gray et al., 2014). Further, repeated weeding of the riparian area for crop cultivation may have prevented the regeneration of the young individuals (Ceperley et al., 2010) in farmland. Also, the excessive use of chemicals (weedicides) affect regenerative capacity since some of the chemicals kill the seeds that are dispersed (Fischer et al., 2009; Ceperley et al., 2010). The reduction in the regeneration on farmland may affect the ecological succession of riparian forests in farmland and in the long term cause the disappearance of the forests (Okiror et al., 2012).
The high basal area of RF in FA can be explained by the large old trees. From discussion with the local farmers, it could be deduced that those large trees fall into the useful economic tree species that are preserved by farmers. It was observed that Vitellaria paradoxa (Jamala et al., 2013) and Parkia biglobasa (Kronborg et al., 2013) were among the important economic trees supporting the livelihood of farmers. Anogeissus leiocarpus (Agaie et al., 2007), Mitragyna inermis (Wakirwa et al., 2013) and Pterocarpus erinaceus (Noufou et al., 2012) are important medicinal plant and has several domestic uses for the farmers. The fact that the riparian woody density is lower in FA would result in much drier forests due to the increase in the surface exposure of the riparian area for soil moisture loss. This can increase the vulnerability and frequency of the RF to savanna fires (Azihou et al., 2013). Such fires can break the resilience of the riparian ecosystem to intensify climate change impacts to such a degree that species physiological tolerances can be exceeded and the rates of biophysical forest processes altered. Again, the loss of the woody plant density could increase in-stream temperatures and impact on the survival of the aquatic fauna. Example, there are evidences that increasing in-stream temperature sometimes influence the growth of nuisance algae to affect the health of the aquatic habitat (Schweiger et al., 2011).
CONCLUSION AND RECOMMENDATION
Time series data show that there has been a decline in riparian woody plant richness, diversity and density in farmland areas. This could be as a result of agricultural practices on the landscape and the ineffective enforcement of buffer retention regulations. This decline in riparian forest cover puts the landscape at greater risk of harm of natural disturbances such as fires and flooding than would be the case if riparian forest cover and diversity had been retained similar to conditions found in reserve areas. Based on this finding, the study recommends the enforcement of the freshwater buffer zone policy of Ghana to ensure that farmers are excluded from the buffer zone. Farmers should also be discouraged from intensive extraction of resources such as fuelwood and non-timber forest products. Landuses in the uplands could be regulated so as to protect nutrient sources and other low order streams. Replanting of degraded area may augment the composition of the species.
Authors did not declare any conflict of interest.
The authors wish to express their sincere gratitude to the West African Climate Change and Adapted Landuse programme of the German Federal Ministry for Education and Research for providing financial support to the corresponding author to carry-out this research as part of his postgraduate studies. Thanks to all colleagues for their insightful review of the manuscript.
REFERENCES
|
Azihou FK, Glele KR, Ronald B, Brice S (2013). Distribution of tree species along a gallery forest–savanna gradient: patterns, overlaps and ecological thresholds. J. Trop. Ecol., 29(01):25-37.
Crossref
|
|
|
|
Agaie BM, Onyeyili PA, Muhammad BY, Ladan MJ (2007). Acute toxicity effects of the aqueous leaf extract of Anogeissus leiocarpus in rats. Afr. J. Biotechnol., 6: 886-889
|
|
|
|
|
Bagan H, Kinoshita T, Yamagata Y (2012). Combination of AVNIR-2, PALSAR, and Polarimetric Parameters for Land Cover Classification. IEEE T. Geosci. Remote, 50(4):1318-1328.
Crossref
|
|
|
|
|
BirdLife International (2014). Important Bird Areas factsheet: Tankwidi Forest Reserve. Downloaded from http://www.birdlife.org on 12/02/2014.
|
|
|
|
|
Boakye EA, Gils HV, Osei EM Jnr, Asare VNA (2012). Does forest restoration using taungya foster tree species diversity? A case of the Afram Headwaters Forest Reserve in Ghana. Afr. J. Ecol., 50(3):319-325.
Crossref
|
|
|
|
|
Callo-Concha D, Gaiser T, Ewert F (2012). Farming and cropping systems in the West African Sudanian Savanna. WASCAL research area: Northern Ghana, Southwest Burkina Faso and Northern Benin. ZEF Working Paper 100. Bonn.
|
|
|
|
|
Chai SL, Tanner E, McLaren K (2009). High rates of forest clearance and fragmentation pre- and post-National Park establishment: The case of a Jamaican montane rainforest, Biodivers. Conserv., 142:2484–2492.
Crossref
|
|
|
|
|
Ceperley N, Montagnini F, Natta A (2010). Significance of sacred sites for riparian forest conservation in Central Benin. Bois. For. Trop., 303(1):5-23.
|
|
|
|
|
Eilu G, Obua J, Tumuhairwe JK, Nkwine C (2003). Traditional farming and plant species diversity in agricultural landscapes of south-western Uganda. Agric. Ecosyst. Environ., 99(1-3):125–134.
Crossref
|
|
|
|
|
Fahrig L, Baudry J, Brotons L, Burel FG, Crist TO, Fuller RJ, Sirami C, Siriwardena GM, Martin JL (2011). Functional landscape heterogeneity and animal biodiversity in agricultural landscapes. Ecol. Lett., 14:100-111.
Crossref
|
|
|
|
|
Fischer J, Stott J, Zerger A, Warren G, Sherren K, Forrester RI (2009). Reversing a tree regeneration crisis in an endangered ecoregion. Proceedings of the National Academy of Sciences, 106(25):10386–10391.
Crossref
|
|
|
|
|
Government of Ghana (2011). Ghana riparian buffer zone policy for managing freshwater bodies. Ministry of Water Resources, Works and Housing.
|
|
|
|
|
Goetze DB, Hörsch B, Porembski S (2006). Dynamics of forest-savanna mosaics in north-eastern Ivory Coast from 1954 to 2002. J. Biogeogr., 33(4):653-664.
Crossref
|
|
|
|
|
Gray CL, Slade EM, Mann DJ, Lewis OT (2014). Do riparian reserves support dung beetle biodiversity and ecosystem services in oil palm-dominated tropical landscapes? Ecol. Evol., 4(7):1049-1060.
Crossref
|
|
|
|
|
Jamala GY, Jada MY, Yidau JJ, Joel L (2013). Socio-Economic Contribution of Shea Tree (Vitellaria paradoxa) in Support of Rural Livelihood in Ganye, Sourtheastern Adamawa State, Nigeria. J. Env. Sci., Toxi. F. Tech., 6(5):75-81.
|
|
|
|
|
Johansen K, Arroy LA, Armston J, Phinn S, Witte C (2010). Mapping riparian condition indicators in a sub-tropical savanna environment from discrete return LiDAR data using object-based image analysis. Ecol. Indic., 10:796-807.
Crossref
|
|
|
|
|
Kronborg M, Lykke A.M, Ilboudo JB, Hien M, Balslev H (2013). Parkia biglobasa as an economic resource for rural women in South Western Burkina Faso. WAJAE., 21(2):95-107.
|
|
|
|
|
Lykke AM (1998). Assessment of species composition change in savanna vegetation by means of woody plants' size class distributions and local information. Biodivers. Conserv., 7(10):1261–1275.
Crossref
|
|
|
|
|
Manning AD, Fischer J, Lindenmayer DB (2006). Scattered trees are keystone structures - implications for conservation. Biodivers. Conserv, 132(3):311–321.
Crossref
|
|
|
|
|
Morandin LA, Winston ML (2006). Pollinators provide economic incentive to preserve natural land in agroecosystems. Agric. Ecosyst. Environ., 116, 289–292.
Crossref
|
|
|
|
|
Morelli F (2013). Quantifying Effects of Spatial Heterogeneity of Farmlands on Bird Species Richness by Means of Similarity Index Pairwise. Int J Biodivers. Conserv., 914837:9.
|
|
|
|
|
McCracken DI, Cole LJ, Harrison W, Robertson D (2012). Improving the Farmland Biodiversity Value of Riparian Buffer Strips: Conflicts and Compromises. J. Environ. Qual., 41(2):355–63. Crossref
|
|
|
|
|
McKinney ML (2008). Effects of urbanization on species richness: a review of plants and animals. Urban Ecosyst., 11(2):161-176.
Crossref
|
|
|
|
|
Natta AK, Porembski S (2003). Ouémé and Comoé: forest-savanna border relationships in two riparian ecosystems in West Africa. Bot. Jahrb. Syst. Bph., 124(4):383-396. Natta AK, Sinsin B, van der Maesen LJG (2003). Riparian forests and biodiversity conservation in Benin (West Africa). Paper presented at the XII World Forestry Congress, organized by FAO in Quebec, Canada, September 21 to 28, 2003. pp 126-127.
Crossref
|
|
|
|
|
Noufou O, Wamtinga SR, André T, Christine B, Marius L, Emmanuelle HA, Jean K, Marie-Geneviève D, Pierre GI (2012). Pharmacological properties and related constituents of stem bark of Pterocarpus erinaceus Poir. (Fabaceae). Asian Pac. J. Trop. Dis., 5:46-51.
Crossref
|
|
|
|
|
Okiror P, Chono J, Nyamukuru A, Lwanga JS, Sasira P, Diogo P (2012). Variation in Woody Species Abundance and Distribution in and around Kibale National Park, Uganda. ISRN For. 490461.
Crossref
|
|
|
|
|
Potapov P, Laestadius L, Yaroshenko A, Turubanova S (2009). Measuring and assessing forest degradation. Global mapping and monitoring the extent of forest alteration: The intact forest landscapes method: Food and Agriculture Organization of the United Nations (FAO), Forest Resource Working Paper 166.
|
|
|
|
|
Ruelland D, Levavasseur F, Tribotte A (2010). Patterns and dynamics of land-cover changes since the 1960s over three experimental areas in Mali. Int. J. Appl. Earth Obs., 12:S11-S17.
Crossref
|
|
|
|
|
Sambare O, Bognounou F, Wittig R, Thiombiano A (2011). Woody species composition, diversity and structure of riparian forests of four watercourses types in Burkina Faso. J. For. Res., 22(2):145-158.
Crossref
|
|
|
|
|
Schetter TA, Root KV (2011). Assessing an imperiled Oak savanna landscape in Northwestern Ohio using Landsat Data. Nat. Area. J., 31(2):118-130. http://dx.doi.org/10.3375/043.031.0204
Crossref
|
|
|
|
|
Scherer-Lorenzen M, Korner C, Schulze ED (eds.). (2005). Forest diversity and function: temperate and boreal systems. Springer, Berlin.
Crossref
|
|
|
|
|
Shannon CE (1948). A mathematical theory of communication, Part 1. Bell Syst. Tech. J., 27(3): 379–423.
Crossref
|
|
|
|
|
Simpson EH (1949). Measurement of diversity. Nature 163, 688. http://dx.doi.org/10.1038/163688a0
Crossref
|
|
|
|
|
Soetaert K, Help C (1990). Sample-size dependence of diversity indices and the determination of sufficient sample size in a high-diversity deep-sea environment. Mar. Ecol. Prog. Ser., 59:305-307.
Crossref
|
|
|
|
|
Surasinghe TD, Baldwin RF (2015). Importance of Riparian Forest Buffers in Conservation of Stream Biodiversity: Responses to Land Uses by Stream-Associated Salamanders across Two Southeastern Temperate Ecoregions. J. Herpetol., 49(1):83-94.
Crossref
|
|
|
|
|
Schweiger EW, Ashton IW, Muhlfeld CC, Jones LA, Bahls LL (2011). The distribution and abundance of a nuisance native alga, Didymosphen Didymosphenia geminata, in streams of Glacier National Park: Climate drivers and management implications. J. Park, 28:2
|
|
|
|
|
Tom-Dery D, Hinneh P, Asante WJ (2013). Biodiversity in Kenikeni Forest Reserve of Northern Ghana. Afr. J. Agric. Res., 8(46):5896-5904.
|
|
|
|
|
Traoré L, Ouédraogo A, Thiombiano A (2012). To What Extent Do Protected Areas Determine the Conservation of Native Flora? A Case Study in the Sudanian Zone of Burkina Faso. ISRN Bot, 168196:10.
Crossref
|
|
|
|
|
Volta Basin Authority Geoportal (2000). Land cover in the Volta Basin area. Retrieved from http://131.220.109.2/geonetwork/srv/en/main.home on 21 November, 2014.
|
|
|
|
|
Wakirwa JH, Yawate UE, Zakama SG, Muazu J, Madu SJ (2013). Phytochemical and antibacterial screening of the methanol leaf extract of Mitragyna inermis (Wild O. Ktze Rubiaceae). Int. J. Pharma. Res., 6:1-6.
|
|
|
|
|
Zeide B (2005). How to measure stand density. Trees-Struct. Funct., 19: 1-14.
|
|