ABSTRACT
Climate, fire and herbivory rank among the key factors and processes shaping savanna woodland community composition and diversity. We analyzed recruitment dynamics, community biomass, diversity, stability and composition and their relationships with rainfall fluctuations and herbivory in a savanna woodland community in the Masai Mara National Reserve of Kenya. Seedling and sapling recruitment varied differentially over time among the five commonest tree species. Rainfall exerted both positive and negative effects on recruitment dynamics, with saplings responding to longer rainfall lags than seedlings. The proportion of trees damaged by browsers peaked at intermediate rainfall levels and was higher for adults than seedlings or saplings. Community biomass, species richness and evenness increased with increasing rainfall. Biomass decreased, whereas richness and evenness hardly varied over time. Both rare and common species occurred in more diverse communities, prevalent at high rainfall locations, suggesting strong nestedness in community composition. Moreover, community stability and diversity appeared unrelated. Protection from browsers and lower per capita browsing pressure at high rainfall apparently enable rare species to successfully establish and elevate species diversity. If climate change makes droughts more frequent and intense and lowers soil moisture, browsing intensity could increase, reducing diversity and recruitment, especially of rare, stress-sensitive species.
Key words: Masai Mara, species diversity, habitat filtering, rainfall, browsing, fire, competition, stochastic processes, tree biomass.
A central goal in ecology is understanding the operation of processes that shape the structure and dynamics of vegetation communities (Diamond, 1975; Weiher et al., 1998; McGill et al., 2006). Three generic ecological processes that contribute to structuring of plant communities include competition, habitat filtering, and stochastic processes. Processes proposed as key drivers of vegetation community structure and dynamics therefore fall into three broad categories that: (1) emphasize the fundamental role of competitive interactions (Tilman, 1982), (2) focus on habitat filtering and thus restrict species numbers (O'Connor, 1995; Shipley et al., 2011), and (3) focus on the balance between colonization and extinction processes, commonly designated as stochasticity (Hubbell, 2001; Chase and Leibold, 2003; Hubbell, 2005). Although the relative importance of these processes in shaping vegetation communities and modulating the relationship between rainfall and plant community biomass, diversity, stability and composition is likely to vary in space and time; relatively little work has examined this variation in tropical African savannas using long-term monitoring data (Ozinga et al., 2005; Adler and Levine, 2007).
Tropical savannas rank among the most widespread terrestrial biomes, covering some 20% of the earth’s land surface area (Ozinga et al., 2005; Adler and Levine, 2007; Chape et al., 2008). African savannas are typified by a continuous grass layer, scattered closed thickets of a diverse range of shrubs and Acacia woodlands and occur in climates with strongly seasonal rainfall patterns (Walker, 1987). As with many African savanna habitat types, closed thickets often occur in riparian areas and on hilltops and consist of diverse and dense patches of woody species. They add spatial heterogeneity to the ecosystem by producing taller and longer-lived landscape elements (Belsky, 1994). These woody thickets represent important and reliable habitats for many browsing herbivores, especially during dry periods (Oloo et al., 1994; Dublin, 1995).
Rainfall is the primary climatic component controlling the recruitment dynamics of savanna vegetation communities (Harper, 1977; Holmgren et al., 2006; Zimmermann et al., 2009). Increasing rainfall generally leads to longer periods with high soil moisture necessary for successful germination of tree seedlings, their establishment and recruitment into sapling and adult stages (O'Connor, 1995), and hence to the long-term survival and establishment of plant populations. Furthermore, high rainfall leads to higher biomass production with profound consequences for plant species diversity (Hutchinson, 1959; Rosenzweig, 1995), stability (McNaughton, 1977; Tilman, 1994) and composition (Ozinga et al., 2005; Silvertown et al., 1994). The trend of rising temperatures, recurrent severe droughts and other environmental stresses (e.g., frequent fires, intense herbivory and habitat deterioration) in African savannas imply that the survival prospects of species in particular communities depend most strongly upon their relative recruitment and competitive abilities, resistance and resilience to the environmental changes (Virginia and Wall, 2001).
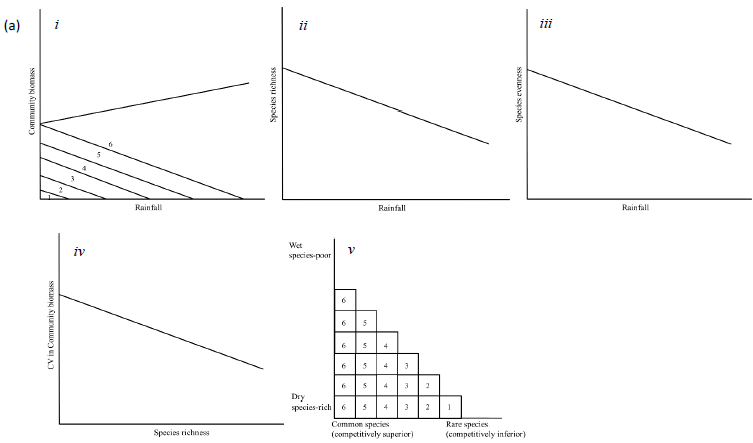
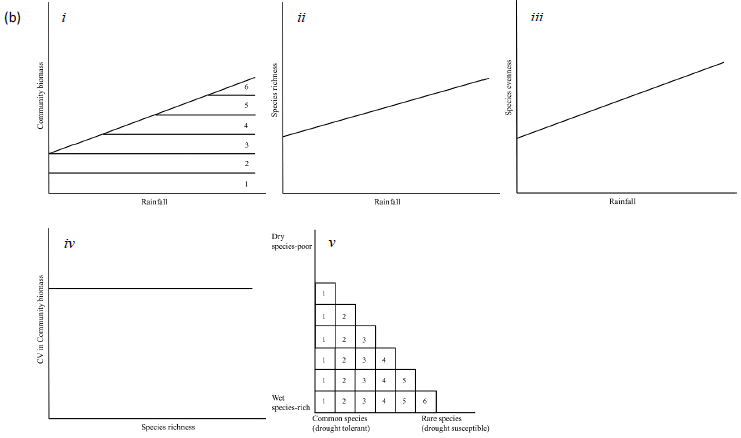
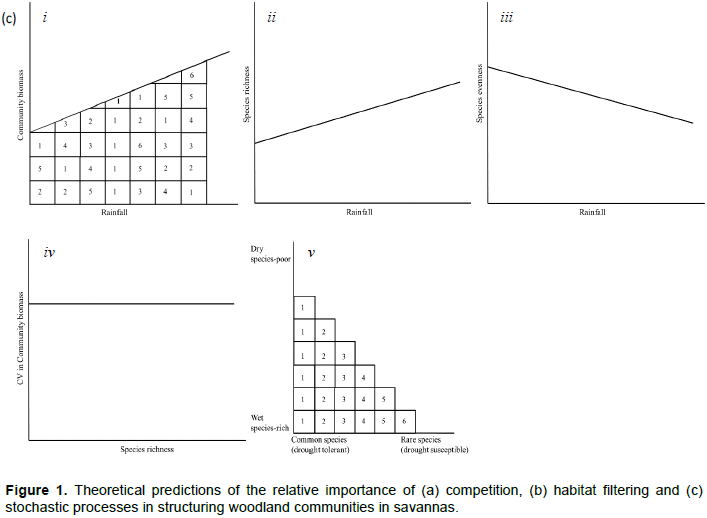
Seedling and sapling recruitment rates should be correlated with variation in rainfall, the major source of soil moisture for plants in African savannas (O'Connor, 1995). To establish the functional forms of the relationships between seedling and sapling recruitment and the rainfall components most strongly correlated with the recruitment rates, we explore if seedling and sapling recruitment rates: (1) increase (or decrease) linearly with increasing rainfall, or 2) peak at intermediate levels of rainfall, if rainfall extremes reduce habitat suitability for juvenile recruitment. As saplings are older and have roots able to access deeper underground soil moisture than seedlings, sapling recruitment should be influenced less by short-term rainfall and should respond to past rainfall accumulated over longer periods than seedling recruitment due to carryover (or delayed) effects of prior habitat conditions. As well, if increasing rainfall is associated with increased vegetation biomass for mixed grazer/browsers (Coe et al., 1976; Deshmukh, 1986), such as elephants (Loxodonta africana) and impala (Aepyceros melampus), then the proportion of young plants damaged by browsers should decrease with increasing rainfall. However, the amount of this decrease should be higher for seedlings than saplings or adults because of the high palatability of seedlings (Sharam et al., 2006). Increasing rainfall generally leads to higher biomass and dominance of particular species, resulting in differential competitive exclusion, if competition for resources enables species with stronger competitive abilities to outperform (e.g., become taller than) less competitive species (Zimmermann et al., 2009). This would result in low species richness and evenness in wetter areas (Figure 1a). Alternatively, if species richness increases with increasing rainfall, then competition is less likely to be important in structuring plant communities and alternative processes are more likely to be at play. If species are limited by stress or disturbances (e.g., drought, herbivory, or fire) then richness and evenness should increase with increasing rainfall (Figure 1b) (Augustine and McNaughton, 1998; Walker et al., 2006). Stochastic processes may also lead to a positive relationship between species richness and rainfall. If the total abundance of all trees is likely to increase with rainfall, so are the abundances of the individual constituent species, thus reducing the chances of random extinctions because any dying individual could be randomly replaced by an immigrant from the community (Alonso et al., 2006). Hence, a positive relationship between rainfall and richness (Figure 1c) may imply an important role for stochastic processes. Furthermore, a decrease in evenness can be expected if stochastic processes are more important in determining community structure because, as biomass is likely to increase at higher rainfall, so is the dominance of more productive species (Huston, 1997).
If the stability of communities increases with diversity, this could be interpreted as suggesting an important role for competition (Figure 1a) (Tilman, 1994; Tilman et al., 2006). Under changing environmental conditions or disturbances the loss of one species can be compensated for by other co-existing species (Tilman, 1996) independently of the abiotic conditions. Alternatively, if diversity and stability are unrelated, this can be viewed as signalling habitat filtering or stochastic processes (Figure 1a and b).
Furthermore, community composition, expressed in terms of nestedness (Wright and Reeves, 1992; Wright et al., 1997), measures whether relatively rare species tend to be confined to areas where common species are also present. If low rainfall areas are the most species rich, with both common and rare species, while wet areas only allow common, competitively superior species, then a nested pattern could be viewed as a sign of reduced competition in dry areas, but high competition in wet areas (Figure 1a) (Hutchinson, 1959; Grime, 1997). Alternatively, high nestedness may result from habitat filtering, with only favourable, wet areas allowing both common, drought tolerant, and rare, drought intolerant species (Figure 1b) (Adler and Levine, 2007; Keddy, 1992). Nestedness could also be the outcome of the dynamics of random extinction and colonization processes, where most diverse communities are those with the highest biomass (Figure 1c).
Here, we analyze the influences of rainfall and large browsing herbivores on woodland (Croton thickets) community structure and recruitment dynamics using long-term monitoring data on tree recruitment, biomass, diversity, composition and stability patterns in woodlands arranged along a rainfall gradient in a premier African savanna, namely the Mara-Serengeti ecosystem. Specifically, we analyze the dynamics of tree seedling and sapling recruitment and tree damage by large browsing herbivores and the spatial relationships between rainfall and (i) tree community biomass, (ii) species richness, (iii) evenness, (iv) stability and (v) composition. We use the resultant insights to infer and interpret savanna woodland community structure and recruitment dynamics.
Study area
The study was conducted in the Masai Mara National Reserve (MMNR), a premier protected area covering some 1530 km2 in south-western Kenya and the northernmost section of the Greater Mara-Serengeti ecosystem covering some 40,000 km2. The ecosystem is delineated by annual migratory movements of wildebeest (Connochaetes taurinus), zebra (Equus quagga burcheli), Thomson’s gazelle (Gazella thomsoni) and eland (Taurotragus oryx) from the Serengeti plains in the south and Masai pastoral ranches to the north-east. The reserve is a dry season refuge for both migratory and resident herbivores (Dublin et al., 1990a); whereas, the adjoining pastoral ranches and wildlife conservancies support vast herds of livestock and a diverse assemblage of resident large wild herbivores (Stellfox et al., 1986). The MMNR and its neighbouring pastoral ranches and wildlife conservancies constitute the Mara region. Rainfall in the Mara region is bimodal with “short” rains falling during November–December and “long” rains during March–June. The dry season spans July–October, but January-February is also often dry. Rainfall in the Mara-Serengeti ecosystem increases along a southeast-northwest gradient and with increasing altitude; and averages less than 600 mm in the southeast in Tanzania and over 1200 mm in the northwest of the Mara region (Pennycuick and Norton-Griffiths, 1976). Mean temperature levels have been rising in the Mara region in recent decades, a trend associated with progressive habitat desiccation (Ogutu et al., 2008a). The MMNR also experiences recurrent severe droughts, the most noteworthy during the study period (1989–2003) being in 1993 and 1999-2000 (Ogutu et al., 2008a).
Rainfall measurements
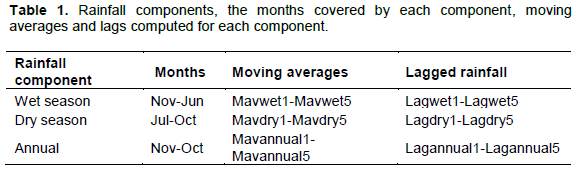
Monthly rainfall data were collected from a network of 58 rain gauges distributed over the entire Mara-Serengeti ecosystem by the Serengeti Ecological Monitoring Program and the Masai Mara Ecological Monitoring Program during 1985-2003 (Coughenour, 2006). Of these 58 gauges, 43 were located in the Serengeti; whereas, the remaining 15 were located in the Mara Reserve. We used spatially interpolated monthly mean and annual precipitation over the entire ecosystem at a spatial resolution of 1 × 1 km2 using the PPTMAP computer program described in detail by (Reed et al., 2009). We associated each vegetation sampling plot in the MMNR with the interpolated monthly rainfall for the grid cell in which the plot fell based on the 1985-2003 rainfall measurements. Rainfall was summarized into wet (November-June) and dry (July-October) season and annual (November-October) components because the climatic year begins in November of the current year and ends in October of the following year. We derived seasonal and annual rainfall lags and moving averages spanning periods of 1 to 5 years before the sampling year to evaluate the influence of delayed and cumulative past rainfall on seedling and sapling recruitment dynamics. The 5-year period was selected to match the 5-year quasi-periodic oscillation evident in the regional rainfall and the associated changes in vegetation state (Ogutu et al., 2008a). Table 1 summarizes the specific rainfall components, lagged and moving averages considered.
Sampling design and monitoring
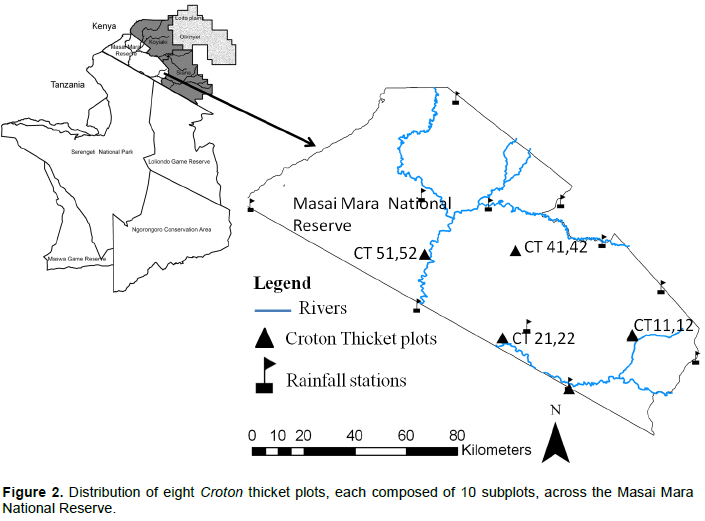
The study is based on biennial vegetation monitoring data collected by the Masai Mara Ecological Monitoring Program over a 15-year period spanning 1989–2003 in Kenya’s Masai Mara National Reserve. The Masai Mara Ecological Monitoring Program (MMEMP) established four pairs of Croton thicket plots at four sites in the MMNR in 1989 (Dublin, 1991). Each site had two replicate plots running parallel to each other and located 100 m apart. Hence, there were a total of 8 croton thicket plots in the entire MMNR. Each of the 8 plots was 100 m long and 20 m wide (2000 m²) and was subdivided into 10 subplots each measuring 10 m by 20 m or 200 m². Records from all the 10 subplots per plot were combined into one set of plot data for analysis. The 8 plots were selected to represent the dominant croton woodland habitats and were oriented along a southeast-northwest gradient. The plots were arrayed along a rainfall gradient covering the full length and breadth of the MMNR (Figure 2). Metal rods driven into the ground were used to mark the boundaries of each plot. The dominant species in Croton thickets consist of the fire-tolerant shrubs Croton dichogamus, Euclea divinorum, Grewia similis and Tarenna graveolens interspersed with Acacia species such as A. gerradii and 53 relatively rare species (S1 Data). Each of the eight plots was sampled eight times during the 1989-2003 monitoring period, specifically in 1990, 1991, 1992, 1993, 1995, 1998, 2002 and 2003, when the monitoring program ended. Sampling a single plot took two people one week to complete, on average; with a sampling day starting at 0700-0730 h and ending at 1700 h. The total of 8 plots thus took a total of 40 days to sample. The plots were accessed by vehicle, or on foot, using a global positioning system (GPS; S2 Data). Plots were not fenced and hence were open to all grazers and browsers because of the high risk of fence damage by elephants. Over the course of the monitoring period, a total of four field staff carried out the same sampling procedure in each plot to ensure comparability of the long-term vegetation samples. All the field staff were thoroughly trained in vegetation sampling, identification of plant species and data recording before carrying out field sampling to ensure consistency. All trees and shrubs with stem diameters 10 cm or larger were measured using a standard diameter tape and identified following Beentje (1994). Measurements of stem diameter were taken at 10 cm above the ground, rather than at breast height because of the diminutive stature of most of the trees in the woodland communities and to take care of the seedlings, saplings and natural regeneration. Additional measurements recorded for each tree were height, degree of browsing and extent of fire damage as detailed below for each attribute.
Most savanna tree species are strong resprouters and therefore poor recruiters, making size an imperfect indicator of tree age in savannas; a short individual may be ancient and may have survived many bouts of drought, herbivory or fire. Therefore, we carefully examined all saplings to accurately determine whether they were new or transitioning seedlings. Similarly, we used knowledge of tree growth rates to determine whether seedlings were regressed saplings (after drought or herbivory).
As a result, the monitoring program devised and implemented an elaborate procedure to accurately distinguish resprouters from seedlings and saplings and new saplings from transitioning seedlings in the field. Resprouters were distinguished from seedlings or saplings in the field as follows. Resprouts have browsing (e.g., from bark stripping) or fire scars on the leading shoot or its branches. Resprouters have a mature stem with a thick and mature bark particularly at the base, just above the ground level, which is lacking in seedlings or saplings. Resprouters also have high branching of the tree stem, particularly from the area it was browsed compared to new seedlings or saplings. Moreover, virtually all the tree species are indigenous and grow very slowly in terms of the mean annual increment (MAI). We thus used knowledge of the tree species’ MAI, to help differentiate resprouters from seedlings and saplings. Lastly, we checked earlier records for each of the subplots, typically from the last sampling session, to establish if a particular tree had appeared in the earlier records to help distinguish resprouters from seedlings or saplings. Resprouters but not seedlings or saplings should appear in the past records. If a tree belonged to the same species that had dominated a subplot in the previous records, then we used its size to determine if it is a resprouting tree, seedling or sapling.
Height
Tree height (in cm) was assumed to be the height of the main tree crown and was measured using a regular measuring tape. Individual plants of the five major dominant species within each plot were measured and assigned to one of three height classes: seedlings < 0.6 m, saplings > 0.6 but < 1.50 m and adults > 1.50 m. These height classes overlap the mean browsing heights for the common large browsing species in the study area (Dublin et al., 1990b). The sapling height category represents the mean browsing height of resident antelope browsers primarily involved in woodland dynamics in the Mara-Serengeti, including dik dik (Rhynchotragus kirki), Grant’s gazelle (Gazella granti) and impala (Dublin, 1991). Elephant and giraffe (Giraffa camelopardalis) largely browse on trees taller than 1.5 m in both Croton thickets and Acacia woodlands; whereas, fires affect all trees shorter than 3 m (Dublin et al., 1990a).
Browsing and fire damage
Individual trees were categorized into either “damaged” or “not damaged” classes. Trees were classified as damaged using combinations of browsing characteristics, such as bark stripping, branch clipping, branch breakage and branch toppling. Elephants and other browsers promote seed dispersal (Dublin, 1986), but elephants also destroy trees. An average of about 1000 elephants used the Mara Reserve and this number varied little during the monitoring period (Dublin and Douglasâ€Hamilton, 1987; Ogutu et al., 2011). Fires were frequent in the MMNR during the monitoring period that spanned the longest El Niño episode on instrumental record up to 2003 (Ogutu et al., 2008a; Green et al., 2015). The fires reduce seed germination and increase seedling death but can also break dormancy and improve seed germination for some species. Trees damaged by fire were categorized using fire scars on the barks, or branches. From 1991 to 2003, the MMNR management restricted burning largely to the short dry season (January-February), when grass biomass and combustibility is low due to high moisture content, making fires less damaging. Fire scars, therefore, became extremely rare in both Croton and Acacia woodlands and had little influence on recruitment. The number of trees damaged by elephants and fire were summed together for each age class prior to analysis.
Community biomass index
We estimated the basal area (in m²) as , where is the stem diameter. We then estimated the parabolic volume (in m³) of the individual trees as the basal area x height / 2. We then averaged the parabolic volume over all individuals within each plot in each sampling year to obtain an index for total community biomass. We also calculated a community-level stability index ( ), as the standard deviation divided by the mean community biomass (coefficient of variation) for each plot over the entire monitoring period as well as for each year across all the plots. A community is regarded as “stable” if is equal to 1 and unstable if is equal to 0 (Pimm, 1984).
Species’ richness, evenness and nestedness
Species richness was determined by the total number of different species; whereas, species evenness (Pielou, 1977) was calculated as diversity/ln (richness), where diversity is calculated using the Shannon-Weaver Diversity index (Shannon and Weaver, 1949). We estimated an index of nestedness for the species presence/ absence matrix as a measure of community composition (Wright and Reeves, 1992).
Statistical analysis
We first describe temporal patterns in recruitment rates for the five woody species constituting major dominants in Croton thickets and then relate the patterns to temporal fluctuations in rainfall and herbivory. More precisely, we analyze the seedling (number of saplings /number of seedlings) and sapling (number of adults /number of saplings) recruitment dynamics and evaluate the relative influence of past rainfall accumulated over periods spanning 1 to 5 years. We also analyze relationships between plant community biomass, diversity, stability and composition and spatial variation in rainfall and use them as proxies for inferring the relative importance of the three generic processes structuring savanna woodland communities along the rainfall gradient.
Modeling temporal trends in recruitment
Statistical analysis aimed to establish whether climate, herbivores, antecedent conditions indexed by rainfall lags or cumulative past rainfall or their interactions were primarily responsible for the patterns we uncovered. Modeling temporal changes in the seedling and sapling recruitment rates for individual species requires a model able to accommodate non-normality, non-constant variance of the counts, missing values and many zero counts. We thus analyzed temporal trends in the seedling and sapling recruitment rates using a generalized linear model assuming a negative binomial error distribution for the counts and a log link function to satisfy these requirements. The model incorporated year as a categorical fixed effect. The expected seedling recruitment rate was calculated as the number of saplings summed across all plots, which we used as the response variable, offset by the logarithm of the number of seedlings summed across all the eight plots. Similarly, the expected sapling recruitment rate was calculated as the number of adults summed across all plots (response variable) offset by the logarithm of the number of saplings. The model assumed that missing counts were missing at random (Ozinga et al., 2005) and hence ignorable. The models were fit using the package MASS version 7.3-8 in the R Software (R Development Core Team, 2010). The scale and overdispersion parameters of the negative binomial model were estimated automatically by the procedure.
Modeling relationship between recruitment and rainfall
We regressed recruitment rates for each of the four dominant species on each of the 30 derived rainfall components to identify the components most strongly correlated with the rates and the functional forms of the relationships. To establish the functional form of the relationship between recruitment and rainfall, each expected recruitment rate was related to each of the 30 rainfall components r using the following three generalized linear models (Ogutu et al., 2008b):
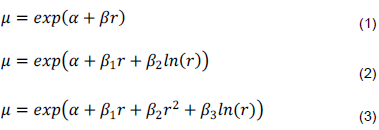
where is the intercept and to are regression slopes. We use these models to test if seedling and sapling recruitment rates (1) increase or decrease linearly with increasing rainfall or (2) peak at intermediate levels of rainfall. We also test if sapling recruitment rates are influenced less by rainfall and respond to rainfall accumulated over longer periods than seedling recruitment due to carryover effects of prior rainfall. We use the corrected Akaike Information Criterion (AICc) (Burnham and Anderson, 2002), to select both the best model and rainfall component most strongly correlated with recruitment rates for each species (S1 Table). The models were also fitted using negative binomial regression in the package MASS version 7.3-8 of the R Software (R Development Core Team, 2010).
Modeling trends in, and relationships between, browsing damage and rainfall
We first modelled temporal trends in the age class-specific proportions of individual trees of each species damaged by browsers across all plots. We then related these proportions to each of the 30 seasonal and annual rainfall components and their lagged and moving average components to identify the components most strongly correlated with the rates for each species using AICc (S2 Table). We modelled the proportion of damaged seedlings by specifying the number of damaged seedlings as the response variable and the logarithm of the total number of seedlings as the offset variable in the negative binomial regressions. We similarly modelled the proportion of damaged saplings and adults. The models were also fitted in the MASS package version 7.3-8 in the R Software (R Development Core Team, 2010). Differences in the expected proportion damaged between years were tested using the Wald chi-squared test (Draper and Smith, 1998).
Temporal variation in community biomass
We calculated the total community biomass of all trees averaged over all plots in each year. We then analyzed temporal trends in community biomass using linear regression analyses. The biomass was the response variable; whereas, the year of vegetation sampling was incorporated in the models as a fixed effect. To assess changes in community biomass in response to rainfall, we regressed the total community biomass of all trees over all plots on each of the 30 rainfall components assuming normal errors and an identity link. We used AICc in R version 2.12.0 (R Development Core Team, 2010), to select both the best model and rainfall component most strongly correlated with biomass (S3 Table). We tested for temporal trends in species richness and evenness using the same statistical approach as for biomass and regressed these against the various rainfall components.
Spatial variation in species diversity, stability and nestedness
To characterize the spatial patterns in species richness and evenness we summed the total number of different coexisting species and calculated the relative abundance of each species to the total abundance in each plot and averaged them over the monitoring period. We evaluated spatial patterns in species richness (the number of species) and evenness (a measure of the equitability of the proportional abundances of species) in each plot by averaging them over the monitoring period. The relationships between species richness and evenness and rainfall were analyzed using the standard normal-theory linear regressions. Again, AICc was used to identify the best model and the rainfall component having the strongest correlation with richness and evenness (S3 Table). The models were also fit using a linear regression assuming normality of errors and an identity link. We determined community stability using all the data collected biennially on woody vegetation biomass within each plot during 1989-2003. To evaluate the relationship between community stability and richness, we calculated stability in community biomass ( ) as (i.e., coefficient of variation) where is the standard deviation and is the mean biomass in a given plot during 1989-2003. We used linear regression analyses to evaluate temporal variation in community-level stability between plots of varying richness. The models, incorporating richness as a continuous covariate, were also fit assuming normality and an identity link.
We estimated an index of nestedness of the species presence/absence matrix using the ‘binmatnest’ algorithm of (Rodríguez-Gironés and Santamaría, 2006), implemented in the ‘bipartite’ R package (Dormann et al., 2008) to characterize how species are distributed among all the plots. The tree data from all the survey years (1989-2003) were used to construct a species presence-absence matrix. This procedure followed a three-step process: first, the matrix is reorganized by arranging rows (plots) and columns (species) from full (species presence) to empty (species absence) cells. Second, to maximize nestedness the full cells are mainly located in the upper-left corner and empty cells are mainly located in the lower right corner. An isocline for this matrix of perfect nestedness is calculated. Third, for the reorganized, presence-absence matrix, full cells above the isocline and empty cells below the isocline were identified and a normalized sum of their distances to the isocline calculated, in such a way that it ranged from 0 (no deviation and therefore perfect nestedness) to 100 (maximum deviation and therefore perfect ‘un-nestedness’). This normalized deviation measure of an observed matrix from a perfectly nested matrix is called the ‘nestedness temperature’ with low values indicating high nestedness. More details on this procedure can be found in Rodríguez-Gironés and Santamaría (2006). To test whether the observed nestedness was higher or lower than that expected by chance, we used a null model developed for a permutation test by (Bascompte et al., 2003). The test involves creating new random matrices of the same size as the observed matrix. The probability of each cell in these matrices being filled is the average of the probability of filling each of its associated rows ( = 8 plots) and columns ( = 70 species). This type of null model is relatively conservative, but is less vulnerable to type II errors (Rodríguez-Gironés and Santamaría, 2006; Cottenie, 2005). We ran the null model with 1000 permutations as implemented in the ‘bipartite’ package.
Temporal trends in rainfall and temperature
The period 1989–2003 was one of the hottest recorded since the 1960s (Ogutu et al., 2008a), implying that climatic variation was likely a major factor in vegetation recruitment dynamics. In particular, the study period was characterized by recurrent severe (1993, 1997 and 1999-2000) and mild (1991 and 1994) droughts and exceptional floods (1997-1998) associated with the longest (1990-1995) and strongest (1997-1998) El Niño Southern-Oscillation (ENSO) episodes on instrumental record up to 2003. The cumulative dry season rainfall component was largely below average from 1980s to 2003 implying reduced vegetation production and quality in the savanna grasslands (Ogutu et al., 2008a). More detailed descriptions of the temporal climatic patterns are presented elsewhere (Ogutu et al., 2008a).
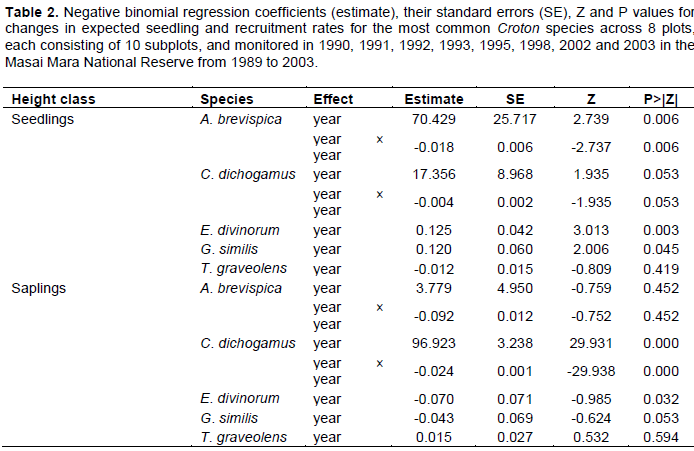
Trends in recruitment rates
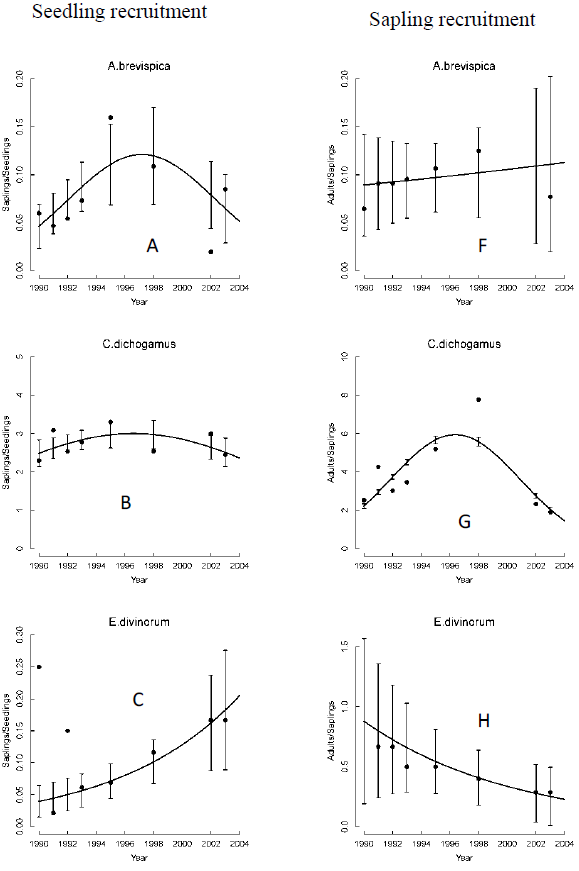
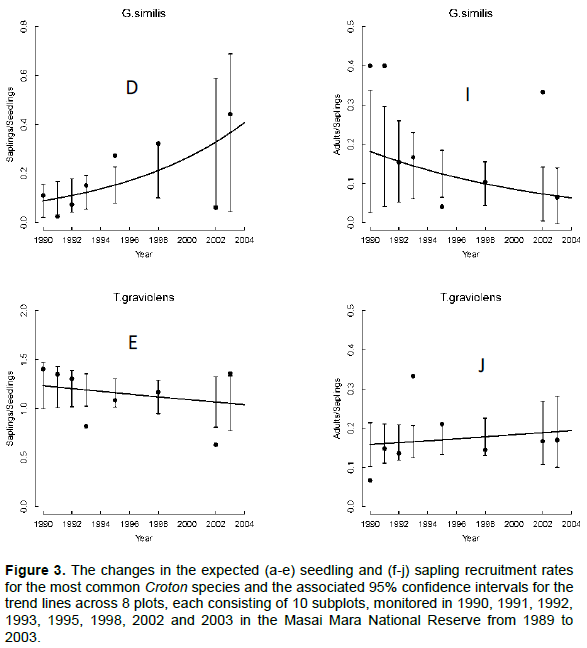
The seedling recruitment rate for all species but T. graveolens varied significantly across years. Recruitment rates for E. divinorum and G. similis increased exponentially; whereas, the rates for A. brevispica and C. dichogamus increased from 1990 to a peak during the El Niño floods of 1997/98 and then declined consistently soon after (Figure 3A-E, Table 2). These recruitment rates were low at the onset of the longest recorded ENSO episode (1990-1995) and the 1999-2000 ENSO drought (Ogutu et al., 2008a), revealing the adverse effect of low rainfall conditions on seedling recruitment. The sapling recruitment rates for all the species but A. brevispica and T. graveolens decreased significantly across years (Figure 3F-J, Table 2). Sapling recruitment rates for C. dichogamus showed a similar trend to that of the seedlings.
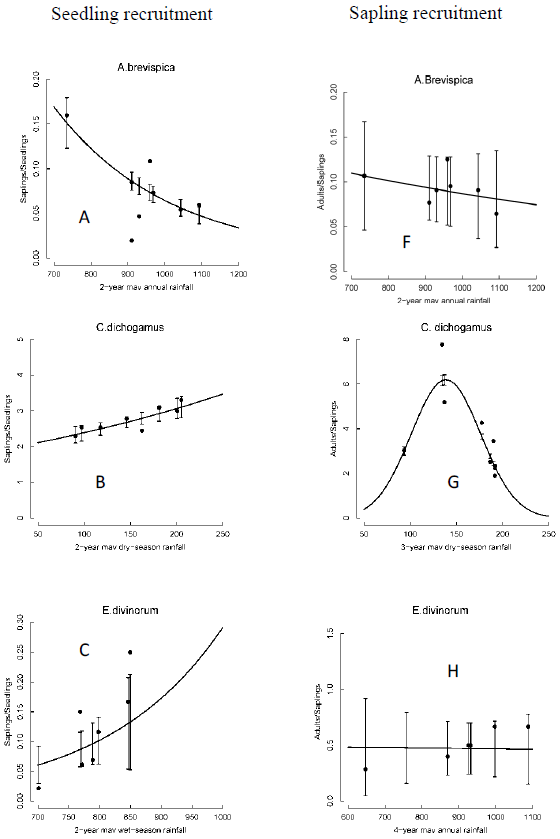
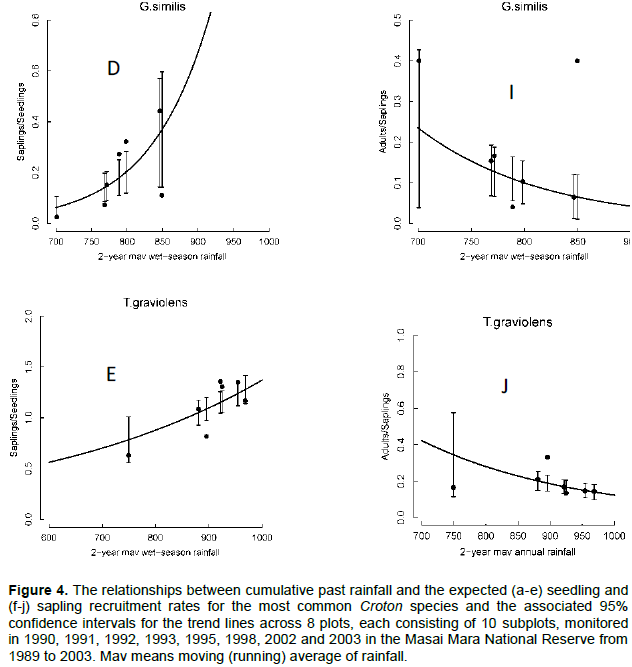
Relationships between recruitment rate and rainfall
The recruitment rates for seedlings of all species varied significantly with rainfall. In particular, the rates for all the five dominant species but A. brevispica increased exponentially with increasing rainfall. Seedling recruitment rates for E. divinorum and G. similis increased with increasing 2-year running mean of the wet season rainfall component; whereas, the rates for C. dichogamus and T. graveolens increased with the 2-year running mean of the dry season and annual rainfall components (Figure 4A-E, Table 3). In contrast, the recruitment rates for saplings of all the dominant species but C. dichogamus and G. similis did not vary significantly with increasing rainfall. The recruitment rate for C. dichogamus saplings showed a humped relationship with the 3-year running mean of the dry season rainfall, increasing initially up to a peak at about 150 mm of rainfall and then decreasing with further increase in rainfall (Figure 4F-J, Table 3).
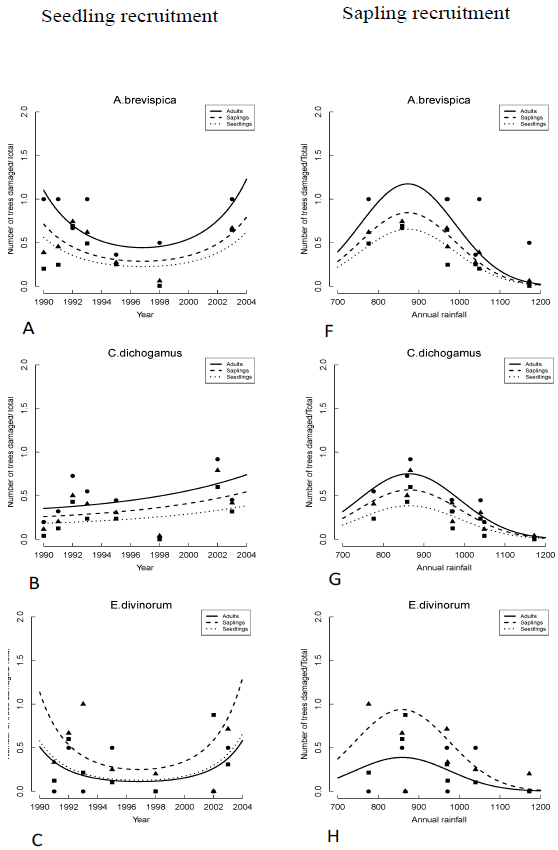
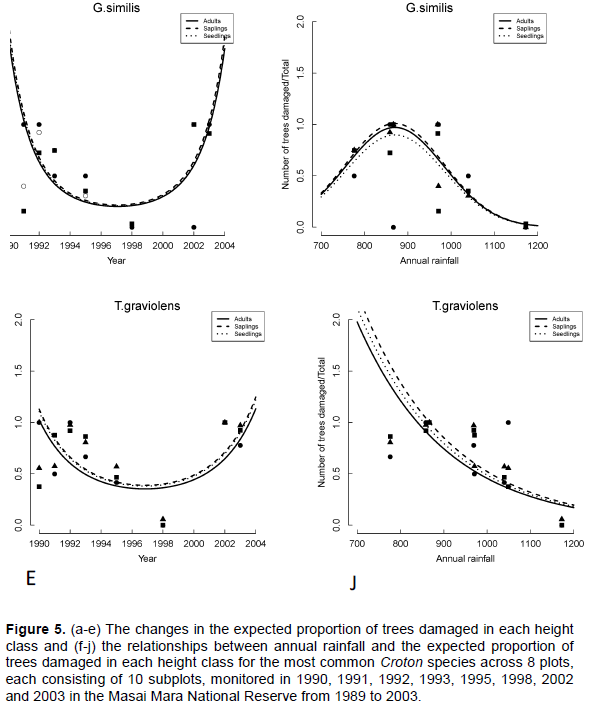
Trends in the proportion of trees damaged by browsers
Trends in the proportion of damaged trees in the Croton habitats for all the five dominant species but C. dichogamus varied significantly between years (Table 4). The proportion of damaged trees in all height classes was highest during the early 1990s, decreased steeply until the exceptional El Niño rains of 1997/1998 and then increased sharply thereafter (Figure 5A-E). The proportions of damaged trees were highest at the early stages of the longest recorded ENSO episode (1990-1995) and following the extreme 1999-2000 La Niña drought. The proportions of damaged adult A. brevispica and C. dichogamus trees were significantly higher than the corresponding proportions for their saplings and seedlings throughout 1989-2003 (Figure 5A-E, Table 4). For E. divinorum and T. graveolens, in contrast, saplings and seedlings suffered significantly greater damage than the adults did; whereas, for G. similis the proportions of damaged trees were comparable across all the three age classes during the monitoring period (Figure 5A-E, Table 4).
Relationships between browsing damage and rainfall
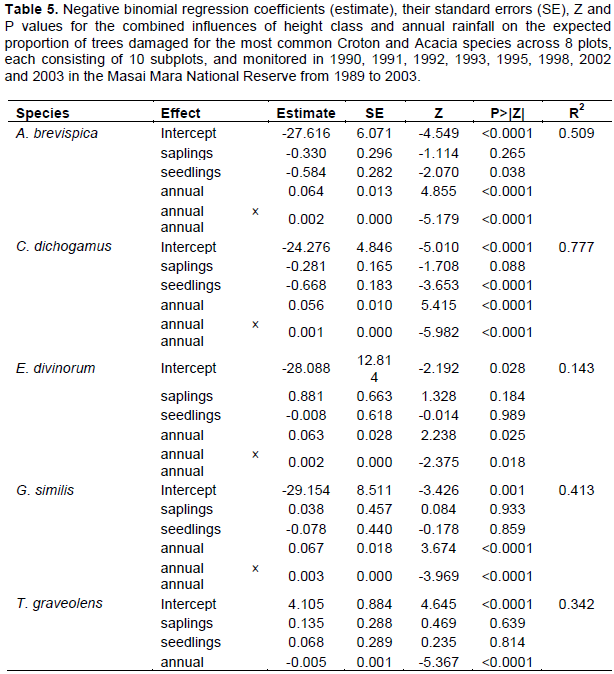
The proportions of damaged trees showed humped relationships with the annual rainfall component for all the five dominant species and peaked at intermediate values of rainfall before decreasing with further increase in rainfall except for T. graveolens for which the proportion of damaged individuals decreased exponentially with increasing rainfall (Figure 5F-4J, Table 5).
Temporal variation in community biomass, richness, evenness and stability
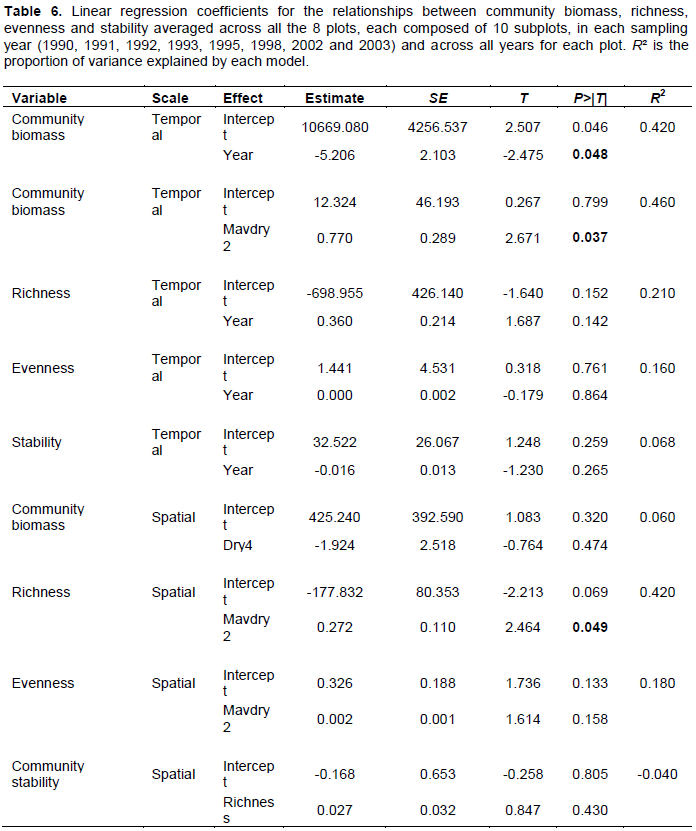
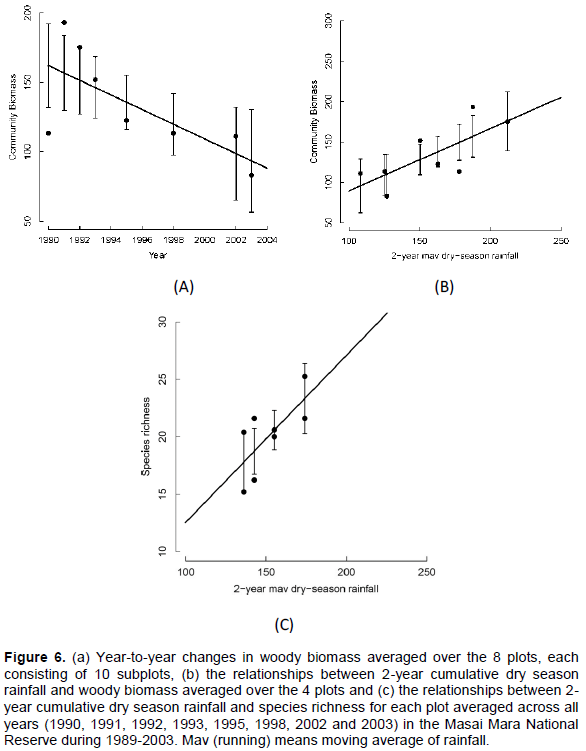
Community biomass over the entire landscape declined consistently over the monitoring period (Figure 6A) but increased linearly with the 2-year cumulative moving average of the dry season rainfall (Figure 6B, Table 6). However, species richness and evenness and community stability were apparently temporally stable (Table 6).
Spatial variation in community biomass, richness, evenness, stability and nestedness
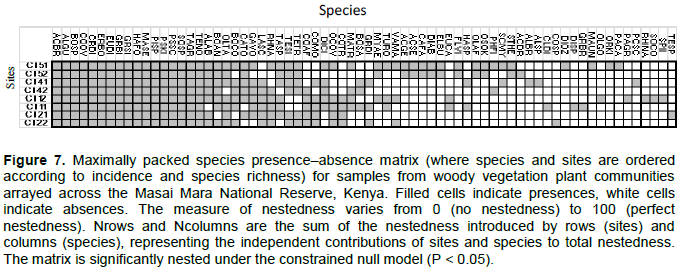
Average woody biomass per plot did not vary significantly with any rainfall component. However, species richness per plot increased up the rainfall gradient and also increased strongly with the 2-year cumulative moving average of the dry season rainfall (Figure 6C, Table 6). In contrast, the average species evenness per plot was not significantly related to rainfall (Table 6). The coefficient of variation of biomass (stability index) for each plot was not significantly correlated with richness (Table 6). The average (± 1SE) “nestedness temperature” of the randomized communities was 49.254 ± 11.325. The observed nestedness temperature was 34.50 and was significantly (P < 0.05) lower than that expected for randomly assembled communities, indicating that species composition was significantly more nested than expected by chance alone (Figure 7).
We examined variation in a range of structural and demographic variables (tree recruitment, damage, species diversity, community biomass) over time and in relation to rainfall and community nestedness.
Recruitment trends and relationship with rainfall
We found significant year-to-year variation in recruitment patterns during 1989-2003. Specifically, seedling and sapling recruitment rates for the dominant species varied over time following contrasting patterns, with some species first increasing up to a peak in 1997/1998 and then decreasing thereafter (A. brevispica, C. dichogamus); whereas other species, particularly for seedlings, either increased (E. divinorum, G. similis), or for saplings, decreased (E. divinorum, G. similis), persistently over time. The humped relationship with rainfall implies that recruitment rates would reduce if climate change moved rainfall in either direction away from the optimum. The contemporaneous increase in seedling recruitment and decrease in sapling recruitment over time as well as with increasing rainfall, for E. divinorum and G. similis, for example, suggests the contribution of other factors beyond fire, browsing and rainfall to the removal of saplings.
Recruitment rates for all species were most strongly correlated with the 2- to 4-year moving average of either the annual, dry, or wet season rainfall components. Specifically, the recruitment rates for saplings of C. dichogamus and E. divinorum were more strongly influenced by longer rainfall lags; whereas, their seedling recruitment responded to shorter rainfall lags, as expected. Longer lags in rainfall effects arise from the time needed for vegetation to recover from past extreme rainfall events or heavy browsing pressure. Prior rainfall can affect current habitat conditions by exerting a lagged influence on the vegetation state and, therefore, plants need to invest in allocating and storing resources in underground parts. This would promote above-ground plant growth at the onset of rainfall in the following rainfall season.
The proportion of trees damaged by browsers first increased with rainfall up to a peak between 850-900 mm of rainfall and then decreased with further increase in rainfall. This quadratic relationship reflects the fact that under dry conditions, especially where soils are fertile, plant parts tend to be more palatable and browsers to be more dependent on tree foliage because of limited production of herbaceous forage (Lavorel, 1999). Dry conditions also tend to support high densities of many herbivore species; e.g., in East African savannas (Olff and Ritchie, 1998). Thus, under arid conditions the dominant plant species are likely to be those able to better tolerate herbivory because of the good opportunities for regrowth owing to relatively higher nutrient availability in the soils (McNaughton, 1985; Anderson and Briske, 1995). At high rainfall, plants are likely to have lower tissue nutrient concentrations than in the drier areas. As a result, these plants will probably only be used by fewer, large browsers, which can tolerate low plant tissue quality (Owen-Smith, 1988). Moreover, during the wet season, most browsers forage on grasses in open grasslands (Owen-Smith, 1988) where grass and water are ubiquitous and plentiful; therefore, the proportion of damaged trees is reduced at high rainfall. Furthermore, the proportion of adult trees damaged by browsers was significantly higher than that of saplings or seedlings, suggesting three possible explanations. First, adult trees are more detectable by browsers than saplings or seedlings. Second, adult trees may be selected by large browsers requiring bulk biomass in preference to saplings and seedlings with higher quality but low biomass. Third, large herbivores sometimes uproot seedlings or saplings thus precluding estimation of the proportion of damaged trees. These findings accord with those of other studies showing that greater proportions of adult trees than sapling or seedlings are damaged by large mammalian browsers, such as elephants and giraffes, in African savannas (Van Die Vijver et al., 1999).
Spatial relationships between rainfall and community biomass, diversity, stability and nestedness
As predicted, community biomass for the entire landscape was influenced most strongly by the 2-year cumulative moving average of the dry season rainfall. The relationship reflects tree responses to delayed or carry-over effects of prior dry-season conditions rather than to immediate habitat conditions alone. Furthermore, the greater importance of the dry season rainfall relative to the other rainfall components suggests that woody vegetation biomass is limited more strongly by variation in the dry-season rainfall. The significant effect of cumulative past rainfall on woody vegetation biomass suggests that woody species allocate and store more resources in their deep taproots and re-use the stored resources to increase biomass in years of high rainfall.
If competition for light were the main process governing the structural organization of the woodland communities, then species richness should decrease with increasing rainfall. However, species richness in each plot increased with increasing rainfall. This suggests that competition for light is apparently not the main mechanism controlling the structure of these woodland communities. The patterns suggest that the presence of more species may increase the functional diversity of the communities and thus allow a more differentiated and more complete exploitation of the available niche space, thereby enhancing resource use (Hooper, 1998). For example, species that are deeply rooted have access to water and nutrients not available to more shallowly rooted species, especially in drier areas (Chapin et al., 1996), which are therefore more likely to be found in wetter areas, where water is less limiting. Furthermore, the distribution of browsing pressure over more plants and better protection of rare plants from browsers at high rainfall could enable more species to successfully establish, leading to higher diversity. This suggests an important role for habitat filtering in drier areas, where only a few species are able to establish and/or survive under the stressful conditions, and the potential for interspecific differentiation in resource exploitation in wetter areas, enabling different species to jointly utilize relatively abundant resources. However, it is also possible that the number of species could increase simply by chance such that if a species is lost from the community, it is replaced randomly by another species from the larger species pool (Alonso et al., 2006). However, such subtle processes are difficult to definitively establish using the data and relationships we examined.
If competition were the main process governing community structuring, we would expect to find a negative relationship between species evenness and rainfall in which only a few species are competitively dominant and relatively abundant in wetter areas (Nijs and Roy, 2000). In contrast, we found a positive, albeit insignificant relationship between evenness and rainfall, thus providing no evidence for increasing importance of competition for light in wetter areas. Also, we found consistently high values of evenness along the rainfall gradient (0.8) suggesting a more important role for habitat filtering or stochastic processes in community structuring or assembly (Walker et al., 2006).
Our results suggest a strong nested pattern in community structure such that common species are present in both low and high rainfall areas; whereas, rare species are present only in the wetter areas. Bastolla et al. (2009) also showed that nestedness reduces effective interspecific competition and enhances the number of coexisting species, providing evidence that competition is not likely the main process shaping these communities. Our results suggest that community composition is apparently constrained by filters allowing only those species with certain properties to persist in stressful or disturbed areas in the community (Weiher et al., 1998). Differential selective environmental tolerances imposed by environmental harshness on particular species likely resulted in nested subsets (Wright et al., 1997). However, besides habitat filtering, such nested patterns may also result from facilitation or the co-dominance of both common and rare species (Aarssen, 1983; Loreau and Hector, 2001). It is possible that some species can aid the growth of others, either through provision of resources or amelioration of disturbances (Bertness and Callaway, 1994). In other cases, canopy shrubs can facilitate growth of understory species by their positive effects on soil moisture and nutrients (Bertness and Callaway, 1994). Another possible explanation for this nestedness pattern is that it is the outcome of stochastic processes (Bastolla et al., 2009; Sasaki et al., 2012). Wetter areas contain, on average, a higher community biomass, increasing the probability that a particular species occurs in such areas merely by chance. Therefore, we suggest that both habitat filtering and stochastic processes potentially play important roles in structuring savanna tree communities.
A fundamental yet unresolved question is whether diverse ecological systems are more or less stable than those with fewer species (McNaughton, 1977; Tilman, 1996; Bezemer and van der Putten, 2007). We expected to find a negative relationship between community stability and species richness if competitive mechanisms were the main force structuring community assembly, since in diverse communities the loss of one species can
be compensated for by the gain of a competing species (Tilman, 1994). These predictions were however not supported. Instead, we did not find a significant relationship between stability and richness along the rainfall gradient implying that the loss of a particular species harmed by disturbance may not necessarily be compensated for by a superior competitor. Hence, this further supports the evidence for limited competition and a more important role for habitat filtering or stochastic processes in explaining compositional patterns across the woodland communities of the Mara-Serengeti ecosystem.
Relative dominance of processes structuring the woodland communities
The drier areas were more species poor, and therefore likely to be structured by habitat filtering. Protracted droughts or extended periods of below average rainfall conditions prevent seedling establishment and recruitment into saplings, leading to dominance of certain drought-tolerant species in low rainfall areas (Midgley and Bond, 2001; Fensham et al., 2009), thereby limiting diversity and abundance. Secondly, herbivory might also account for increased habitat filtering in low rainfall areas. Drier areas have more soil nutrients due to less leaching than wet areas. Combined with adjustments in the plant carbon/nutrient balance, dry areas support some of the richest assemblages of herbivores (Sinclair, 1995; Ritchie and Olff, 1999). Herbivores likely have a greater impact on trees in drier areas because they consist of highly palatable species (Anderson and Briske, 1995; Owen-Smith, 1988), compared to trees in wetter areas. Consequently, available browse biomass reduces by 80% during the dry season for woodland communities in the Serengeti (Owen-Smith, 1988). Furthermore, the higher root-to-shoot ratio below ground makes these plant species tolerant to herbivory, because more resources are stored underground. As a result, the few grazing-tolerant plant species that persist in such areas allocate more nitrogen to their leaves, making them more palatable but able to regrow quickly (Bond et al., 2001). This has been observed in South African savannas (Owen-Smith and Cooper, 1987). In contrast, in the wetter areas, tree seedling germination and establishment is high, enabling recruitment to adulthood (Sankaran et al., 2004). Trees suffer less due to herbivory in wetter areas because they store relatively more carbohydrates above ground so that the above ground green leaves are high in indigestible carbon (Loreau and Hector, 2001). Consequently, low densities of herbivores potentially allow the rare and common species to co-exist in high rainfall areas.
We did not find evidence that competition is the main factor structuring the tree communities in the high rainfall areas. Yet, competition is considered a major structuring force in many plant communities. In savannas, in particular, competition occurs between grass and tree seedlings because the grass layer shades the establishing woody seedlings and both grasses and tree seedlings compete for water and nutrients (Knoop and Walker, 1985; Skarpe, 1992; Scholes and Archer, 1997). However, we focus here on competition between tree species and not between trees and grasses. Except near certain landscape elements, such as rivers or termite mounds, most places in the savannas, even relatively wetter areas, are very open so that light competition between trees could be very limited (Knoop and Walker, 1985; Brenes-Arguedas et al., 2011; Van der Plas et al., 2012). Trees are assumed to be limited by light at the seedling stage, albeit mostly though competition with grasses rather than with other trees (Sankaran et al., 2004). At higher rainfall, better recruitment and dispersal opportunities and reduced stress caused by drought and herbivory enable both rare and common species to establish, recruit and coexist, leading to a higher diversity. These results suggest that tree communities might therefore be mostly structured by stochastic processes in wetter areas, rather than by habitat filtering, which is more important in drier areas.
In conclusion, our results suggest strong effects of climate change on tree recruitment dynamics. A trend of rising temperatures and recurrent severe droughts could alter the composition of the woodland communities, particularly in wetter areas, where water-stress is typically minimal. If droughts become more frequent and severe, then only a few common species that are better adapted to drought and herbivory may dominate large sections of savanna woodlands, reducing the potential for the woodlands to support rare, stress-sensitive species. This would reduce their overall diversity and stability.
The authors have not declared any conflict of interests.
This project has received funding from the European Union’s Horizon 2020 research and innovation programme under grant agreement No. 641918 through the AfricanBioServices Project. JOO was also supported by the German Research Foundation (DFG, Grant ‘# 257734638). The authors thank the Office of the President of the Republic of Kenya, the Kenya Wildlife Service (KWS) and the Wardens of the Masai Mara National Reserve for permission to conduct the field research and also thank the Narok County Government (and its predecessor the Narok County Council (NCC)) for providing security during data collection and allowing their mechanics to repair our field vehicles and, together with Base Camp Explorer, for providing accommodation and office space for the MMEMP field staff.
REFERENCES
|
Adler PB, Levine JM (2007). Contrasting relationships between precipitation and species richness in space and time. Oikos 116:221-232.
Crossref
|
|
|
|
Aarssen LW (1983). Ecological combining ability and competitive combining ability in plants: Toward a general evolutionary theory of coexistence in systems of competition. American Naturalist 122:707-731.
Crossref
|
|
|
|
|
Alonso D, Etienne RS, McKane AJ (2006). The merits of neutral theory. Trends in Ecology and Evolution 21:451-457.
Crossref
|
|
|
|
|
Anderson VJ, Briske DD (1995). Herbivore-induced species replacement in grasslands: Is it driven by herbivory tolerance or avoidance? Ecological Applications 5:1014-1024.
Crossref
|
|
|
|
|
Augustine DJ, McNaughton SJ (1998). Ungulate effects on the functional species composition of plant communities: Herbivore selectivity and plant tolerance. Journal of Wildlife Management 62:1165-1183.
Crossref
|
|
|
|
|
Bascompte J, Jordano P, Melián CJ, Olesen JM (2003). The nested assembly of plant-animal mutualistic networks. Proceedings of the National Academy of Sciences 100:9383-9387.
Crossref
|
|
|
|
|
Beentje H (1994). Kenya trees shrubs and lianas. Nairobi: National Museums of Kenya.
|
|
|
|
|
Bastolla U, Fortuna MA, Pascual-Garcia A, Ferrera A, Luque B, Bascompte J (2009). The architecture of mutualistic networks minimizes competition and increases biodiversity. Nature 458:1018-1020.
Crossref
|
|
|
|
|
Belsky AJ (1994). Influences of trees on savanna productivity: Tests of shade, nutrients, and tree-grass competition. Ecology 75:922-932.
Crossref
|
|
|
|
|
Bertness MD, Callaway R (1994). Positive interactions in communities. Trends in Ecology and Evolution 9:191-193.
Crossref
|
|
|
|
|
Bezemer TM, van der Putten WH (2007). Ecology: Diversity and stability in plant communities. Nature 446:E6-E7.
Crossref
|
|
|
|
|
Bond WJ, Smythe KA, Balfour DA (2001). Acacia species turnover in space and time in an African savanna. Journal of Biogeography 28:117-128.
Crossref
|
|
|
|
|
Brenes-Arguedas T, Roddy A, Coley P, Kursar T (2011). Do differences in understory light contribute to species distributions along a tropical rainfall gradient? Oecologia 166:443-456.
Crossref
|
|
|
|
|
Burnham KP, Anderson DR (2002). Model selection and multi-model inference: a practical information-theoretic approach, 2nd ed. New York, NY: Springer-Verlag.
|
|
|
|
|
Chape S, Spalding MD, Jenkins MD (2008). The World's Protected Areas: Status, Values and Prospects in the 21st Century. Cambridge, UK: UNEP-WCMC.
|
|
|
|
|
Chapin FS, Bretâ€Harte MS, Hobbie SE, Zhong H (1996). Plant functional types as predictors of transient responses of arctic vegetation to global change. Journal of Vegetation Science 7:347-358.
Crossref
|
|
|
|
|
Chase JM, Leibold MA (2003). Ecological Niches. Chicago, IL: University of Chicago Press.
Crossref
|
|
|
|
|
Coe MJ, Cumming DH, Phillipson J (1976). Biomass and production of large African herbivores in relation to rainfall and primary production. Oecologia 22:341-354.
Crossref
|
|
|
|
|
Cottenie K (2005). Integrating environmental and spatial processes in ecological community dynamics. Ecology Letters 8:1175-1182.
Crossref
|
|
|
|
|
Coughenour MB (2006). PPTMAP software. Fort Collins, CO, USA.
|
|
|
|
|
Deshmukh I (1986). Primary production of a grassland in Nairobi National Park, Kenya. Journal of Applied Ecology 23:115-123.
Crossref
|
|
|
|
|
Diamond JM (1975). Assembly of species communities. Ecology and Evolution of Communities (Eds Cody ML, Diamond JM). Cambridge, Massachusetts: Harvard University Press.
|
|
|
|
|
Dormann CF, Gruber B, Freund J (2008). Introducing the bipartite Package: Analysing Ecological Networks. R news 8:8-11.
|
|
|
|
|
Draper NR, Smith H (1998). Applied regression analysis. New York, NY: Wiley.
Crossref
|
|
|
|
|
Dublin HT (1986). Decline of the Mara woodlands: the role of fire and elephants. PhD, Dissertation. Vancouver, Canada: University of British Columbia.
|
|
|
|
|
Dublin HT, Douglasâ€Hamilton I (1987). Status and trends of elephants in the Serengetiâ€Mara ecosystem. African Journal of Ecology 25:19-33.
Crossref
|
|
|
|
|
Dublin HT, Sinclair ARE, McGlade J (1990b). Elephants and fire as causes of multiple stable states in the Serengeti-Mara woodlands. Journal of Animal Ecology 59:1147-1164.
Crossref
|
|
|
|
|
Dublin HT, Sinclair ARE, Boutin S, Anderson E, Jago M, Arcese P (1990a). Does competition regulate ungulate populations? Further evidence from Serengeti, Tanzania Oecologia 82:283-288.
Crossref
|
|
|
|
|
Dublin HT (1991). Dynamics of the Serengeti-Mara Woodlands: An historical perspective. Forest & Conservation History 35:169-178.
Crossref
|
|
|
|
|
Dublin HT (1995). Vegetation dynamics in the Serengeti-Mara Ecosystem: The role of elephants, fire, and other factors. In. Sinclair ARE, Arcese P (Eds), Dynamics, management, and conservation of an ecosystem. Chicago, IL: The University of Chicago Press pp. 71-91.
|
|
|
|
|
Fensham RJ, Fairfax RJ, Ward DP (2009). Drought-induced tree death in savanna. Global Change Biology 15:380-387.
Crossref
|
|
|
|
|
Green DS, Roloff GJ, Heath BR, Holekamp KE (2015). Temporal dynamics of the responses by African mammals to prescribed fire. Journal of Wildlife Management 79:235-242.
Crossref
|
|
|
|
|
Grime JP (1997). Biodiversity and ecosystem function: the debate deepens. Science 277:1260-1261.
Crossref
|
|
|
|
|
Harper JL (1977). The population biology of plants. New York, NY: Academic Press.
|
|
|
|
|
Holmgren M, López BC, Gutiérrez JR, Squeo FA (2006). Herbivory and plant growth rate determine the success of El Niño Southern Oscillation-driven tree establishment in semiarid South America. Global Change Biology 12:2263-2271.
|
|
|
|
|
Hooper DU (1998). The role of complementarity and competition in ecosystem responses to plant diversity. Ecology 79:704-719.
Crossref
|
|
|
|
|
Hubbell SP (2001). The unified neutral theory of biodiversity and biogeography. Princeton, NJ: Princeton University Press.
|
|
|
|
|
Hubbell SP (2005). Neutral theory in community ecology and the hypothesis of functional equivalence. Functional Ecology 19:166-172.
Crossref
|
|
|
|
|
Huston MA (1997). Hidden treatments in ecological experiments: Re-evaluating the ecosystem function of biodiversity. Oecologia 110:449-460.
Crossref
|
|
|
|
|
Hutchinson GE (1959). Homage to Santa Rosalia or why are there so many kinds of animals? American Naturalist 93:145-159.
Crossref
|
|
|
|
|
Keddy PA (1992). Assembly and response rules: two goals for predictive community ecology. Journal of Vegetation Science 3:157-164.
Crossref
|
|
|
|
|
Knoop WT, Walker BH (1985). Interactions of Woody and Herbaceous Vegetation in a Southern African Savanna. Journal of Ecology 73:235-253.
Crossref
|
|
|
|
|
Lavorel S (1999). Ecological diversity and resilience of Mediterranean vegetation to disturbance. Diversity and Distributions 5:3-13.
Crossref
|
|
|
|
|
Loreau M, Hector A (2001). Partitioning selection and complementarity in biodiversity experiments. Nature 412:72-76.
Crossref
|
|
|
|
|
McGill BJ, Enquist BJ, Weiher E, Westoby M (2006). Rebuilding community ecology from functional traits. Trends in Ecology & Evolution 21:178-185.
Crossref
|
|
|
|
|
McNaughton SJ (1977). Diversity and stability of ecological communities: A comment on the role of empiricism in ecology. American Naturalist 111:515-525.
Crossref
|
|
|
|
|
McNaughton SJ (1985). Ecology of a Grazing Ecosystem: The Serengeti. Ecological Monographs 55:259-294.
Crossref
|
|
|
|
|
Midgley JJ, Bond WJ (2001). A synthesis of the demography of African acacias. Journal of Tropical Ecology 17:871-886.
Crossref
|
|
|
|
|
Nijs I, Roy J (2000). How important are species richness, species evenness and interspecific differences to productivity? A mathematical model. Oikos 88: 57-66.
Crossref
|
|
|
|
|
O'Connor TG (1995). Acacia karroo invasion of grassland: environmental and biotic effects influencing seedling emergence and establishment. Oecologia 103:214-223.
Crossref
|
|
|
|
|
Ogutu JO, Piepho HP, Dublin HT, Bhola N, Reid RS (2008a). El Nino-Southern Oscillation, rainfall, temperature and Normalized Difference Vegetation Index fluctuations in the Mara-Serengeti ecosystem. African Journal of Ecology 46:132-143.
Crossref
|
|
|
|
|
Ogutu JO, Piepho HP, Dublin HT, Bhola N, Reid RS (2008b). Rainfall influences on ungulate population abundance in the Mara-Serengeti ecosystem. Journal of Animal Ecology 77:814-829.
Crossref
|
|
|
|
|
Ogutu JO, Piepho HP, Owen-Smith N, Said MY (2011). Continuing wildlife population declines and range contraction in the Mara Region of Kenya during 1977-2009. Journal of Zoology 285:99-109.
Crossref
|
|
|
|
|
Olff H, Ritchie ME (1998). Effects of herbivores on grassland plant diversity. Trends in Ecology and Evolution 13:261-265.
Crossref
|
|
|
|
|
Oloo TW, Brett R, Young TP (1994). Seasonal variation in the feeding ecology of black rhinoceros (Diceros bicornis L.) in Laikipia, Kenya. African Journal of Ecology 32:142-157.
Crossref
|
|
|
|
|
Owen-Smith N, Cooper SM (1987). Palatability of woody plants to browsing ruminants in a South African savanna. Ecology 68:319-331.
Crossref
|
|
|
|
|
Owen-Smith N (1988). Megaherbivores: The influence of very large body size on ecology. Cambridge, UK: Cambridge University Press.
Crossref
|
|
|
|
|
Ozinga WA, Schaminée JHJ, Bekker RM, Bonn S, Poschlod P, Tackenberg O, Bakker J, van Groenendael JM (2005). Predictability of plant species composition from environmental conditions is constrained by dispersal limitation. Oikos 108: 555-561.
Crossref
|
|
|
|
|
Pennycuick L, Norton-Griffiths M (1976). Fluctuations in the rainfall of the Serengeti ecosystem, Tanzania. Journal of Biogeography 3:239-245.
Crossref
|
|
|
|
|
Pielou EC (1977). Mathematical ecology. New York, NY: Wiley.
|
|
|
|
|
Pimm SL (1984). The complexity and stability of ecosystems. Nature 307:321-326.
Crossref
|
|
|
|
|
Reed DN, Anderson TM, Dempewolf J, Metzger K, Serneels S (2009). The spatial distribution of vegetation types in the Serengeti ecosystem: the influence of rainfall and topographic relief on vegetation patch characteristics. Journal of Biogeography 36:770-782.
Crossref
|
|
|
|
|
Ritchie ME, Olff H (1999). Spatial scaling laws yield a synthetic theory of biodiversity. Nature 400:557-560.
Crossref
|
|
|
|
|
Rodríguez-Gironés MA, Santamaría L (2006). A new algorithm to calculate the nestedness temperature of presence-absence matrices. Journal of Biogeography 33:924-935.
Crossref
|
|
|
|
|
Rosenzweig ML (1995). Species diversity in space and time. Cambridge, UK: University of Cambridge Press.
Crossref
|
|
|
|
|
Sankaran M, Ratnam J, Hanan NP (2004). Tree-grass coexistence in savannas revisited - insights from an examination of assumptions and mechanisms invoked in existing models. Ecology Letters 7:480-490.
Crossref
|
|
|
|
|
Sasaki T, Katabuchi M, Kamiyama C, Shimazaki M, Nakashizuka T, Hikosaka K (2012). Nestedness and niche-based species loss in moorland plant communities. Oikos, 121:1783-1790.
Crossref
|
|
|
|
|
Shannon CE, Weaver W (1949). The Mathematical Theory of Information. Urbana, IL: University of Illinois Press.
|
|
|
|
|
Scholes RJ, Archer SR (1997). Tree-grass interactions in savannas. Annual Reviews of Ecology & Systematics 28:517-544.
Crossref
|
|
|
|
|
Sharam GJ, Sinclair ARE, Turkington R (2006). Establishment of broad-leaved thickets in Serengeti, Tanzania: The influence of fire, browsers, grass competition, and elephants. Biotropica 38:599-605.
Crossref
|
|
|
|
|
Shipley B, Paine CET, Baraloto C (2011). Quantifying the importance of local niche-based and stochastic processes to tropical tree community assembly. Ecology 93:760-769.
Crossref
|
|
|
|
|
Silvertown J, Dodd ME, McConway K, Potts J, Crawley M (1994). Rainfall, biomass variation, and community composition in the Park Grass Experiment. Ecology 75:2430-2437.
Crossref
|
|
|
|
|
Sinclair ARE (1995). Population limitation of resident herbivores. In. Sinclair ARE, Arcese P (Eds), Serengeti II: Dynamics, Management and Conservation of an Ecosystem. Chicago, IL, USA: University of Chicago Press. pp. 194-219.
|
|
|
|
|
Skarpe C (1992). Dynamics of savanna ecosystems. Journal of Vegetation Science 3:293-300.
Crossref
|
|
|
|
|
Stellfox JG, Peden DG, Epp H, Hudson RJ, Mbugua, SW, Agatsiva JL, Amuyunzu CL (1986). Herbivore Dynamics in Southern Narok, Kenya. Journal of Wildlife Management 50:339-347.
Crossref
|
|
|
|
|
Tilman D (1982). Resource competition and community structure. Princeton, NJ: Princeton University Press.
|
|
|
|
|
Tilman D (1994). Competition and biodiversity in spatially structured habitats. Ecology 75:2-16.
Crossref
|
|
|
|
|
Tilman D (1996). Biodiversity: Population versus ecosystem stability. Ecology, 77:350-363.
Crossref
|
|
|
|
|
Tilman D, Reich PB, Knops JMH (2006). Biodiversity and ecosystem stability in a decade-long grassland experiment. Nature 441:629-632.
Crossref
|
|
|
|
|
Van Die Vijver CADM, Foley CA, Olff H (1999). Changes in the woody component of an East African savanna during 25 years. Journal of Tropical Ecology 15:545-564.
Crossref
|
|
|
|
|
Van der Plas F, Anderson TM, Olff H (2012). Trait-based community assembly from a multitrophic perspective: bottom-up or top-down regulation? Ecology 93:836-846.
Crossref
|
|
|
|
|
Virginia RA, Wall DH (2001). Principles of ecosystem function. In. Levin SA (Ed), Encyclopedia of Biodiversity. London, UK: Academic Press. pp. 345-352.
Crossref
|
|
|
|
|
Walker BH (1987). Determinants of tropical savannas. Oxford, UK: IRL Press.
|
|
|
|
|
Walker MD, Wahren CH, Hollister RD, Henry GHR, Ahlquist LE, Alatalo JM, Bret-Harte MS, Calef MP, Callaghan TV, Carroll AB, Epstein HE, Jónsdóttir IS, Klein JA, Magnússon B, Molau U, Oberbauer SF, Rewa SP, Robinson CH, Shaver GR, Suding KN, Thompson CC, Tolvanen A, Totland Ø, Turner PL, Tweedie CE, Webber PJ, Wookey PA (2006). Plant community responses to experimental warming across the tundra biome. Proceedings of the National Academy of Sciences 103:1342-1346.
Crossref
|
|
|
|
|
Weiher E, Clarke GDP, Keddy PA (1998). Community assembly rules, morphological dispersion, and the coexistence of plant species. Oikos 81:309-322.
Crossref
|
|
|
|
|
Wright DH, Reeves JH (1992). On the meaning and measurement of nestedness of species assemblages. Oecologia 92:416-428.
Crossref
|
|
|
|
|
Wright DH, Patterson BD, Mikkelson GM, Cutler A, Atmar W (1997). A comparative analysis of nested subset patterns of species composition. Oecologia 113:1-20.
Crossref
|
|
|
|
|
Zimmermann NE, Yoccoz NG, Edwards TC, Meier ES, Thuiller W, Guisan A, Schmatz DR, Pearman PB (2009). Climatic extremes improve predictions of spatial patterns of tree species. Proceedings of Nattional Academy of Science 106:19723-19728.
Crossref
|
|
|
|
|
R Development Core Team (2010). R: A language and environment for statistical computing. Viennna, Austria.
|
|