ABSTRACT
Analyzing trends of land use and the change over time is an effective way for assessing the impact on ecosystem function. A study was conducted to detect forest cover change of Yabello forest between 1986 and 2016. The land use maps of 1986, 1996, 2006 and 2016 were derived from satellite images. The spatial pattern analysis indicated that the Yabello land use/land cover (LULC) is at a dynamic state and forests had undergone substantial changes during the last 30 years. Between 1986 and 2016, a considerable decrease in forest land cover was observed (-1919.52 ha). Thus, local communities’ perceptions indicated that recurrent drought, wood extraction and increased human population size were largely responsible for the observed LULC changes in the study area. Generally, the temporal decrease in forest cover and low woody vegetation diversity showed that the Yabello forest was under degradation, which was attributed to anthropogenic factors. Thus, collaborative forest management arrangements with the local communities and improved law enforcement strategies are essential to ease the present human influence on the natural forest and enhance sustainable management.
Key words: Forest covers change, satellite image, remote sensing, geographical information system (GIS).
Land use refers to a series of operations on land, carried out by humans, with the purpose to obtain products and/or benefit through using land resources, including soil and vegetation resources which is part of land cover as stated by Ecological Society of America’s Committee on Land Use (ESA, 2000). Land cover refers to the vegetation (natural and planted), water, bare rock, sand and similar surface and also man-made construction occur on the earth’s surface. Land cover is a fundamental variable that impacts on and links many parts of the human and physical environments (Foody, 2002). Land-use/Land-cover change is a significant cause, or forcing function of global change and the medium through which many human responses to global change will occur. It is clearly an essential component in all considerations of sustainability as stated by International Geosphere-Biosphere Programme (IGBP, 1999).
At a global scale, land-use changes are cumulatively transforming land cover at an accelerating pace (Houghton, 1994). These changes in terrestrial ecosystems are closely linked with the issue of the sustainability of socioeconomic development since they affect essential parts of our natural capital such as climate, soils, vegetation, water resources and biodiversity. Food and Agricultural Organization (FAO, 2001) estimated that the world’s natural forests decreased by 16.1 million hectares per year on average during the 1990s; that is a loss of 4.2% of the natural forest that existed in 1990. Again, FAO (2010) reports shows that, forests cover slightly more than 4 billion ha (31% of the world’s total land area) and correspond to an average of 0.6 ha per capita. However, about 13 million ha of forests were converted to other uses or disappeared as a result of natural phenomena each year during the past decade.
In Ethiopia, change in land use has been happening mainly through the conversion of natural forests to agricultural land and settlement (Tesfaye et al., 2014). Long-term human influences are considered to be the primary cause of unsustainable forest exploitation in Ethiopia and they resulted into serious environmental degradation in the highlands of the country (Berhan, 2005). FAO (2010) reports show that forest resources of Ethiopia canopy cover is 10 to 30%. Accordingly, FAO (2010) report shows that Ethiopia’s forest cover is 12.2 million ha (11%) in 2010, and it further indicated that the forest cover shows a decline from 15.11 million ha in 1990 to 12.2 million ha in 2010, during which 2.65% of the forest cover was deforested.
Major land cover changes have also occurred at the local level for all land use types. For instance, Tekle and Hedlund (2000) reported, increases in open area settlements at the expense of shrub lands and forests due to increased plantations, destruction of the natural vegetation and expansion of grazing land between 1958 and 1986 in the Kalu area, North Central Ethiopia. Zeleke (2000) stated that a significant increase in cultivated land at the expense of forestland was found to have occurred between 1957 and 1995 in the Dembecha area, Northwest Ethiopia. A report from Assen and Negussie (2009) in Chirokella Micro-Watershed of South Eastern Ethiopia also indicated that, the dense forest reduced by over 80% and the moderately forested land was completely transformed into other land use and land cover systems. According to Zeleke and Hurni (2001), the natural forest cover declined from 27% in 1957 to 2% in 1982 and 0.3% in 1995 in North Western Ethiopian highlands. Such a dramatic change in 4 decades and the increasing proportion of completely degraded lands clearly indicates the prevailing danger of land degradation in the area (Zeleke and Hurni, 2001).
Mohammed (2014)estimated the continuous declining of open shrub and tree savanna areas from 45% in the 1976 to 9% in the 2012 (-36%) and forest land declined by 6% from 1976 to 2012 in pastoral rangeland systems of Borana. Therefore, assessing the status of forest resources of the region is needed to identify the forest cover of the region in order to design possible management intervention for climate resilient green economy (CRGE) plan that the country is currently following. To assess such recent changes in the study area, the quantitative and spatially explicit data on how land cover has been changed is required. Hence, a combined use of Remote Sensing (RS) and Geographic Positioning System (GPS) provides a reliable source of data for assessing and monitoring spatial and temporal land use and land cover changes and address a wide variety of resource management problems (Alemu et al., 2015). Remote sensing technology and satellite images can play a major role in setting up inventories of natural resources because they give a visual assessment of land cover changes over a period of time and provide accurate and reliable quantitative information with cost effective and lesser time on the trade-offs between different land cover categories compared to other methods (Tekle and Hedlund, 2000; Lemlem, 2007).
Conversions of land from one use to another have become recognized as major causes of global environmental changes and also local land use land cover dynamics. Such local-level dynamics play a significant role in determining the health of an ecosystem at the micro level. In Ethiopia there is a shortage of accurate information regarding the rate of deforestation and the extent of earlier forest cover (Dessie and Kleman, 2007). Borana Plateau has markedly changed in terms of land cover and land use in recent decades, and Yabello district has indeed changed greatly in terms of land use/cover; dramatic declines were noted in the extent of grasslands and forest land, while croplands increased five-fold, and bushed-grasslands and bush lands both increased substantially (Mesele et al., 2006). Borana zone is one of the areas in which woodlands and shrub lands found in southern parts of the country. These woodlands and shrub lands forest resources currently are under problem due to human pressure for construction and fire wood, over grazing and climate change (recurrent drought). According to Daniel (2010), Forest Cover of Borana decreased from 1.5% in 1986 to 1.2% in 2002, decreased by 6511 ha. Juniperus procera forests naturally found in the zone are currently disappearing due to distraction for construction and fire wood and patch of woodland tree species in the area are drying and others are distracting. This condition needs to be studied to understand the situation based on empirical evidences.
It is, therefore, important to determine spatial-temporal dynamics of land use/cover and analyze/detect forest cover changes of the study area in different time periods as it can help to design more effective land management strategies and policies which is crucial in monitoring LULC change and resource management, provides land use planning and necessary supporting data for the pastoralists, researchers, governmental organizations (GOs) and non-governmental organizations (NGOs).
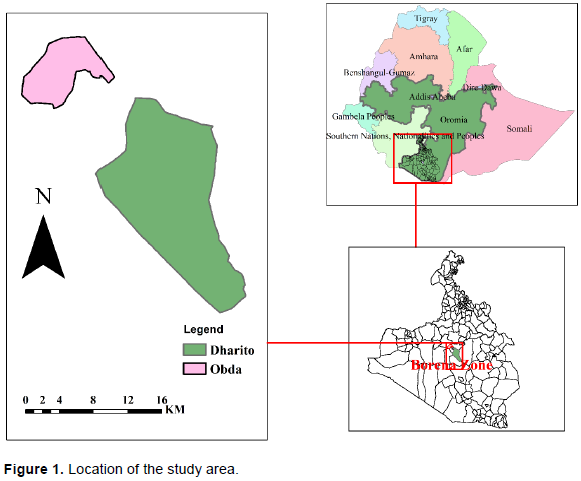
Description of the study area
The study was conducted in Dharito and Obda kebele (PA) located in Yabello district of Borana range land of southern Oromia. Yabello district is situated in Borana zone of Oromia National Regional State at 570 km south of Addis Ababa. The total land area of the study sites (Dharito and Obda) is 270.0981 km2 and lies between 1350 and 1800 m. a.s.l (Coppock, 1994). The study area lies between 4° 38’ 30’’ N to 4° 57’ 0’’ N and 38° 2’ 0’’ E to 38° 16’ 30’’ E. The district and the peasant associations (PAs) that the study conducted are as shown in Figure 1. Yabello district has a bi-modal rainfall pattern with the main rainy season (Ganna) between March and May with the peak in April (Coppock, 1994). The short rainy season (Hagayya) extends from September to November with a peak in October. The mean annual rainfall of the zone ranges from 352 mm at southern part to 605 mm to the northern part of the zone. The mean annual rainfall is 587.2 mm. The mean annual temperature varies from 15 to 24°C and shows little variation across the seasons (Coppock, 1994).
The geology of the study area is dominated by 40% quaternary deposits, 38% basement complex formations, and 20% volcanic as cited in Zeleke (2009). According to Coppock (1994), Borana range land comprise three main soils, 53% red sandy loam soil, 30% black clay and volcanic light colored silty clay and 17% silty. The rangelands of the district as a whole are communal land except some areas, which are owned by government organization (ranches, sanctuaries), and investment areas (Angassa and Oba, 2008). Five major land use/cover patterns, namely grassland cover, woody vegetation cover, cultivated land; settlement and bare land were identified in the district (Daniel, 2010).
Plant communities on flat and hilly plains of central Borana Plateau consist of a diverse mixture of woody and herbaceous vegetation (Coppock, 1994). According to Solomon et al. (2016) cited in Zeleke (2009), four plant community types were described, namely: evergreen and semi evergreen bush land and thickets, rangeland dominated by shrubby Acacia, Commiphora and allied genera, and dwarf shrub grassland to shrub grassland. The best forage sources are native species of grasses, woody plants and stands of Acacia species (Tamene, 1990). The total human population of the zone is about 1,192,649 (601,649 males and 591,000 females) while the population of Yabello district is about 128,762 (64,692 Male and 64,070 Female) (CSA, 2013). The livestock population in the zone by species is 1,081,553 cattle, 343,674 sheep, 876,139 goats, 874 horse, 2,102 mules, 73,762 donkey, 75,622 camels, 689,154, poultry and 68,953 beehives (CSA, 2016).
Methods of data collection
Selection of the study site and sampling design
Discussions and interviews with experts of zonal and Woreda office agriculture and NGOs working in the area as well as key informants from Borana pastoralists were held on the study research questions. Then a reconnaissance survey was conducted with the purpose of assessing, identifying and selecting the land use/land cover and forest areas representing forests of Yabello district. Finally, based on the aforementioned criteria, two study sites Dharito and Obda Kebele were purposively selected to assess forest cover change of the study area. The study largely encompasses GPS/ground truth point data collection and investigation on land use/land cover dynamics.
Acquisition of satellite imageries
Landsat satellite images of four periods (1986, 1996, 2006 and 2016) were obtained from United States Geological Survey (USGS) data portal (https://earthexplorer.usgs.gov/ assessed in 15-22 May, 2017). Images were taken during the dry season to avoid cloudy, in December and/or January in conjunction with field surveys (Table 1). A sufficient quantity of reference data is very important for quality assessment. Data for ground referencing (ground truth) were collected during field work by reading GPS Garmin 72H and used for the land use/land classification. In addition, interview from selected households, Google earth and pre-processed (raw) imagery were used for accuracy assessment.
Data analysis and preparation
Landsat images pre-processing
Image preprocessing such as geometric correction, layer stacking, image registration and sub setting were applied to all images using ENVI version 5.1. All images were corrected to Universal Transverse Mercator (UTM) projection using datum World Geodetic System (WGS) 84 zone 37N to ensure accuracy for use within a GIS system and image registration (tying ground control points) was done with less than 0.5 pixels mean square error for all images. Atmospheric correction was applied to all images using the Quick Atmospheric Correction (QUAC) module in ENVI version 5.1. All images were stacked into a multilayer image to combine the different bands of each image from the specified path and row using ENV 5.1 software. All images were also subset (clipped) via regions of interest to the study area Dharito and Obda (Figure 2). False color composite images in Red, Green and Blue (RGB) band combination were performed for all images by using ENVI 5.1 software to interpret and discriminate the surface features clearly. This is because vegetation cover reflects more at infrared region than a visible band (Deneke, 2007).
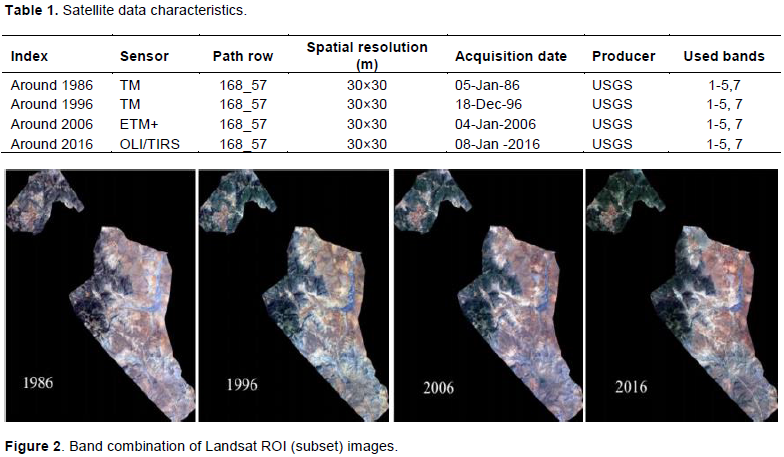
Image classification
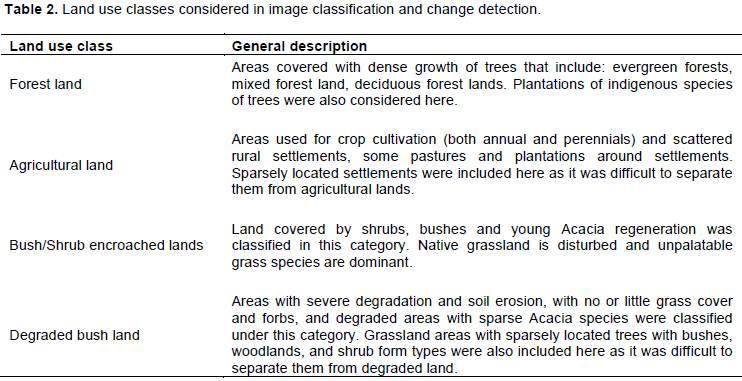
Classification of a satellite image was done by supervised procedures using ENVI (version 5.1) software packages. The support vector machine algorithm classification method was used for the classification of all the images. The supervised classification type is the one in which all pixels with similar spectral value are automatically categorized into a land cover class or themes. Training in areas corresponding to each classification item was generated from the field by using ground controlling points. In this study, a total sample size of 136, 144, 135 and 134 points were collected for Landsat images of 1986, 1996, 2006 and 2016, respectively through stratified random sampling, and 70% of the sampled training points were used for classification, and 30% were used for accuracy assessment. Usually classification is performed with asset of target classes in mind and the classification scheme has to have classes that can be used for the study (objective of the research) and discernible from the available data. For this purpose, Anderson et al. (1976) classification scheme was applied for the land use/land cover classification. Hence, based on the prior knowledge of the study area and additional information from previous research, physical site observation and interviewing with key informants of the study area, four land use classes were considered in image classification: forest land, agricultural land, degraded bush land and shrub/bush encroached lands. Table 2 shows a brief description of each of the land use classes considered in the study area.
Accuracy assessment
Accuracy assessment involves generating a set of points from the classified imagery and comparing the positions of points whose location were determined by the ground truth data and corresponding coordinates from the original maps. The confusion matrix was used for accuracy assessment using sufficient ground check points taken from each land use (Shalaby and Tateishi, 2007). Thus, total accuracy and Kappa statistics, producer user accuracy and user accuracy were computed. Confusion matrix and kappa coefficients were used as a means of evaluating image classification accuracy. A kappa coefficient typically lies between 0 and 1. According to Anthony et al. (2005) kappa value has a characteristic of: value greater than 0.8 denotes a strong agreement, value between 0.4 and 0.8 denotes a moderate agreement and a value below 0.4 represents poor agreement. In principle, all the output maps have to meet the minimum 85% accuracy (Anderson et al., 1976).
Change detection analysis
After accomplishing classification of each land use/land cover classes, land use land cover change detection was developed by comparing the two successive periods of image. By comparing the two sets of imagery data, the statistical summary of the areas covered by each land cover type and changes among different land cover classes that helps to know what percent, and area coverage of each land use land cover has for each period were computed. Thus, the Land Change Modeler (LCM) in IDRISI Selva 17 software was applied and the change detection (gain, loss and net change) and the direction of change for the images (1986 to 1996, 1996 to 2006, 2006 to 2016 and 1986 to 2016) were quantified and summarized.
Land use land cover classification of the study area (1986, 1996, 2006, and 2016)
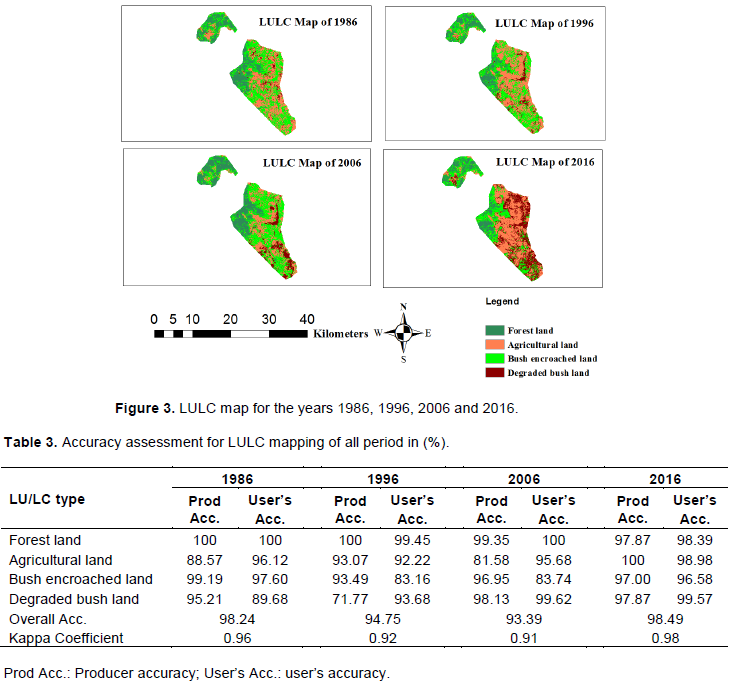
The results of the supervised land use/land cover (LULC) classifications using Landsat images were presented and four land use/land cover categories, which were: forest land, agricultural land, bush encroached lands and degraded bush land were identified as the major LULC classes of the study area. Thus, the land use/land cover classification map for 1986, 1996, 2006 and 2016 is as shown in Figure 3.
The study revealed that, accuracy assessment was performed for all classified LULC maps of the study area and obtained having producer’s accuracy, user’s accuracy, accuracy totals and kappa coefficients (Table 3). The overall accuracy assessment describes the overall LULC classes’ accuracy of classification for a single period. The land use/land cover classification accuracy of the year 1986 was relatively better than 1996 and 2006 but less than 2016 images.
Thus, the overall accuracy and kappa of all periods of classification results were 98.24, 94.75, 93.39 and 98.49% and 0.96, 0.92, 0.91 and 0.98, respectively. Forest has a producer’s accuracy of 100, 100, 99.35 and 97.87. All the remaining LULC classes were having their producer’s accuracies above 85%. Similarly, the user’s accuracies of all the LULC types in all periods were above 85% shown in Table 3. The finding was in line with Anderson et al. (1976) who stated that in principle, all the output maps have to meet the minimum 85% accuracy.
This result was also similar with report of Anthony et al. (2005) who reported the kappa value has a characteristic of: value greater than 0.8 denotes a strong agreement, value between 0.4 and 0.8 denotes a moderate agreement and a value below 0.4 represents poor agreement.
Land covers classes of the study area (1986, 1996, 2006, and 2016)
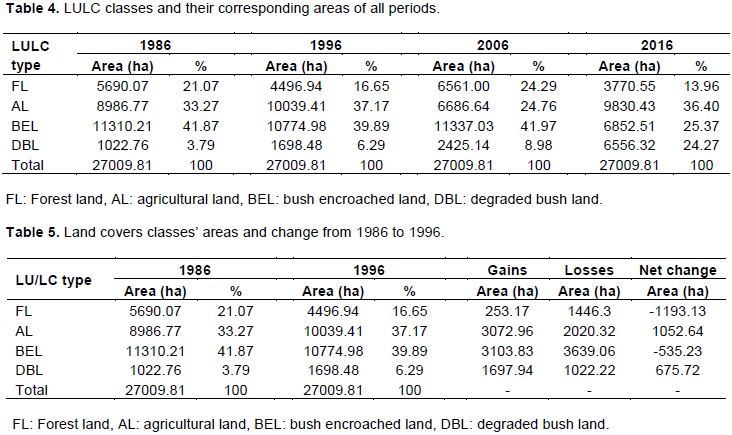
An area in hectares and percentage cover of each land use land cover classes of all periods is shown in Table 4. The classification indicated that the forest cover of the study area was showing a dynamic change both spatially and temporally throughout the period of time (1986 to 2016). Thus, the land use and land cover classes of bush encroached class 11310.21 ha (41.87%) and agricultural land 8986.77 ha (33.27%) show the largest share in 1986. Whereas, the aerial coverage of the forest land and degraded bush land were the least coverage of the study area which occupied about 5690.07 ha (21.07%) and 1022.76 ha (3.79%), respectively. Moreover, much of the coverage of the year 1986 was the natural vegetation which consists of forest land and bush encroached land that occupied about 62.94% of the total area while the remaining 37.06% was agricultural land and degraded bush land. Similarly, in the case of the year 1996, the land use and land cover classes of the bush encroached land 10774.98 ha (39.89%) and agricultural land 10039.41 ha (37.17%) showed the biggest coverage of the study area. The least area coverage was still forest land 4496.94 ha (16.65%) and degraded bush land which occupied only 1698.48 ha (6.29%). In this case, the forest cover was decreased from 5690.07 to 4496.94 ha.
In 2006, as shown in Table 4, the highest share of all classes were bush encroached land, which was occupied by 11337.03 ha (41.97%), followed by agricultural land cover of 6686.64 (24.76%). Although, forest cover and degraded bush land were increasing, still they were occupying the least area coverage with 6561 ha (24.29%) and 2425.14 ha (8.98%). The LULC classification for 2016 from satellite image (Table 4) showed that bush encroached land 6852.51 ha (25.37%) and agricultural land 9830.43 ha (36.4%) accounted for the largest coverage of the study area. While, forest cover was at a substantial decrease which cover 3770.55 ha (13.96%) and degraded bush land was at increasing trend covering 6556.32 ha (24.27%). During this period, most portion of the LULC class was agricultural land.
Land use land cover change detection analysis of the study area
The result from the land change modeler (LCM) showed that the change detection analysis of all images. Thus, the change detection (gain, loss and net change) and the direction of change in land cover classes for the two successive period image has been quantified and summarized in Tables 5, 7, 9, and 11, respectively. The negative net change indicates a certain land use/land cover is in a state of decrement and the positive indicates increment. The land use/land cover changes in most of the land use types are not static; there is a significant land use land cover change observed in the study area.
Land use land cover change detection analysis of 1986 to 1996
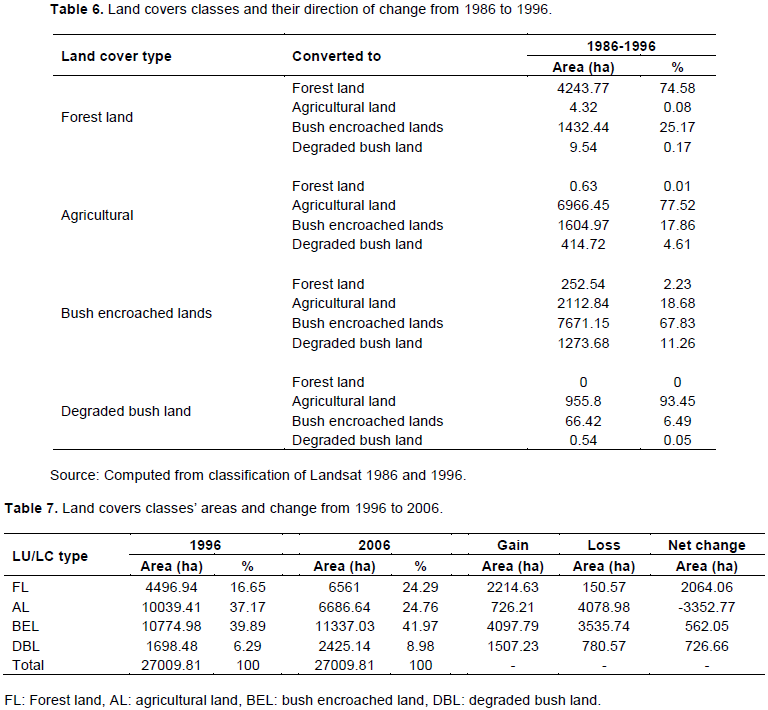
In the first period of the study (1986-1996), there was a remarkable decrease of forest land from 5690.07 to 4496.94 ha by a net change of -1193.13 ha (Table 5). During this period, about 4243.77 ha of the forest land area was transformed into its original extent and at the same time around 253.17 ha gained from other classes and also losses about 1446.3 ha to other classes; 4.32 ha to agricultural land, 1432.44 ha to bush encroached land and 9.54 ha to degraded bush land (Table 6). On the contrary, agricultural land and degraded land increased from 8986.77 to 10039.41 ha and 1022.76 to 1698.48 ha. Thus, agricultural land and degraded bush land gains much more than they losses and was increased by net 1052.64 and 675.72 ha, respectively. The gains, losses and the net change area for the other land uses are shown in Table 5. Decrease in vegetation has been as a result of anthropogenic activities in the study area. The study was similar with reports of Forkuo and Frimpong (2012) stated that, in and around the catchments of the Owabi dam, the forest cover has decreased by an amount of 2136.6 and 1231.56 ha, respectively representing 24.7 and 14.2% from 1986 to 2002 and 2002 to 2007. Abate and Angassa (2016) reported that the proportion of bush land was reduced by 3% during the first phase of the study period (1987 to 1995) in Borana range lands.
Land use land cover change detection analysis of 1996 to 2006
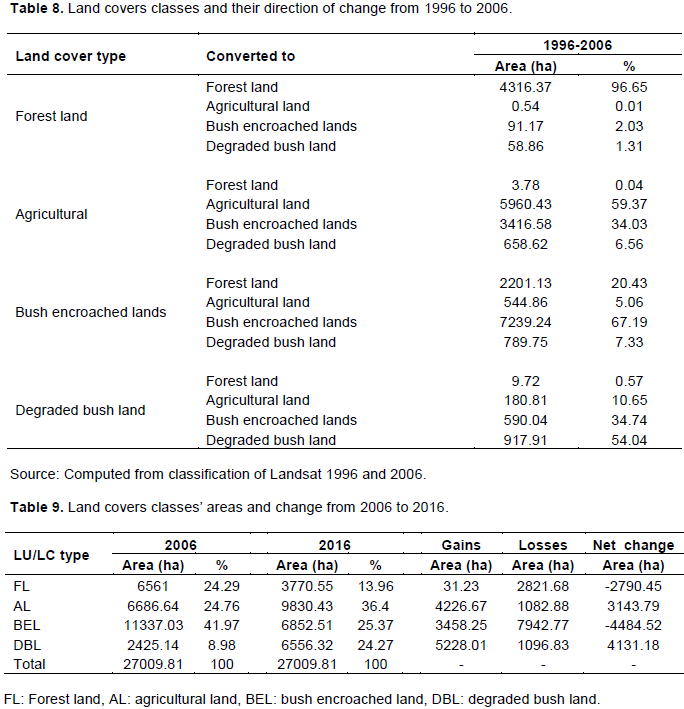
The change detection analysis showed that between 1996 and 2006, forest cover increased from 4496.94 ha in 1996 to 6561 ha in 2006 which means the average rate of change during ten years was 2064.04 ha (Table 7). This increase in forest cover was due to the establishment of participatory forest management and forest user group those who had been conserving the forests and necessitate regeneration of seedlings of the forests specially during the first five years and plantation of J. procera during 1992 to 1995 (Irwin and Mitiku 2004). A previous studies from Gobeze et al. (2009) in Bonga forest stated that PFM improved forest conditions such as seedling and sapling densities, promoted awareness about the forest, capacitated locals to form new institutional arrangement that increased their participation in forest management, helped to reduce open access and assisted a regulated forest use. Another report from Kebebew (2012)also indicated that forest area of Chilimo has been increased by 9% between 1995 and 2003 after participatory forest management implantation.
However, a small portion of the forest was also converted to agricultural land (0.54 ha), bush encroached land (91.17 ha) and degraded bush land (58.86 ha) (Table 8), whereas bush encroached land and degraded bush land also similarly increased from 10774.98 to 11337.03 ha by +562.05 ha and 1698.48 to 2425.14 ha by +726.66 ha respectively. A study from Abate and Angassa (2016) indicated that bush cover was rapidly expanded among the vegetation components with a change extent of 17.5% between 1987 and 2003 in the Borana range land. On the contrast, agricultural lands decreased from 10039.41 to 6686.64 ha by -335.277 ha between the years 1996 to 2006. In a similar manner, the direction of change in for all land use and land cover class is shown in Table 8.
Land use land cover change detection analysis of 2006 to 2016
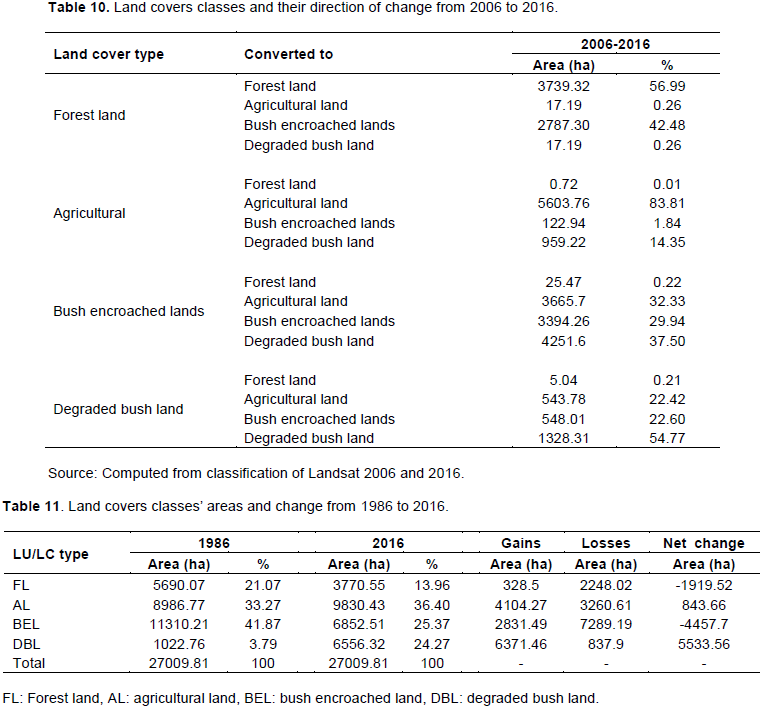
Between 2006 and 2016, the land use land cover change of the study area showed a substantial decrease in areal coverage of forest cover and bush encroached lands from 6561 to 3770.55 ha by a net change of -2790.45 ha and 11337.03 to 6852.51 ha by a net change of -4484.52 ha, respectively (Table 9). During this period, a portion of forest cover was converted to agricultural land (17.19 ha), bush encroached land (2787.30 ha) and degraded bush land (17.19 ha) (Table 10). On the contrast, agricultural land and degraded bush land increased from 6686.64 to 9830.43 ha by a net change of +3143.79 ha and 2425.14 to 6556.32 ha by a net change of +4131.18 ha, respectively. In this case, the degraded bush land was remarkably increased.
This significant declining of forest cover was as a result of different anthropogenic activities like deforestation, cutting of fuel wood by the local communities for construction; fuel wood and extensive cattle grazing have deformed the plants present in the study area to small bushes, degraded bush land and agriculture. For this to happen, a prolonged drought problem increases peoples to depend on forests. Moreover, during the assessment of the research, the respondents discussed that PFM is not inclusive of all communities and this leads people to extract forests. Even, some members of the forest user group reported that they are less satisfied to the advantage they got from PFM as there is less transparency in deciding benefit sharing and such ineffective management of forests also plays an important role in forest decline. The study is similar with report of Gobeze et al. (2009) in Bonga forest that indicated that because of the weak law enforcement, there is a continuous clash between members of forest user groups and others on access to the forest and use of its products. Another study from Kassa et al. (2009) in Chilimo forest also identified that without PFM, the resource base would have been severely degraded in less than ten years. This study also confirmed the reports of Butt et al. (2015) in Simly watershed, Islamabad, Pakistan that the vegetation area decreased over the past 20 years by 38.2% from 1992 to 2012 due to forest changed to settlements and agriculture.
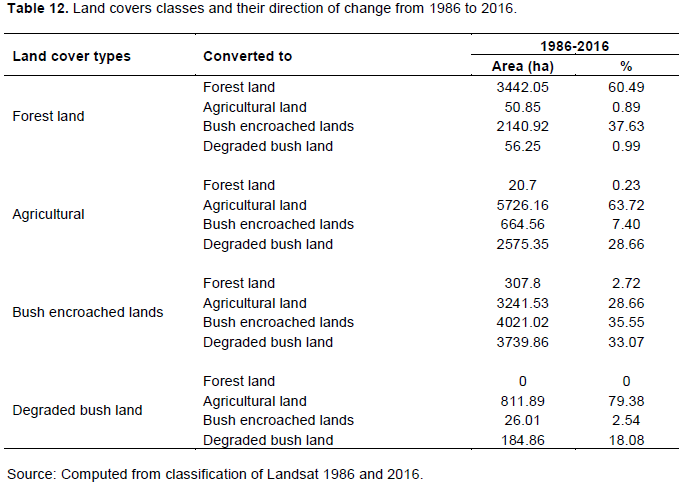
Land use land cover change detection analysis of 1986 to 2016
Similarly, between 1986 and 2016, the study observed a considerable decrease in forest land cover by -1919.52 ha and encroached bush land by -4457.7 ha, while slight increase in agricultural land by 843.66 ha and degraded bush land by 5533.56 ha (Table 11). During this period, a portion of forest cover was converted to agricultural land (50.85 ha), bush encroached land (2140.92 ha) and degraded bush land (56.25 ha) (Table 12). This forest conversion was due to increasing a number of anthropogenic factors/communities that depend on forests and forest products and also weak management of forests also plays an important role in forest decline. A similar results were also reported by FAO (2010) that forest loss was described to be around 8.3 and 5.2 m ha from 1990 to 2000 and from 2000to 2010, respectively. Since 2000 in average 5 m ha/year plantation still deforestation and forest degradation are serious global problems (Goll et al., 2014). Another study from Abate and Angassa (2016) indicates that, the range lands of Southern Ethiopia are adversely affected by increased human population pressure, encroachment of crop cultivation and bush encroachment.
CONCLUSIONS AND RECOMMENDATIONS
The present study showed that, land use land cover of the study area was at dynamic state and forests had undergone substantial changes during the last 30 years. As a result, the change detection analysis between 1986 and 1996 years revealed that forest cover was remarkably decreased; however, it is slightly increased during 1996 to 2006. This increase in forest cover was due to the establishment of participatory forest management and forest user group that conserving the forests and necessitate regeneration of seedlings and plantation of Juniperus procera was also carried out. Later on, due to the influence of human activities and weak implementation of participatory forest management, people extracts trees for different purposes as they want and the forest cover was significantly decreased during the periods of 2006 to 2016. Generally, between 1986 and 2016, a considerable decrease was observed in forest land cover and encroached bush land while slight increase in agricultural land and a significant increase in degraded bush land.
In most part of the forest, evidence of past exploitation (stumps) has been observed. This showed that the vegetation of the Yabello forest is disturbed through grazing and browsing by domestic livestock, agricultural expansion and other different human uses. Recognizing these issues as a possible future scenario underlines the need for effective utilization of the forest on sustainable bases will be assured. Thus, to ease the present human influence on forest and for future forest management on a sustainable basis, the following recommendations were made:
(1) Participatory forest management programs need to be strengthened so that local communities assume responsibility for the management and conservation of the forest, and remain as the beneficiaries of these activities
(2) Awareness needs to be given on the multipurpose use of forest resources and forest ecosystems
(3) Natural regeneration of species in the forest can be facilitated through reduced grazing/browsing pressure
(4) Training needs to be given for the community to diversify their financial resources to minimize dependency on forest and thereby minimize the impact of forest and land use land cover changes on their livelihoods.
(5) The planning and management of forests can be assisted with research findings, and therefore, more basic and applied researches need to be encouraged.
The authors have not declared any conflict of interests.
The author thanks Oromia Agricultural Research Institute for the opportunity and Jimma University for covering all the financial cost of this study. The author also appreciate Yabello Pastoral Dryland Research Center staff member for their unreserved encouragement. Special thanks also go to the Pastoralist and agro pastoralists of the study area, for sharing their wealth knowledge.
REFERENCES
|
Abate T, Angassa A (2016). Conversion of savanna rangelands to bush dominated landscape in Borana, Southern Ethiopia. Ecological Processes 5(1):6.
Crossref
|
|
|
|
Alemu B, Garedew E, Eshetu Z, Kassa H (2015). Land Use and Land Cover Changes and Associated Driving Forces in North Western Lowlands of Ethiopia. International Research Journal of Agricultural Science and Soil Science 5(1):28-44.
|
|
|
|
|
Anderson JR, Hardy EE, Roach JT, Witmer RE (1976). A land use and land cover classification system for use with remote sensor data. Vol. 964, US Government Printing Office.
Crossref
|
|
|
|
|
Angassa A, Oba G (2008). Effects of Management and Time on Mechanisms of Bush Encroachment in Southern Ethiopia. African Journal of Ecology 46(2):186-196.
Crossref
|
|
|
|
|
Anthony J, Viera Md, Joanne MG (2005). Understanding Inter observer Agreement: The Kappa Statistic. Family Medicine 37(5):360-363.
|
|
|
|
|
Assen M, Nigussie T (2009). Land Use/Cover Changes between 1966 And 1996 In Chirokella Micro-Watershed, Southeastern Ethiopia. East African Journal of Science 3(1):1-8.
Crossref
|
|
|
|
|
Berhan G (2005). Effects of Human Activities on Forests of Dry land of Western Ethiopia. Dryland Biodiversity Issue No 6.
|
|
|
|
|
Butt A, Shabbir R, Ahmad SS, Aziz N (2015). Land Use Change Mapping and Analysis Using Remote Sensing and GIS: A Case Study of Simly Watershed, Islamabad, Pakistan. The Egyptian Journal of Remote Sensing and Space Science 18(2):251-259.
Crossref
|
|
|
|
|
Central Statistical Agency (CSA) (2013). Federal Democratic Republic of Ethiopia. Population Projection of Ethiopia for All Regions at Woreda Level from 2014-2017. Addis Ababa.
|
|
|
|
|
Central Statistical Agency (CSA) (2016). Federal Democratic Republic of Ethiopia. Agricultural Sample Survey 2015/16 [2008 E.C.] Volume Ii. Report On Livestock and Livestock Characteristics (Private Peasant Holdings).
|
|
|
|
|
Coppock DL (1994). The Borana Plateau of Southern Ethiopia: Synthesis of Pastoral Research, Development and Changes, 1980-91 (No. 5). International Livestock Centre for Africa, Addis Ababa P 374.
|
|
|
|
|
Daniel J (2010). Effects of Bush Encroachment and Its Impacts on Selected Soil properties in Borana Rangeland, Ethiopia, M.Sc. Thesis, Hawasa University, WGCF & NR.
|
|
|
|
|
Deneke N (2007). Land Use and Land Cover Changes in Harenna Forest and Surrounding Area, Bale Mountains National Park, Oromia National Regional State, Ethiopia. Addis Ababa.
|
|
|
|
|
Dessie G, Kleman J (2007). Pattern and magnitude of deforestation in the South Central Rift Valley Region of Ethiopia. Mountain Research and Development 27(2):162-168.
Crossref
|
|
|
|
|
Ecological Society of America's Committee on Land Use (ESA) (2000). Ecological Principles and Guidelines for Managing the Use of Land. Ecological Principles the Ecological Society of America's Committee on Land Use. Ecological Applications 10(3):639-670.
Crossref
|
|
|
|
|
Food and Agricultural Organization (FAO) (2001). Global forest resources assessment (FRA 2000): main report, FAO for Rome. P 140.
|
|
|
|
|
Food and Agricultural Organization (FAO) (2010). Global Forest Resources Assessment Main report Rome.
|
|
|
|
|
Foody GM (2002). Status of Land Cover Classification Accuracy Assessment. Remote Sensing of Environment 80(1):185-201.
Crossref
|
|
|
|
|
Gobeze T, Bekele M, Lemenih M, Kassa H (2009). Participatory Forest Management and its Impacts on Livelihoods and Forest Status: The Case of Bonga Forest in Ethiopia. International Forestry Review 11(3):346-358.
Crossref
|
|
|
|
|
Goll II, Nick B, Li J, McKay J, John S (2014). Analysis on the Causes of Deforestation and Forest Degradation in Liberia: Application of the DPSIR framework. Research Journal of Agriculture and Forestry Sciences 2(3):20-30.
|
|
|
|
|
Houghton RA (1994). The Worldwide Extent of Land-Use Change. Bioscience 44(5):305-313.
Crossref
|
|
|
|
|
International Geosphere-Biosphere Programme (IGBP) (1999). "Land-Use and Land-Cover Change (LUCC) Implementation Strategy, International Geosphere-Biosphere Programme." (No. 48).
|
|
|
|
|
Irwin BC, Mitiku T(2004). Establishing New Forest Management Systems for the Dry Evergreen Forests of Borana, South Ethiopia: An examination of SOS Sahel's Borana Collaborative Forest Management Project. In learning and achieving, paper prepared for an international symposium on the rehabilitation of Dryland forests in Ethiopia: Ecology and Management. Available at:
View
|
|
|
|
|
Kassa H, Campbell B, Sandewall M, Kebede M, Tesfaye Y, Dessie G, Seifu A, Tadesse M, Garedew E, Sandewall K (2009). Building future scenarios and uncovering persisting challenges of participatory forest management in Chilimo Forest, Central Ethiopia. Journal of environmental management, 90(2):1004-1013.
Crossref
|
|
|
|
|
Kebebew Z (2012). FARM Africa, Natural Resource Management Programme Chilimo Forest change analysis. Available at:
View
|
|
|
|
|
Lemlem A (2007). Assessing the Impact of Land Use and Land Cover Change on Groundwater Recharge Using Rs and Gis; A Case of Awassa Catchment, Southern Ethiopia. Available at: View
|
|
|
|
|
Mesele S, Gebrekidan H, Gizachew L, Coppock DL (2006). Changes in land cover and soil conditions for the Yabello District of the Borana Plateau, 1973-2003. Research Brief 06-06-PARIMA. Global Livestock Collaborative Research Support Program. University of California, Davis. 4 pp.
|
|
|
|
|
Mohammed HY (2014). The Influence of Land Use and Cover Changes on the Pastoral Rangeland Systems of Southern Ethiopia.
|
|
|
|
|
Shalaby A, Tateishi R (2007). Remote sensing and GIS for mapping and monitoring land cover and land-use changes in the Northwestern coastal zone of Egypt. Applied Geography 27(1):28-41.
Crossref
|
|
|
|
|
Solomon MM (2016). Effect of Land Use Land Cover Changes on the Forest Resources of Ethiopia. International Journal of Natural Resource Ecology and Management 1(2):51-57.
|
|
|
|
|
Tamene Y (1990). Population dynamics of the problem shrubs, Acacia dropanolobium and Acacia brevispica in the southern rangelands of Ethiopia. Master's Thesis, University of New South Wales. 237 p.
|
|
|
|
|
Tekle K, Hedlund L (2000). Land Cover Changes between 1958 and 1986 in Kalu District, Southern Wello, Ethiopia. Mountain Research and Development 20(1):42-51.
Crossref
|
|
|
|
|
Tesfaye S, Guyassa E, Joseph Raj A, Birhane E, Wondim GT (2014). Land use and land cover change, and woody vegetation diversity in human driven landscape of Gilgel Tekeze Catchment, Northern Ethiopia. International Journal of Forestry Research 614249:10.
Crossref
|
|
|
|
|
Zeleke AA (2009). Bush Encroachment and Its Impacts on Plant Biodiversity in the Borana Rangeland (Doctoral dissertation, Addis Ababa University).
|
|
|
|
|
Zeleke G (2000). Landscape Dynamics and Soil Erosion Process Modeling in the North-Western Ethiopian Highlands. PhD. Dissertation, University of Bern, Switzerland 201 p.
|
|
|
|
|
Zeleke G, Hurni H (2001). Implications of land use and land cover dynamics for mountain resource degradation in the Northwestern Ethiopian highlands. Mountain Research and Development 21(2):184-191.
Crossref
|
|