ABSTRACT
Forest trees and soil are considered for climate change mitigation. Forest structure of the grove is required to predict its capacity to mitigate climate change. Therefore, the objective of this study was to determine the forest structure and carbon stocks of Osun-Osogbo Sacred grove. Five (30 × 30 m2) plots were demarcated in Old-growth forest (OF) and Re-growth forest (RF). Trees with ≥10 cm diameter-at-breast-height (dbh) were identified to species level and enumerated. Tree height and dbh were measured and stem volumes were converted to carbon stock. Soil samples were collected with cores at three soil depths, oven-dried and carbon content estimated. The tree species diversity and richness indices of OF was higher than OR. Diameter distribution of OF and RF expressed reverse J-shaped and rotated sigmoid curves, respectively. The stem carbon stock ranged from 0.12±0.00 (OF) to 0.02±0.00 Mg/ha (RF). The soil carbon stock ranged from 0.65 (OF) to 0.90 Mg/ha (RF). Stand structure of OF was more develop than RF. The OF and RF contained high stem and soil carbon stocks, respectively. Forest structure enhances stem carbon stock of Old-growth forest while soil of Re-growth forest is also an option for carbon sequestration.
Key words: Carbon sequestration, stem diameter distribution, carbon stock, forest structure, old-growth forest.
Climate change is recognized to be one of the most adverse global environmental problems (Tashi, 2017; Anand, 2013). Climate change is causing unpredictable weather extremes and natural disasters, such as: intense drought, wildfires, wild-winds, irregular rainfall patterns and flooding in most countries. However, one of the inexpensive ameliorative strategies of climate change is the sequestration of carbon dioxide through photosynthesis by forest trees and subsequent deposition in soil. The contribution of tropical forests to carbon sequestration is imperative, because of the magnitude and capacity of biomass and soil carbon pools that can absorb the sequestered CO2 (Oades, 1988). Hence, there is a balanced distribution and transfer of carbon between these components of carbon stocks; however, if this flux is disturbed, carbon stocks can become carbon sources.
Sacred groves are forests protected by people for spiritual and cultural practices, and thus completely protected from human interference (Israel et al., 1997). Cultural rites and religious rituals perpetuated in the groves confer protection on it and also help to ensure the protection of the vegetation of the sacred grove, maintaining it in pristine condition (Sukumaran et al., 2008). According to Baraiah et al. (2003), sacred groves harbour a high diversity of medicinal plants and tree stems than forest reserves.
Forest structure is described as the spatial and vertical distribution of the forest stems and species diversity (Akpata and Okali, 1986; Miren et al., 2004). Structure and canopy of forests provide numerous micro-climatic conditions for diverse ecosystem functions and services. The structure of a forest is a good indicator of its capacity to deliver ecosystem goods and services. Ecosystem services are the benefits people obtain from ecosystem (Chandler, 2016). However, the effect of forest structure on the carbon sequestration capacity of Osun-Osogbo Sacred Grove is yet to be clarified. Moreover, less evidence is available on the effect of forest structure on carbon storage capacity of stem biomass and soil of the Osun-Osogbo Sacred Grove.
There are different views on the carbon sequestration capacity of surface soil and its subsoil layers. Some studies suggested that soil carbon sequestration is restricted to the top soil (<15 cm) (Fang et al., 2015) while others argue that the carbon stock of deep soil layers within a depth of 10 to 35 cm are more stable than top soil, though their process of carbon stabilization may differ. However, it is imperative to determine the carbon stock of the soil surface, sub-surface and the deep soils, with a view to enhancing soil carbon sequestration capacity of Osun-Osogbo Sacred Grove. The study was conducted to investigate the forest structure and carbon stocks of Osun-Osogbo Sacred Grove with a view to developing a management strategy for optimizing its carbon sequestration capacity.
The study area
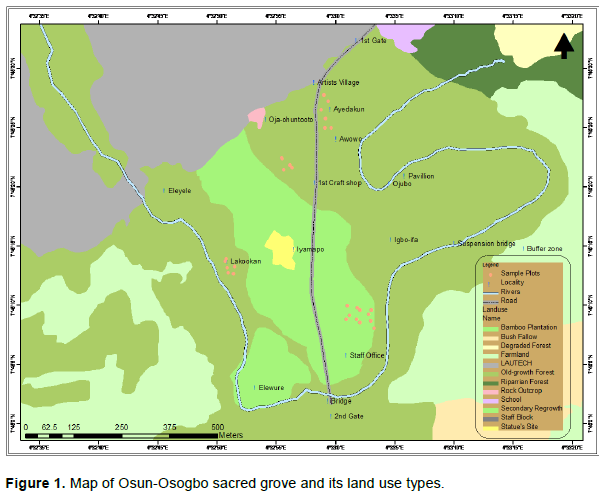
The Osun-Osogbo Sacred Grove is a primary forest and located in lowland rainforest zone of Nigeria. It covers an area of 75 ha on the outskirts of Osogbo city along the Osun River; and it is regarded as the abode of the Yoruba goddess of fertility. The grove is located within Latitudes 7°45´0´´ and 7°45´30´´N and Longitudes 4°32´35´´ and 4°33´30´´E on the banks of River Osun (Figure 1) in the southern part of Osogbo town, about 2 km from Ataoja’s Palace/Oba’s market on Adunni Hill slope. It was established during the second settlement of Osogbo in Ohuntoto forest and it is culturally and legally protected by Decree 77 of 1988 (UNESCO-WHC, 2017).
The Osun River drains its basin in a north-south direction and passes out the grove south-east wards. The underlying rocks of the river bed are of Precambrian formation and are exposed in several parts of the grove during the dry season when the river breaks into pools or lakes. There are deposits of alluvial soils at the banks of the river and at the lower slopes (Aigbe et al., 2014). The grove experiences two seasons, which are the rainy and dry seasons. The rainy season is between March and October and dry season lasts from November to March. The mean annual rainfall is above 1000 mm; while relative humidity is generally high, often greater than 60% during the day, and less than 70% at night. The temperature is generally high 22 to 35°C; and the effects of the Harmattan season is usually mild in the grove (UNESCO-WHC, 2017). The grove has a mature, undisturbed forest canopy, which supports a rich and diverse flora and fauna; and is referred to as an Old-growth forest. Some parts (around Iyamapo shrine and staff office) were reported by local residents to be cleared and used for agricultural purposes, and later abandoned. This portion of the grove is referred to as second re-growth forest, which originated following clearance for agricultural settlement in the 1950s and abandon for over 50 years at the time of sampling.
Data collection
Five sample plots (30×30 m2) were demarcated in each of the identified forest types; Old-growth and Re-growth forests. The boundary of each sample plot was marked with wooden pegs and red twine. Tree stems ≥10 cm diameter-at-breast height (dbh) were identified to species level and enumerated. The stem dbh and height were measured and categorized into diameter and height classes. Also, the diameter-at (-base, -middle and -top) were measured using Spiegel relaskop (Bitterlich model).
Flora of West Tropical Africa (Hutchinson et al., 2014) was used for the identification and authentication of tree species composition on the field with the help of taxonomist. Plant part of those that could not be identified on the field was collected and pressed and compared with collections of reference available in the Herbarium of the Forestry Research Institute of Nigeria (FRIN).
Therefore, forest structure of the grove is described by stem height and diameter class distributions and species diversity. Most matured rainforests are multi-layered with five distinct strata (Whitmore, 1993) and therefore the height of tree stems were categorized into height classes expressed as (Whitmore, 1993):
(1) Emergence tree stems (≥ 36 m and above)
(2) Upper Canopy tree stems (26-35 m)
(3) Middle Canopy tree stems (16-25 m)
(4) Lower Canopy tree stems (6-15 m)
(5) Ground Level tree stems (0-5 m).
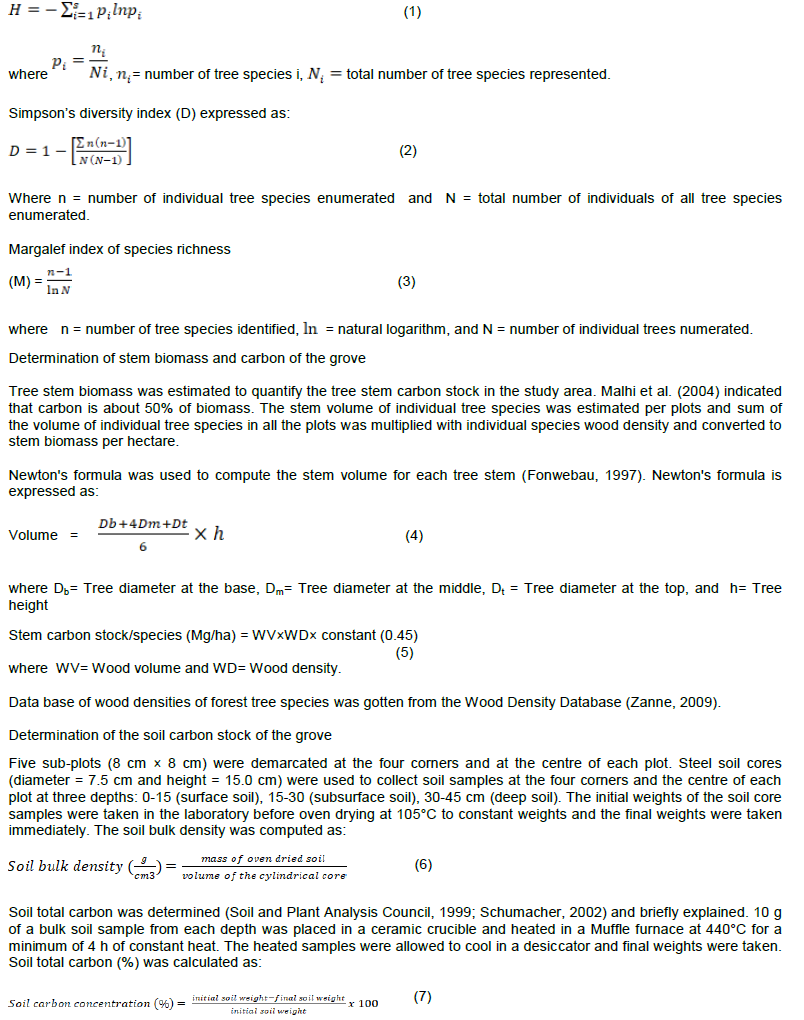
Tree species diversity in the sampled plot was assessed using the Shannon-Weiner and Simpson diversity indices and Margalef index of species richness (Huang et al., 2003). In addition to Margalef index, number of tree species composition in Old-growth and Re-growth forests was as index of species richness.
Shannon-Weiner diversity index (H´):
Forest structural attributes
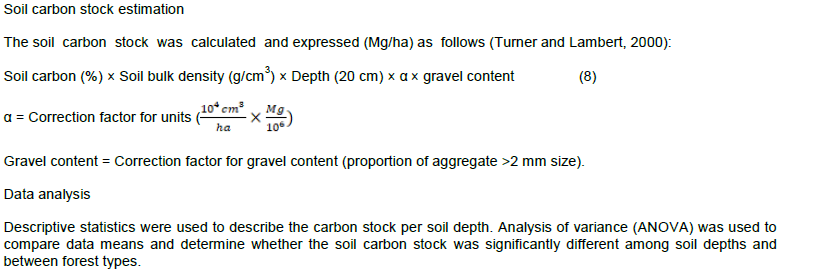
A total of 75 tree species representing 30 families was found in the Osun-Osogbo Sacred Grove. A total of 55 tree species (species richness) was recorded in Old-growth forest while 35 tree species (species richness) was found in Re-growth forest (Table 1). The mean basal area of Old-growth forest (3.74 m2/ha) was higher than that of Re-growth forest (1.39 m2/ha). Also, Old-growth forest contained more stem carbon (0.12±0.00 Mg/ha) than Re-growth forest (0.02±0.00 Mg/ha). Funtumia elastica had the highest stem density, followed by Cola millenii in Old-growth and Re-growth forests.
Tree stem height class distribution
For this study, forest structure of the grove was described by stem height and diameter class distributions and species diversity. In this way, stem heights were classified into five distinct height classes in each identified forest. Lower canopy layer (6-15 m) had the highest stem density of 258 and 217 stems/ha in Old-growth and Re-growth forests, respectively, followed by Middle canopy (16-25 m) while the least stem density was in emergent (≥ 36 m). There was no tree stem in the emergent height class of Re-growth forest (Figure 2). However, the stem density of Old-growth at ground level was approximately five times the Re-growth forest. Stem density of the Old-growth forest was higher than the Re-growth forest at the identified five distinct height classes. Therefore, there was a difference in stem density between Old-growth and Re-growth forests at ground level, middle canopy, upper canopy and emergent layer. Also, there was a significant difference in stem density within the height classes of Old-growth and Re-growth forests. The ground level and lower canopy of Old-growth forest contained mostly ingrowths or newly-recruited, young tree stems.
Diameter distribution of the tree stems
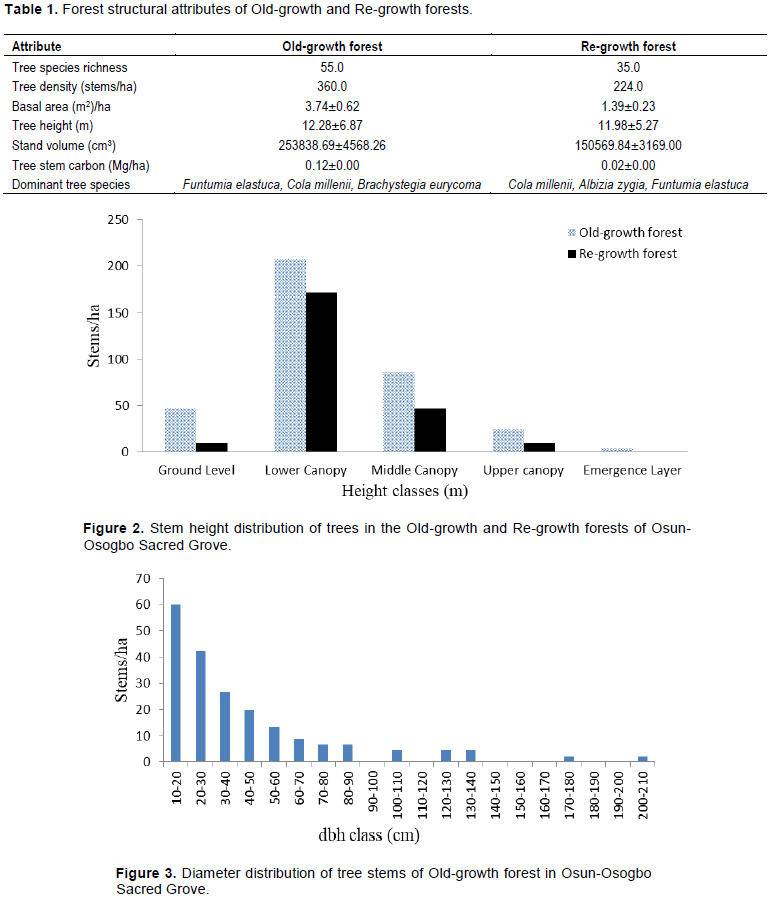
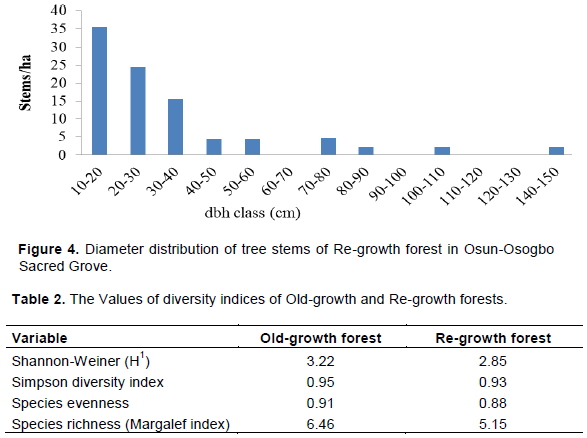
There was a difference in diameter distribution of Old-growth and Re-growth forests, if the larger dbh trees are considered in the comparison. The class (10-20 cm dbh) contained the highest stem density in Old-growth forest (29.6% of stems) and Re-growth forest (36.0% of stems) while the least stem density occurred at diameter class of 200 to 210 cm of Old-growth and 100-110 and 140-150 cm of Re-growth forest (Figures 3 and 4). Although diameter classes of 90-100, 110-120, 140-170, and 180-200 cm dbh were not represented in Old-growth forest because no stem was found in these classes (Figure 3). The dbh distribution of Old-growth forest was extended to 200 to 210 cm dbh and therefore expressed extended reverse J-shaped curve. Similarly, the dbh distribution of Re-growth forest was extended to 140 to 150 cm dbh and therefore expressed rotated sigmoid curve.
The values of Shannon-Weiner diversity index for the Old-growth and Re-growth forests were 3.22 and 2.85, respectively (Table 2). Also, the values of Simpson diversity index for Old-growth and Re-growth forests were 0.95 and 0.93, respectively; while the species evenness for the Old-growth and Re-growth forest types were 0.91 and 0.88, respectively. The mean values of Margalef index of species richness were 6.46 and 5.15 for the Old growth and Re-growth forests, respectively. The values of tree species diversity were higher in Old-growth forest than Re-growth forest. These indicated that Old-growth forest has a stable structure.
Soil physical properties at different depths of Osun-Osogbo Sacred Grove
The value of soil bulk density of Old-growth forest ranged from 1.40±0.16 to 1.71±0.11 g/cm3 with a mean of 1.60±0.132 g/cm3 (Table 3). Also, soil bulk density of the Re-growth forest ranged from 1.41±0.09 to 1.70±0.10 g/cm3 with a mean of 1.65±0.10 g/cm3 (Tables 3 and 4). These indicate that value of bulk density increased with increase in soil depth in both forest types. However, the Re-growth forest had higher value of soil bulk density than Old-growth forest at the surface and deep soil depth. The least and highest values were obtained in surface and deep soil of Old-growth forest, respectively. The surface soil of the Old-growth forest, with the least soil bulk density, had the highest and least proportions of sand and clay, respectively. There was no difference in the soil textural classes among soil depths but showed variation in the proportion of sand, silt and clay. Hence, high proportion of sand may be attributed to bulk density at the surface soil depth of the Old-growth.
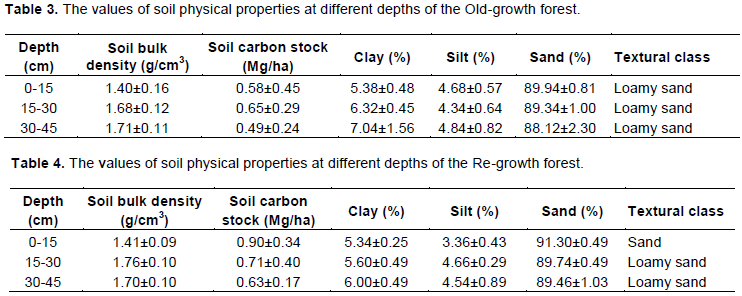
The carbon stock of the Re-growth forest decreased with increase in soil depth. The surface, subsoil and deep soil of the Re-growth forest contributed 40.17, 31.69 and 28.12% of the total soil carbon stock across three depths down to 45 cm, respectively (Table 4). The proportion of sand decreased and clay increased with increase in soil depth. Soil carbon stock of the Re-growth forest decreased from surface to subsoil (22.2%) and subsoil to deep soil (11.26%). The surface soil of the Re-growth forest, with the least bulk density, had the highest proportions of carbon stock and sand. The surface, sandy soil is more coarse in texture than the underlying loamy soil layers in the Re-growth forest.
Funtumia elastica and Cola millenii are dominant species in the two forest types. Dominant species are species that had wide adaptation and tolerance capability to most micro-sites in the grove. The high value of species diversity and richness in the Old-growth forest was probably due to the presence of numerous micro-climatic conditions and differences in habitat preference among the species, which enhances the high association of various resident tree species. The high richness and diversity of tree species within a forest is caused by numerous micro-sites and niches for various tree species. This is because tree species vary in their ecological requirements (Huang et al., 2003; Whitmore, 1993). Therefore, it implied that the Old-growth forest presented more micro-sites than the Re-growth forest. According to the value of the Shannon-Weiner and Simpson diversity indices, the Old-growth forest was more stable and resilient than the Re-growth forest. Also, it indicates that abundance and stem density of trees were relatively high in the Old-growth forest, which suggests stability and a balanced ecosystem. An ecosystem is stable if its structure and function remain almost the same or that it quickly returns to equilibrium after disturbance. The Old-growth forest can be described as a primary Old-growth forest, because important attributes of Old-growth include the presence of large diameter trees (Figure 2) and noticeable abundance of dead wood (snags and logs) that were observed during the field work. These attributes characterize Old-growth forests and were confirmed by studies of Piovesan et al. (2005). According to Maguran et al. (2013), the species evenness is a key measure of the community structure and it shows closeness in abundance of resident plant species. Although both forests have a high value of species evenness, the species evenness of the Old-growth forest was higher than the Re-growth forest. High species evenness implies that there was little or no rare species in the grove.
The stem density at five canopy layers of the Old-growth was higher than the Re-growth forests. The lower canopy stratum was well developed in the grove and contained closely growing plant stems. The suppressive effect of this layer probably led to extreme reduction of stem density at ground level in the grove. The stem size distribution of both Old-growth forests expressed an extended reverse J-shaped curve; while Re-growth forests expressed a rotated sigmoid curve. A rotated sigmoid stem size distribution is characterized by a steep decrease in tree density in smallest and largest diameter classes and a plateau or no representation in the middle diameter classes (Piovesan et al., 2010). Westphal et al. (2006) confirmed that forests lacking large stems are more likely to show a rotated sigmoid form of diameter distribution. This indicated that few trees were available at higher dbh classes but many small dbh stems were available in the forest.
The Old-growth forest showed high stem density in the lower stem dbh class (10-20 cm) followed by a gradual decrease and few representatives in the middle classes. This indicates numerous ingrowths and good reproduction, but low recruitment in intermediate classes. The intermediate classes were poorly represented, but the upper limit class (200-210 cm dbh) was represented.
However, the Re-growth forest showed high stem density in the lower dbh class followed by a rapid decrease and a few representatives in the middle class. This suggests good reproduction but discontinuous recruitment. Lack of middle class in the population clearly indicates that there were few stems of reproductive size, and this can retard the regeneration rate. Re-growth forests lack trees of size 60-70 and 90-100 cm dbh. It suggests good reproduction but bad recruitment. Therefore, the distribution of stem size classes in Old-growth was significantly different from that in the Re-growth forests at large dbh classes. However, there was high stem density of smaller dbh stems in Old-growth and Re-growth forests. High stem density at lower canopy and small dbh classes in the grove suggest intense competition for light and space among recruits and ingrowths of Old-growth and Re-growth forests. Old-growth forests had high values of tree diversity indices and height distribution. This confirmed the study of Huang et al. (2003) that forest structure and species composition influence species diversity and also high species diversity is often related to more complex vertical structure.
Soil carbon stock of the Old-growth forest initially increased from surface (0-15 cm) depth to subsurface (15-30 cm) layer and decreased to the deep (30-45 cm) layer. Therefore, subsurface (15-30 cm) depth had the highest soil carbon stock in the Old-growth forest. However, soil carbon stock of Re-growth forest decreased with increase in soil depth. Hence, highest and least soil carbon stocks of the Re-growth forest occurred in surface (0-15 cm) and deep (30-45 cm) layers, respectively. This indicates that there are different factors responsible for the accumulation of carbon in the two forest types. Movement of dissolved organic carbon derived from litter decomposition and high proportion of sand may be responsible for carbon accumulation in the Old-growth forest. Overall, the amount of soil carbon stock of the Re-growth forest was higher than Old-growth forest. This is probably because of its close proximity to the Osun-Osogbo water body, which passes through the Re-growth forest. Manns et al. (2016) revealed that soil that remains moistened for most times of the year has potential for carbon accumulation and stabilization. Hence, a developed forest structure of the Old-growth forest may have influenced tree stem carbon; but was unable to enhance soil carbon stock. This confirmed the study of Hobley and Wilson (2016) that high soil carbon stock at soil surface may be controlled by water availability above field capacity, which limits plant growth and favours soil carbon accumulation. Hu et al. (2015) also reported that different mechanisms may be responsible for the accumulation of stand biomass carbon and soil organic carbon in tropical forests. Therefore, forest structure may not determine the amount of soil carbon stock of the grove.
CONCLUSIONS AND RECOMMENDATIONS
Forest structure of the Old-growth forest showed five distinct height strata and sustained high tree species diversity with negative exponential diameter distribution. Therefore, the structural attributes of the Old-growth forest were more developed than the Re-growth forest. Old-growth and Re-growth forests showed large tree stem carbon and soil carbon stock, respectively. Therefore, structural attributes of the Old-growth forest may have influence its tree-stem carbon and not the soil carbon. Hence, Old-growth forests can be considered advantageous for tree stem carbon reservoir, and Re-growth forest for soil carbon reservoir. The tree stems and soil components of Osun-Osogbo sacred grove are important carbon reservoirs for climate change mitigation. The grove is rich in vascular species diversity but diameter distribution indicated there is poor growth and inadequate self-replacement of adult and emergent tree stems. Gap creation and appropriate cultural practices should be undertaken to improve the regeneration of the emergent species.
The authors have not declared any conflict of interests.
REFERENCES
|
Aigbe HI, Akindele SO, Onyekwelu JC (2014). Tree species diversity and density pattern in Afi River Forest Reserve, Nigeria. International Journal of Scientific and Technology Research 3(10):178-188.
Crossref
|
|
|
|
Akpata TVI, Okali DUU (1986). Nigeria wetlands Man and Biosphere. The Nigerian man and Biosphere National Committee and UNESCO held at the conference Hall of Federal Secretariat on13th July River state, Nigeria P 197.
|
|
|
|
|
Anand SV (2013). Global environmental issues. Scientific Reports 2:632.
|
|
|
|
|
Baraiah KT, Vasudewa R, Bhagwat SA, Kushadappa CG (2003). Do Informal Managed Sacred Groves Have Higher Richness and Regeneration of Medicinal Plants than State Managed Research Forests? Current Science 84:804-808.
|
|
|
|
|
Chandler RD (2016). Soil oraganic carbon distribution with depth: Implications for ecosystem services. M.Sc thesis in Graduate School, University of Clemson, USA P 49.
|
|
|
|
|
Fang XM, Chen FS, Wan SZ, Yang QP, Sh JM (2015). Topsoil and deep soil organc carbon concentration and stability vary with aggregate size and vegetation types in subtropical China. PLoS ONE 10(9):E0139380.
Crossref
|
|
|
|
|
Fonwebau JN (1997). Effect of log formula, log length and method of measurement on the accuracy of volume estimate for three tropical timber species in Cameroon. Commonwealth Forestry Review 76(2):114-120.
|
|
|
|
|
Hobley EU, Wilson B (2016). The depth distribution of organic carbon in the soil of eastern Australia. Ecosphere 7(1):1-21.
Crossref
|
|
|
|
|
Hu Y, Su Z, Li W, Li J, Ke X (2015). Influence of tree species composition and community structure on carbon density in a subtropical forest. PLos ONE 10(8):e0136984.
Crossref
|
|
|
|
|
Huang W, Pohjonen V, Johasson S, Nashanda M, Katigula MIL, Luukkanen O (2003). Species diversity, forest structure and species composition in Tanzanian tropical forests. Forest Ecology and Management 173:111-124.
Crossref
|
|
|
|
|
Hutchinson J, Dalziel JM, Keay RWJ, Hepper FN (2014). Flora of West Tropical Africa.Volume 1 Part 2. Royal Botanic Garden Kew, London, UK 330 p.
|
|
|
|
|
Israel EDOI, Vijin C, Narasimhan D (1997). Sacred groves: traditional Ecology heritage. International. Journal of Ecology and Environment Science 23:463-470.
|
|
|
|
|
Maguran AE, Queiroz HL, Hercos AP (2013). Relationship between evenness and body size in species rich assemblage. Biology Letters 9:20130856.
Crossref
|
|
|
|
|
Manns HR, Parkiin GW, Martin RC (2016) Evidence of a union between organic carbon and water content in soil. Canadian Journal of Soil Science 96:305-316.
Crossref
|
|
|
|
|
Malhi Y, Baker TR, Phillips OO, Almeida S, Alvarez E, Arroyo L, Chave J, Czimczik CI, Di Fiore A, Higuchi N, Killeen TJ, Laurence SG, Laurence WF, Lewis SL, Mercado LM, Monteagudo A, Neil DA, Nunez-Vargas P, Patino S, Pitman NCA, Alberto Quesada C, Silva N, Torres Lezama A, Vasquez Martinez R, Terborgh J, Vinceti B, Lloyed J (2004) The above-ground coarse woody productivity of 104 Naotropical forest plots. Global Change Biology 10:563-591.
Crossref
|
|
|
|
|
Miren O, Domingueza I, Albizu I, Garbisu C, Amazaga I (2004). Vegation diversity and vertical structure as indicators of forest disturbance. Forest Ecology and Management 195(3):341-354.
Crossref
|
|
|
|
|
Oades JM (1988). The retention of organc matter in sols. Biogeochemistry 5:35-70.
Crossref
|
|
|
|
|
Piovesan G, Alessandrin A, Baliva M, Chiti T, O'Andrea E, De'Cinti B, Filippo AD, Hermanin L, Lauteri M, Mugnozza GS, Schirone B, Ziaco E, Matteucci G (2010). Structural patterns, growth processes, carbon stocks in Italian network of Old-growth beech forests. Italian Journal of Forest and Mountain Environments 65(5):552-590.
Crossref
|
|
|
|
|
Piovesan G, Di Filippo A, Alessandrini A, Biondi F, Schirone B (2005). Structure, dynamics and endroecology of an Old-growth Fagus forest in the Apennines. Journal of Vegetation Science 16(1):13-28.
Crossref
|
|
|
|
|
Schumacher BA (2002). Methods for the determination of total organic carbon in soils and sediments. Ecological Risk Assessment Support Center, United State Environmental Protection agency (USPA) P 22.
|
|
|
|
|
Soil and Plant Analysis Council (1999). Soil Analysis handbook of reference methods. First edition. CRC Press LLC, Florida, USA P 178.
|
|
|
|
|
Sukumaran S, Jeeva S, Raj ADS, Kannan D (2008). Floristic diversity, conservation status and economic value of miniature sacred groves in Kanyakumari; District, Tamil Nadu, Southern Peninsular India. Turkey Journal of Botany 32:185-199.
|
|
|
|
|
Tashi S (2017). Soil carbon stocks under different forest types in Bhutan. Eastern Himalayas. A phD thesis in Faculty of Agriculture and Environment, University of Sydney P 185.
|
|
|
|
|
Turner J, Lambert M (2000). Change in organic carbon in forest plantation soils in eastern Australia. Forest Ecology and Management 133: 231-247.
Crossref
|
|
|
|
|
United Nations Educational, Scientific and Cultural Organisation, and the World Heritage Conservation (2017). Osun-Osogbo Sacred Grove. http://Whc.unesco.org.
|
|
|
|
|
Westphal C, Tremer N, Oheimb GV, Hansen J, Gadow KV, Hardle W (2006). Is the reverse J-shaped diameter distribution universally applicable in European virgin beech forests. Forest Ecology and Management 223:75-83.
Crossref
|
|
|
|
|
Whitmore TC (1993). An Introduction to Tropical Rain Forest. Oxford: ELBS with Oxford University Press P 296.
|
|
|
|
|
Zanne AE (2009). Global wood density database.
|
|