ABSTRACT
Wildlife populations in Africa are declining rapidly because of natural and human – induced causes. Large animal aerial counts were done in 2010 and 2013 wet and dry season in Mid Kenya/ Tanzania borderland. These counts came after the severe droughts of 2007 and 2010 and so they were critical also in establishing the effects of droughts on large mammal populations. Of the 15 common large mammals seen in the borderland, the five most abundant large wild mammals were the common zebra, common wildebeest, Grants gazelle, the Maasai giraffe, and the common eland respectively but the five rare were the common waterbuck, the common warthog, the lesser kudu, gerenuk, and the olive baboon. Based on the numbers and rate of decline, species of conservation concern were common waterbuck, olive baboon, buffalo, common warthog, lesser kudu and African elephant respectively. Elephant numbers in Amboseli stood at 1,145, much higher than Magadi / Namanga (69), West Kilimanjaro (67) and Lake Natron area (27) of the estimated 1,308 in the borderland. Amboseli area led in numbers, proportion and density, but had the lowest values on population growth. It is recommended that species that are declining have focused conservation action. For West Kilimanjaro and Lake Natron area, poaching and habitat degradation should be addressed. Consistent cross border monitoring should continue to animal establish trends and performance of ecosystems in the borderland.
Key words: Amboseli, effect of droughts, Lake Natron, Magadi / Namanga, West Kilimanjaro, Wildlife status and trends.
Abbreviation:
Wildlife conservation in Kenya - Tanzania borderland began during the British colonial rule and continued after independence in 1963 (Norton-Griffiths, 1978). This has seen nearly 8% of the country set aside for biodiversity conservation purposes (Kenya Wildlife Service, 1994), and plans are underway to have additional landscapes designed as wildlife conservation areas. This is in recognition of the key role played by tourism in foreign revenue generation through tourism (Republic of Kenya, 1999; Okello and Novelli, 2014). Although numerous strategies and financial resources have been used to enhance wildlife conservation, there is rampant popula-tion decline of numerous species throughout the country such as the African elephant (Loxodonta africana), black rhino (Diceros bicornis), gravy zebra (Equus grevyi), and large carnivores especially lion (Panthera leo) and cheetah (Acynonix jubatus), various species of monkeys, hirola antelope among others (Western et al., 2009a).
Numerous studies have examined the causes of decline of wildlife populations in different parts of Kenya - Tanzania borderland (Ottichilo et al., 2000, 2001; Okello and Kiringe, 2004; Western et al., 2009a). Collectively, these studies reveal that a myriad of anthropogenic factors such as; human-wildlife conflicts, illegal wildlife poaching, bush meat activities, increase in human population, alienation or inadequate involvement of locals in conservation initiatives and programs, proliferation of inappropriate land uses like agriculture which compromise wildlife survival and its conservation are responsible for the decline of wildlife. However, the contribution of drought to wildlife decline has not been fully evaluated yet its effects on populations can be devastating just like human related impacts.
In the last century, most parts of Kenya - Tanzania borderland, more so the high potential and heavily human populated have seen tremendous decline and loss of large mammalian wildlife species. However, the borderland Ecosystems are mainly semi-arid region, which until recently was characterized by relatively low and sparse human population is still endowed with diverse free ranging wildlife species. Two major factors have interactively contributed to preservation of wildlife in the ecosystem, elephants included; a semi-arid environment which acts an ecological limitation to land use especially proliferation of rain-fed agriculture, lifestyle, culture and traditions of the Maasai people who are the main inhabitants. The foundation of the Maasai lifestyle is pastoralism which thrives in relatively dry areas and allows livestock and wildlife to co-exist which makes it compatible with wildlife conservation (Berger, 1993; Ntiati, 2002). Further, overtime, various taboos and traditional briefs which abhors eating and indiscriminate killing of wildlife involved among the Maasai, an aspect which has equally contributed to wildlife preservation over the years (Seno and Shaw, 2002; Kangwana, 2011).
Globally, the percentage of land under drought has risen dramatically in the last 25 years, and the incidents of drought, both short and long term, has been rising in Africa (Conway, 2008), including the many ecosystems in the borderland region (Altmann et al., 2002; Thompson et al., 2009). Given the arid to semi-arid nature of the region, droughts can be lead to massive mortality of wildlife especially water dependent species and those which require large amounts of daily food intake. In this regard, the 2007 to 2009 drought in the region provided an opportunity to examine the influence of global climate change on elephants and other key large herbivorous wildlife species, based on data collected during the dry season of 2007, 2010 and 2013.
This research focused on the impact of the 2007 to 2009 drought on population size of key large mammalian wildlife species in the Kenya - Tanzania borderland. It also sought to establish the number and distribution of these key species in the four landspaces on the Kenya / Tanzania borderland. The findings provided insights on appropriate strategies that can be used to mitigate the threat posed to wildlife by droughts and general climate variability that have become common in the ecosystem. Specifically, it addresses the following objectives:i) Determine the current population size of key large mammals in the borderland; ii) Determine the current distribution of key large mammals in the various landscapes of the borderland; iii) Assess the population recovery of key large mammals after the 2007 to 2009 droughts in the borderland area and iv) establish which key large mammal species are of conservation concern and which ones are not following drought – related mortality in the borderland for possible management intervention.
Study area
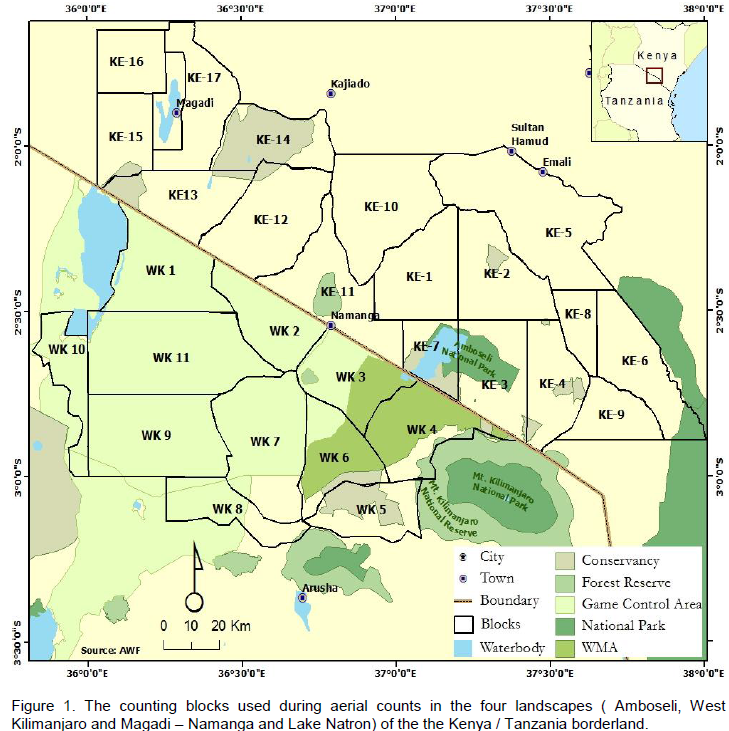
The Southern Kenya region comprises of Amboseli National Park, adjoining Maasai group ranches and private lands in the Oloitokitok area along the Kenya-Tanzania border, Namanga, Magadi and Nguruman in the southern part of Kajiado County approximately 8797 Km2, (Figure 1). On the Tanzania side, it is made up of the Natron and West Kilimanjaro landscapes, and the entire borderland covers an area of >25,000 Km2. The region has in the recent past experienced a rapid increase in human population particularly in the group ranches and along the slopes of Mt. Kilimanjaro (Ntiati, 2002; Reid et al., 2004; Okello and D’Amour, 2008). Further, it has also experienced widespread land use changes over the past 30 years in response to a variety of economic, cultural, political, institutional, and demographic processes (Reid et al., 2004). Pastoralism is mostly practiced by the predominantly Maasai people in the borderland has continued to decline forcing the community to turn to farming like other ethnic groups (Ntiati, 2002; Okello, 2005; Okello and D’Amour, 2008).
Most of the Amboseli region is classified as ecological zone VI and is characterized by a semi-arid environment, with most of it being suitable for pastoralism and wildlife conservation (Pratt and Gwynne, 1977). It has a bimodal rainfall pattern but the average annual rainfall is quite low ranging between 400 to 1000 mm (Reid et al., 2004). The long rains are normally received at the beginning of the year (between March and May) while the short rains occur at the end of the year (end of October and mid-December) (Western, 1975; Okello and D’Amour, 2008). Thus, rainfall is the key determinant of land use practices in the entire region (Ntiati, 2002; Okello, 2005). Surface water availability is sparse and the hydrology is mostly influenced by Mt. Kilimanjaro. Generally, vegetation of the region is typical of a semi-arid environment, with some of the dominant vegetation communities being; open grasslands, Acacia dominated bushland and the forest belt of Mt.
Kilimanjaro, interspersed with patches of swamps-edge grasslands, Acacia woodlands and swamps (Croze and Lindsay, 2011).
The Namanga-Magadi covers an area of > 5, 000 Km2 most of which comprise of Maasai group ranches (Figure 1). Like other parts of the borderland, it is a semi-arid environment with little rainfall of between 400 - 600 mm, which is bimodal and highly variable and these conditions make it suitable for wildlife conservation and pastoralism (Kioko, 2008). In a few areas, mostly along the Maili-Tisa-Namanga road, the main rivers and Ewaso Nyiro, the locals usually carry out limited irrigated agriculture. There is spatial-temporal variation in vegetation types in response to variation in the landscape and elevation. Due to the semi-arid nature of the region, the soils are poorly developed but are mainly “black clayey” (grumosolic soils) comprising of a variety of “black cotton” soils including the calcareous and non-calcareous variants. Ewaso Nyiro River is the main water sources although there are several seasonal rivers like the Namanga, Ol Kejuado and Esokota.
Lake Natron area lies west of the West Kilimanjaro area, and its northern part is defined by the Tanzania-Kenya border, with a total area of approximately 7,047 Km2), (Figure 1). It’s largely a semiarid savannah interspersed with open acacia woodlands (Acacia spp. and Commiphora spp.). The southern boundary extends from the southeast corner of Ngorongoro Conservation Area eastward to the northwest corner of Arusha National Park, while the western part is situated along the eastern side of Lake Natron to Ngorongoro Conservation area. Similar to other landscapes of the borderland, rainfall low (<350 mm/year), and is highly variable and largely unpredictable. The vegetation types are very diverse and therefore provide expansive livestock grazing land.
The West Kilimanjaro is found in the Longido District, and its northern sector lies along the Kenya-Tanzania border from Namanga southeastward to Irkaswa covering >3000 Km2 (Figure 1). Annual rainfall varies depending on the elevation, with the semi-arid lower elevations receiving 341 mm/year and lower elevations on Mt. Kilimanjaro at Mt. Meru and Monduli in the south receiving part 890 mm/year (Moss, 2001). Nevertheless, it is generally variable and unpredictable. In terms of vegetation, the region has a complex and heterogeneous vegetation community with extensive swathes of farming and grazing lands. The dominant inhabitants are the Maasai people who have over the years tuned into agro-pastoralists. Numerous wildlife conservation areas are found in the region like Kilimanjaro National Park (755 Km2), Arusha N. P (137 Km2, Longido Game Controlled Area (GCA) (1,700 Km2) and Ngasurai Open Area (544 Km2).
Methods
For many years since its creation, the Kenya Wildlife Service (KWS) has been undertaking total aerial counts of large herbivores using methods developed by Douglas-Hamilton (1994) and Norton– Griffiths (1978). This approach has generated substantial set of total count data from which trends and dynamics of wildlife populations in the country have been understood. Consequently, wet and dry season total elephant counts were carried out in 2010 and 2013 using similar techniques, and systematically covered the entire area of the defined census zone and recorded every large mammal (and especially elephant herds as they are keystone species in the ecosystem), including their location on the ground using GPS units.
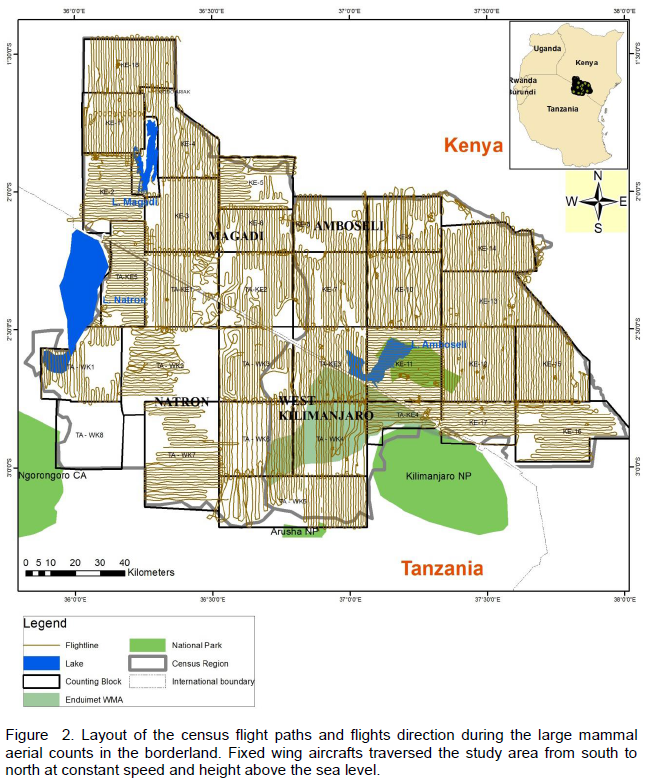
To improve the quality of data collected on the elephant population, both crew and planes were calibrated to aid in estimation of distance for subsequent calculation of observable strip width. Streamers were mounted on either side of the aircraft wings to create two strip categories, the inner and outer (Figure 2). Inner category was defined as the region from the farthest one could see from the belly of the plane to the lower streamer. Likewise the outer category was defined as the region between the lower and the upper streamer (within the streamers). Calibration for observers entailed adjusting the angle of view of the streamers to correspond to 500 M and 250 M on the ground for a set altitude of 300 Ft AGL for the upper and lower streamer respectively. This was done by use of clinometers. The Rear Seat Observers (RSO’s) were each calibrated and observer specific and plane specific metrics for each calibration recorded according to an individual‘s physique. The metrics comprised measurements from various reference points on the air craft such as low and high eye mark on the aircraft window, upper and lower streamer mark on wing strut and plane fuselage. In addition, Front Seat Observers (FSO’s) and pilots were also calibrated for the purpose of assisting the RSO’s to determine whether or not the counted animals are within the strip width.
For each calibration made, test flights were conducted at the set altitude for streamers (300 Ft AGL) to determine how well the streamers fitted to the desired strip width on the ground. This was achieved by creating a flight line at 500 M and 250 M from a very straight and long (5 KMs) section of a road. When the aircrafts flew on this line, the road was either 500 M or 250 M from the plane and this allowed for evaluation of the streamers. To asses inter observer variability in estimation and enhance species identification, all observers were independently subjected to count a portion of the same block with different species of known numbers in mock flights.
The target landscape was divided into blocks based on visible features from the aircraft like hills, ridges and rivers which helped the pilots to easily navigate during flight. To improve counting efficiency, the blocks were delineated into rectangular and square shapes, which also made it easier for the pilots and the Front seat observers (FSOs) to navigate using GPS units. It also gave them ample time to make comprehensive ground observations, and an attempt was made to ensure the blocks were large enough (about 900 Km2 each on average), and could be covered within a maximum duration of six hours per day. The enhance reliability of the data collected, the counting crew were trained on how to conduct aerial counts using mock test flights. Thus, different crews flew at different times but maintaining the same flight orientation so as to evaluate any inter observer variation in their ability to identify, detect, estimate and count wildlife species. They were also trained on use of voice recorders, GPS units and cameras, wildlife species identification, counting, estimation of herd sizes, data processing and handling. As noted by Douglas-Hamilton et al., (1994), all this preparation was done in recognition of the fact that the accuracy and reliability of such total aerial counts rely heavily on the experience of the flight crew and the pilot.
Counting of large herbivores was done in each block using a light aircraft which flew along East-West and North-South flight transects of 1-2 Km width depending on the visibility on the ground and nature of the terrain (Figure 2). On average, each count began approximately 7.30 am and ended in the afternoon, and the end time was dependent on the size of each block. The crew comprised on a pilot, front and rear seat observers, and in each block the observers systematically searched for any large herbivores on the ground and recorded; the number of individuals, their spatial location using GPS coordinates, the number, and herds of more than ten individuals were photographed so that the actual number could be verified later (Douglas-Hamilton, 1994). Data capture was also done using tape recorders, and on landing, the ground crew downloaded records captured in digital voice recorders, and the data recorded in the GPS units using DNR-Garmin /MapSource software. Once downloaded, the voice records were processed digitally to remove background noises to enable the data to be clearly heard. A team of transcribers listened to these records transcribed the data onto data sheets, and where there were discrepancies; these were verified, corrected and reconciled. All data were then entered into a spread sheet. Double counts especially on flight lines that were overlapping or very near each other were visually searched and eliminated using GIS software.
.Flight path and way point data were processed using ArcGIS 10.1 software to produce spatial elephant distribution maps.
In addition to elephant data, the flight observers noted and recorded human activities mainly vegetation clearing, livestock grazing, human settlements and infrastructure development. These were considered to represent key changes in the landscape which threatened its ecological integrity and elephant conservation.
Data from the wet and dry period of 2010 and 2013 were used. Tallies, percentages, means and standard errors for the data were calculated using standard mathematical and statistical methods (Zar, 1999). Population changes were assessed based on how the large mammal density of 2013 varied from 2010 for that particular season.
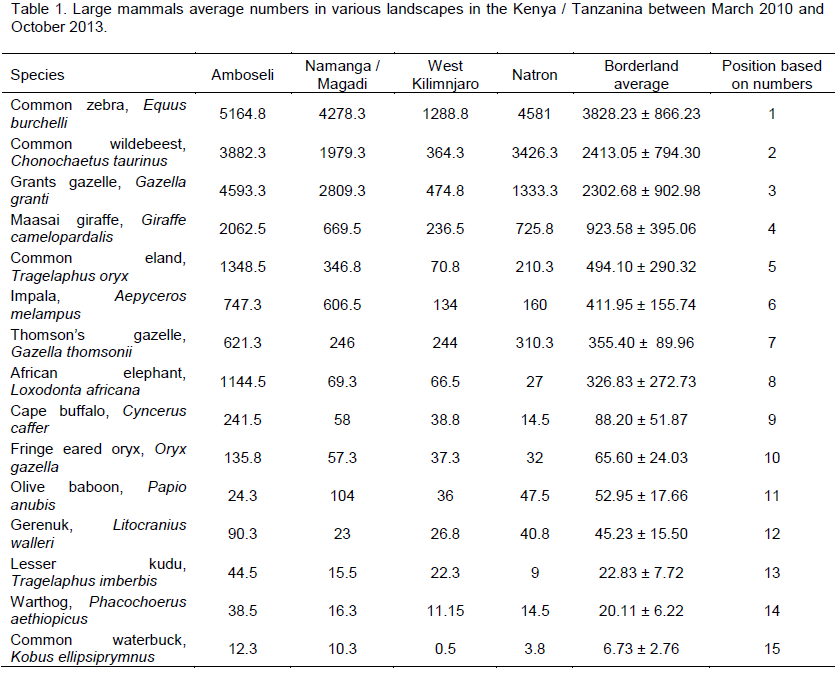
In the Amboseli landscape (the park and surrounding group ranches), the most abundant herbivores in terms of numbers were the common zebra (averaging 5,165 animals), followed by Grants gazelle (4,593 animals), common wildebeest (3,882 animals), Maasai giraffe (2,063 animals), Common eland (1,349 animals), and the African elephant (1,145 animals) respectively (Table 1). For the Namanga Magadi landscape, the most abundant herbivores in terms of numbers (Table 1) were the common zebra (4,278 animals), followed by Grants gazelle (2,809 animals), common wildebeest (1,979 animals), Maasai giraffe (670 animals), Impala (609 animals), and common eland (347 animals) respectively.
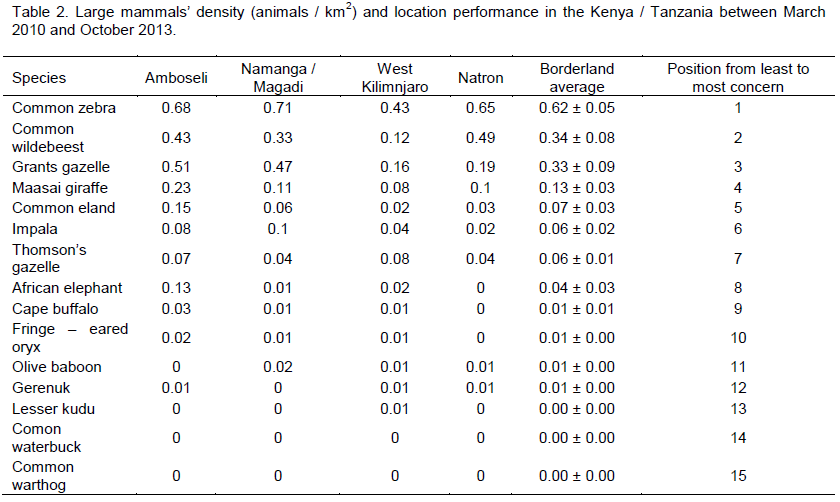
For the West Kilimanjaro landscape, the most abundant herbivores were the common zebra (1,289 animals), followed by Grants gazelle (475 animals), common wildebeest (364 animals), Maasai giraffe (237 animals), Thomson’s gazelle (244 animals), and impala (134 animals) respectively (Table 1). For the Lake Natron landscape, the most abundant herbivores were the common zebra (4,181 animals), followed by common wildebeest (3,426 animals), Grant’s gazelle (1,333 animals), Maasai giraffe (726 animals), Thomson’s gazelle (310 animals), and common eland (210 animals) respectively (Table 1). Similar animals mostly appeared in that order for density (Table 2).
Of the 15 common large mammals in the borderland (Table 1), the five most abundant large wild mammals based on numbers in all landscapes were the common zebra (3828.2 ± 866.2 animals), common wildebeest (2413.1 ± 794.3 animals) , Grants gazelle (2302.7 ± 903.0 animals), the Maasai giraffe (923.6 ± 395.1 animals), and the common eland (494.10 ± 290.32 animals) respectively.
But the five less common large mammals based on their density were the common waterbuck (6.7 ± 2.7 animals), the common warthog (20.1 ± 6.2 animals), the lesser kudu (22.8 ± 7.7 animals), gerenuk (45.2 ± 15.5 animals), and the olive baboon (53.0 ± 17.7 animals). The same five common large mammals and same rare
ones
was identified based on the average density in the borderland (Table 2) respectively.
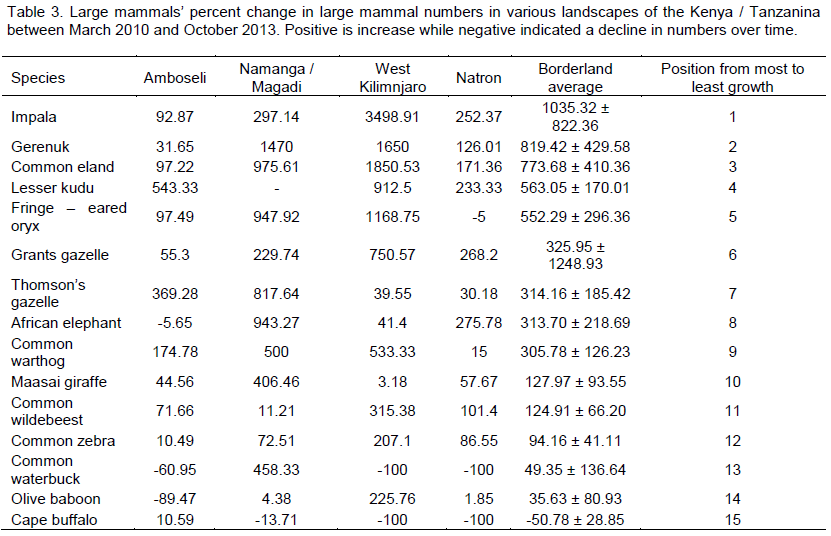
However, based on the average percent change in large mammal density in the borderland, the five large

wild mammals whose population was recovering well from the 2007 and 2009 drought were impala (1027.27 ± 827.45%), gerenuk (766.40 ± 406.96%), common eland (696.85 ± 405.85%), lesser kudu (597.87 ± 141.26%), and fringe – eared Oryx (515.67 ± 283.89%) respectively. But the five large mammals that were recovering poorly were the cape buffalo (-54.87 ± 26.80%, still declining), the olive baboon (32.10 ± 67.74%), the common waterbuck (74.05 ± 134.91%), common zebra (87.26 ± 43.28%), and the Maasai giraffe (109.69 ± 77.53%) respectively.
For population growth based on numbers in the Amboseli landscape, large mammals with positive growth were lesser kudu (averaging +543.33%), followed by Thomson’s gazelle (+369.28%), and common warthog (174.78%) respectively (Table 3). For the Namanga Magadi, the animals with positive growth were the common eland (averaging +975.61%), followed by fringe – eared Oryx (+947.92%), African elephant (943.27%), Thomson’s gazelle (817.64%), common warthog (+500.00%), Maasai giraffe (406.46%), impala (297.14%), and Grant’s gazelle (229.74%) respectively. For the West Kilimanjaro, the large mammals with positive growth were impala (+3498.91%), followed by fringe – eared Oryx (+1168.75%), common eland (1850.53%), gerenuk (1650.00%), lesser kudu (912.5%), Grant’s gazelle (750.57%), common warthog (+533.33%), common wildebeest (315.38%), and common zebra (207.10%) respectively (Table 3). And for Lake Natron landscape, the animals that showed higher positive growth were the African elephant (averaging +275.78%), followed by Grant’s gazelle (+268.2%), impala (252.37%), lesser kudu (233.33%), common eland (+171.36%), and common wildebeest (101.4%) respectively (Table 1).
Overall, based on all the population parameters (numbers, density and population change (increase or decline), the large mammal species that declined more were common waterbuck, olive baboon, cape buffalo, common warthog, lesser kudu and African elephant respectively. Those of relatively less concern were impala, common eland, Grant’s gazelle, common wildebeest, common zebra and Maasai giraffe respectively.
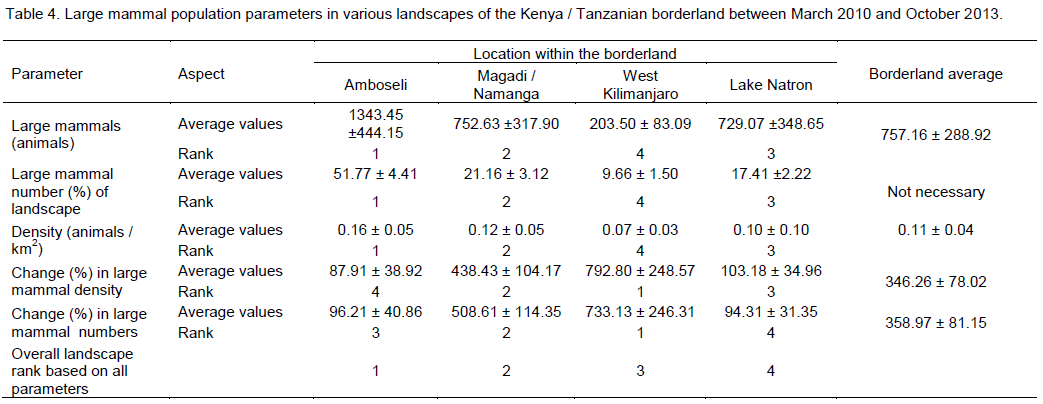
In terms of each landscape status within the borderland based on the large mammal parameters, Amboseli landscape had a higher and positive indicators followed by Magadi / Namanga area, West Kilimanjaro and lastly Lake Natron area (Table 4). Amboseli landscape led in numbers and density, but had the lowest values on population growth. Namanga / Magadi landscape was the second, but with the highest herbivore growth in numbers and density after West Kilimanjaro (Table 4). West Kilimanjaro had the lowest values in terms of herbivore numbers and density in the borderland. But it led in terms of large mammal growth rate. Lake Natron area showed low herbivore numbers and density and also low population growth rate (Table 4).
Wildlife large mammals are declining sharply both in protected areas (irrespective of the size) and outside dispersal areas in Kenya (Western et al., 2009a). This work specific at the Kenya – Tanzania borders shows post drought (of 2007 and 2009) common large herbivore numbers and population change over a three year wet and dry season counts done for cross – border monitoring purposes. The causes for large wild herbivore declines (Western et al., 2009a) are natural such as droughts (Western, 2000), diseases, environmental and demographic
stochasticity; as well as human – induced causes such as encroachment, poaching and persecution, loss of habitat and human encroachment (Okello and Kiringe, 2004); and management and policy failures such as management lapses as well as lack of stakeholder support, and participation, especially some local communities (KWS, 1994).
Even though the droughts of 2007 and 2009 may have reduced the wildlife populations, the subsequent rains increased forage and water availability in the borderland. This increased resources and reduced competition for them spurred an increase in mammal numbers (likely through birth. Those animals which have recovered well and the population continues to increase in the borderland include zebra, wildebeest, Grant’s gazelle, Maasai giraffe, the common eland, impala, Thomson’s gazelle and the African elephant. Both their numbers and population increase in the landscape is on the rise.
However, there as species in the borderland that are either not recovering well or their population numbers are still low. These species include Cape buffalo, waterbuck, olive baboons, lesser kudu, gerenuk, fringe – eared Oryx and common warthog. Even though lesser kudu, common warthog, fringe – eared Oryx and gerenuk seem to be recovering well though population growth, their numbers are still low. Populations whose numbers are low are prone to environmental and demographic stochasticity faster and can easily be wiped off by these events and become locally extinct (Mwangi and Western, 1998; Ogutu and Owen – Smith, 2003). But those which are still abundant but are declining (low or negative growth) are also in danger of downward population trend with time.
Care need to be taken for species with specific habitat needs (such as the gerenuk and lesser kudu) and those who are highly dependent on localized resources (such as waterbuck and cape buffalo that are water dependent) as these are more exposed to rapid population declines if poor habitats and environmental stochasticity persists (Western and Gichohi, 1993;Western and Ssemakula, 1991). It is therefore important the continuous monitoring using same methods and standards as used in this aerial counts for both wet and dry season continue over the years in the borderland to monitor these species, as well as those not reported here (such as carnivores) so that management and conservation measures are taken to help them build back their population numbers in all the areas of the borderland.
Elephants use a large area and play a critical keystone function in the ecosystem. Even though elephant numbers in Amboseli stood at an average number of 1,145 (about 88% of the borderland) compared to Magadi / Namanga (5%), West Kilimanjaro (5%) and Lake Natron area (2%) of the total estimated 1,308 in the borderland, the later locations can support more elephants. Further, the Amboseli National Park, the surrounding Maasai group ranches, and the now emerging private and communal group ranches have the potential to support more elephants than this. It is for this reason and the fact the elephant is an ecological keystone species, a conservation flagship species, and an IUCN endangered species persecuted internationally for its ivory that the African elephant is still regarded as a species of concern (Western and Lindsay, 1994).
If the dispersal areas range can be made safer with expanded space in community and private ranches providing additional elephant core use areas with enough forage and water and little competition and degradation from livestock and people, elephant numbers will continue to recover and increase in the ecosystem that reported in this study. Indeed it’s noteworthy that already the African elephant had a negative growth rate in Amboseli and very little growth in West Kilimanjaro may be because of habitat changes (Western, 2006) and land use changes (Okello, 2005). If poaching and habitat degradation can be contained especially in the Lake Natron and West Kilimanjaro areas, and human encroachment and human – elephant conflicts contained in the Amboseli and Magadi / Namanga areas, elephant numbers will increase to use the entire borderland (Kikoti, 2009).
Amboseli, Magadi / Namanga, West Kilimanjaro, and Lake Natron areas had lower large mammal parameters (large mammal numbers, density, and population growth). Even though most of the parameters showed Amboseli as the most important area for large mammal conservation in the borderland, its importance may lie in supporting the largest number and density of large mammals, and also in being a source (for mainly immigrating species) especially during the wet season. Amboseli has permanent water sources with continuous green biomass growth and this is what attracts most large mammals to the area and especially in the dry season. With less incidences of commercial poaching, the role in supporting higher numbers and being a source for other areas in the borderland cannot be over - emphasized. But growing cases of bush meat trade, increasing human encroachment on wildlife dispersal areas, land use changes, agriculture expansion and increased commercial and industry
investments in the area threaten Amboseli as a wildlife hub. If the Amboseli Ecosystem is not made safer and threats to wildlife and conservation urgently tackled, its role will diminish as already wildlife growth generally has stagnated in the ecosystem even if it is likely that resources (space, forage and water) and ecological niches may already be saturated by available species and numbers.
Namanga / Magadi landscape seemed to be the most promising area in the landscape supporting current population numbers and having real potential for herbivore population growth as well. However, this can only happen if habitat destruction and poaching are contained, as well as local communities inducted in conservation process by being encouraged to conserve, set aside wildlife conservancies for ecotourism and collaboration with conservation agencies and organizations in enhancing conservation in this area. This is already happening, but needs to be structured and planned better, and supported with both financial and technical expertise. The West Kilimanjaro area, though having low numbers, has a great potential for wildlife large mammal population increase because the results indicated that it had the leading species growth rate (immigration and birth rate may be higher than other locations). But for this potential to be achieved, urgent measures are needed to stem out mainly poaching and habitat destruction in this general area before meaningful wildlife population numbers can build up. The Lake Natron area seemed to stand out as a hot spot of likely wildlife local extinctions and unsafe range for wildlife presence. This is because this area had the lowest numbers as well as rate of population growth. This means the birthrate are low and likely the immigration of individuals from other populations into the area from other areas is poor. This may be due to high rate of poaching, hunting, habitat degradation (Kiringe and Okello, 2005) and animal harassment in the area. Urgent measures are needed to stem out mainly poaching and habitat destruction in this general area before meaningful wildlife population numbers can build up.
This research finding demonstrates two important issues for the conservation of the borderland. First, the collaboration of governments (Kenya and Tanzanian through their lead wildlife agencies) and conservation organizations in doing joint wildlife census, monitoring, and security operations on the borderland to enhance wildlife conservation is critical. This partnership can be maintained and enhanced through relevant intergovernmental legal protocols under the East African community and for the benefit of communities and wildlife living in the borderland area. Second, it is very important to establish status and trends of wildlife populations through consistent, standard and improved methodology. This research was done the same way in wet and dry season and covered the same area. Improvement in data collection, collation and aerial techniques continued to improve the reliability of the data and provision of very good baseline data that can be a basis for future analysis and comparisons. However, the data on small animals (especially baboons, dik diks, warthogs and most carnivores) cannot be very reliable because of small size from the air or preferred habitats (such as baboons that live in riverine woodlands) and this technique may bias proper estimates of those species. A better alternative methodology for these species (including carnivores) needs to be evolved and done separately.
The authors did not declare any conflict of interest.
This write up and analysis was funded by African Wildlife Foundation (AWF, Contract PO005149). The fieldwork was a collective effort of various persons and institutions. In particular, we sincerely thank the Director of the Kenya Wildlife Services (KWS), Director General of Tanzania Wildlife Research Institute (TAWIRI), Director Amboseli Trust for Elephants (ATE), Director of Wildlife Division (Tanzania) and Director General of Tanzania for providing staff, equipment, vehicles and aircrafts during the census. We also applaud and acknowledge the hard work done by the pilots, survey observers, GIS specialists and data handlers, ground crew and other support personnel without whom the census would not have been successful.
REFERENCES
|
Altmann J, Alberts SC, Altmann SA, Roy SB (2002). Dramatic change in local climate patterns in the Amboseli basin, Kenya. Afri. J. Ecol. 40: 248-251.
Crossref
|
|
|
|
Berger D (1993). Wildlife extension: participatory conservation by the Maasai of Kenya. ACTS Environmental Policy Series 4:5-45.
|
|
|
|
|
Douglas-Hamilton I, Gachago S, Litoroh M, Mirangi J (1994). Tsavo elephant count 1994. Report to the Kenya Wildlife Service, Nairobi, Kenya.
|
|
|
|
|
Kangwana K (2011). The behavioral responses of elephants to the Maasai in Amboseli. In: Moss C J, Croze H, Lee P C, editors. The Amboseli elephants; a long-term perspective on a long-lived mammal. The University of Chicago Press, Chicago and London. pp. 307-317.
Crossref
|
|
|
|
|
Kenya Wildlife Service, KWS (1994). Wildlife-Human Conflicts In Kenya. Report Of A Five-Person Review Group, KWS Official Document. Nairobi, Kenya, pp.55.
|
|
|
|
|
Kikoti A (2009). Seasonal home range sizes, trans-boundary movements and conservation of elephants in northern Tanzania. Open Access Dissertations. Paper 108. http://scholarworks.umass.edu/open_access_dissertations/108
|
|
|
|
|
Kioko J (2008). Natural resource conservation and livelihood options: the proposed illeng'arunyani conservancy in Mailua group ranch, Kajiado district, Kenya, African Conservation Center Report.
|
|
|
|
|
Kiringe JW, Okello MM (2005). Use and availability of tree and shrub resources on Maasai communal rangelands near Amboseli, Kenya. Afri. J. Range Forage Sci. 22:37-46.
Crossref
|
|
|
|
|
Moss CJ (2001). The demography of an African elephant (Loxodonta africana) population in Amboseli. J. Zool. 255: 145-156.
Crossref
|
|
|
|
|
Norton–Griffiths M (1978). Counting animals. Handbook 1, 2nd edition, Nairobi, Kenya. African Wildlife Foundation.
|
|
|
|
|
Ntiati P (2002). Group ranches subdivision study in Loitokitok division of Kajiado District. Land Use Change Impacts and Dynamics (LUCID) Working Paper 7, International Livestock Research Institute (ILRI), Nairobi, Kenya.
|
|
|
|
|
Ogutu JO, Owen – Smiths N (2003). ENSO, rainfall and temperature influences on extreme population declines among African Savanna ungulates. Ecology Letters 6:412-419
Crossref
|
|
|
|
|
Okello MM (2005). Land use changes and human-wildlife conflict in the Amboseli Area, Kenya. Human Dimensions of Wildlife 10: 19-28.
Crossref
|
|
|
|
|
Okello MM (2009). Contraction of wildlife dispersal area and displacement by human activities in Kimana Group Ranch near Amboseli National Park, Kenya. Open Conserv. Biol. J. 3: 49-56.
Crossref
|
|
|
|
|
Okello MM, Kiringe JW (2004). Threats to biodiversity and their implications in protected and adjacent dispersal areas of Kenya. J. Sustainable Tourism 12(1): 55-69.
Crossref
|
|
|
|
|
Okello MM, D'Amour DE (2008). Agricultural expansion within Kimana electric fences and implications for natural resource conservation around Amboseli National Park, Kenya. J. Arid Envir. 72: 2179–2192.
Crossref
|
|
|
|
|
Okello MM, Novelli M (2014). Tourism in the East African Community (EAC): Challenges, opportunities and way forward. Tourism and Hospitality Research 14(1-2):53-66.
Crossref
|
|
|
|
|
Ottichilo WK, de Leeuw J, Skidmore AK, Prins HHT, Said MY (2000). Population trends of large non-migratory wild herbivores and livestock in the Maasai Mara ecosystem, Kenya, between 1977 and 1997. Afri. J. Ecol. 38:202-216.
Crossref
|
|
|
|
|
Ottichilo, WK, de Leeuw J, Prins HHT (2001). Population trends of resident wildebeest [Connochaetes taurinus hecki (Neumann)] and factors influencing them in the Maasai Mara ecosystem, Kenya. Biological Conservation 97:271-282.
Crossref
|
|
|
|
|
Reid R, Gachimbi L, Worden J, Wangui E, Mathai S, Campbell D, Maitima J, Butt B, Gichohi H, Ogol E (2004). Linkages between changes in land use, biodiversity and land degradation in the Loitokitok area of Kenya. Land Use Change Impacts and Dynamics (LUCID) Working Paper Series 49. pp. 1-29.
|
|
|
|
|
Republic of Kenya (1999). The 1999 population and housing census: counting our people for development. Volume 1: population distribution by administrative areas and urban center. Ministry of Finance and Planning, Central Bureau of Statistics, Nairobi, Kenya. and Planning, Central Bureau of Statistics, Nairobi, Kenya.
|
|
|
|
|
Seno SK, Shaw WW (2002). Land tenure policies, Maasai traditions, and wildlife conservation in Kenya. Society and Natural Resources 15:79- 88.
Crossref
|
|
|
|
|
Thompson LG, Brecher HH, Mosley-Thompson E, Hardy DR, Mark BG (2009). Glacier loss on Kilimanjaro continues unabated. PNAS 1-6. Available: http:// www.pnas.org/cgi/doi/10.1073/pnas.0906029106. Accessed 11 September 2014.
Crossref
|
|
|
|
|
Western D (1975). Water availability and its influence on the structure and dynamics of a savannah large mammal community. East Afri. Wildlife J. 13:265-285.
|
|
|
|
|
Western D (1982). Amboseli National Park: enlisting landowners to conserve migratory wildlife. Ambio 11(5): 302-308.
|
|
|
|
|
Western D (2000). Local strategies for coping with drought in Kenya: constraints and opportunities. African Centre for Technology Studies (ACTS), 2(1): 1-4
|
|
|
|
|
Western D, Lindsay WK (1984). Seasonal herd dynamics of a savanna elephant population. Afri. J. Ecol. 22: 229-244.
Crossref
|
|
|
|
|
Western D, Gichohi H (1993) Segregation effects and the impoverishment of savanna parks: The case for an ecosystem viability analysis. Afri. J. Ecol. 31: 261-281.
Crossref
|
|
|
|
|
Western D, Russell S, Cuthill I (2009a). The status of wildlife in protected areas compared to non-protected areas of Kenya. PLoS ONE 4 (7): 6140. doi:10.1371/journal.pone.0006140.
Crossref
|
|
|
|
|
Western D, Groom R, Worden J (2009b). The impact of subdivision and sedentarization of pastoral lands on wildlife in an African savanna ecosystem. Biological Conservation 142:2538-2546
Crossref
|
|
|
|
|
Zar JH (1999). Biostatistical analysis 4th edition . Prentice Hall. Upper Saddle River, New Jersey
|
|