ABSTRACT
The ABO and Rh (D) blood type distributions vary from one ethnic group to another. However, they play an essential part in population genetics studies, blood transfusion practices and certain medico-legal cases. Thus, this study is aimed to assess ABO and Rh (D) blood group distribution patterns among Natural and Computational Science faculty graduating class students in Woldia University and to document a blood group database and creating awareness among blood donors for safe transfusion. To this end, blood samples from 429 (N=560) volunteer students were taken during the period of 1st February 2020 to 28th April 2020 blood donation campaign and observational cross sectional study design was performed. ABO and Rh (D) typing was done by antigen-antibody agglutination test using commercially available and standard anti-sera. Descriptive statistical measures on phenotypic frequency of ABO and Rh (D) blood types were described in simple percentages. The allelic and genotypic frequencies of the ABO and Rh blood groups were estimated using the assumption of Hardy–Weinberg equilibrium. The ABO and Rh (D) blood phenotypes respectively were found to be A (28.20%) > B (25.40%) > AB (24.70%) > O (21.67%) and Rh+ (60.13%) > Rh- (39.86%) and the combined ABO/Rh(D) blood groups were in the order A+ (16.31%) > B+ (15.85%) > O+ (14.21%) > AB+ (13.75%) and A- (11.88%) >AB- (10.95%) > B- (9.55%) > O- (7.45%). The allelic frequencies of IA (P), IB (q), IO(r) respectively were 0.314, 0.2939 and 0.4655. The allelic frequencies for ID = 0.3687 and for Id = 0.6313 were found. A genotypic frequency of IAIO was the most frequent (0.2923) and IBIB was the least frequent (0.0863). Whereas, IDId was most frequent (0.4655) and IDID was the least frequent (0.1359). The observed and expected frequencies of individuals having ABO blood group showed no significant difference (χ2 = 35.4381, df = 3; P < 0.05) and Rh (D) blood phenotypes of individuals were significantly different (χ2 = 0.000011, df = 1; P < 0.05), thus, not fitting Hardy-Weinberg assumptions. The data obtained in the present study could be used as important input for blood bank services to have better blood management and safe blood transfusion practices in different regions of Ethiopia and abroad in the future.
Key words: ABO, allele, blood donors, blood groups, distribution, genotype, Rh (D), Woldia University.
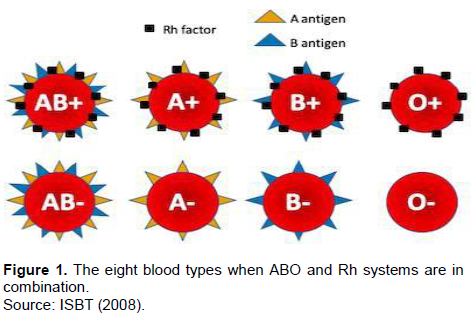
Blood at all times had a special mysteriousness in that lives of individuals depend on it. Over the past hundred or above years, the entire blood groups had been supposed to be identical and terrible costs during blood transfusion were unstated. However, later in their discovery ABO and Rh (D) blood groups exhibit genetic polymorphism in different populations (Tekade et al., 2011). Human ABO blood type was the first to be discovered by Landsteiner in 1901(Garraty et al., 2000) and the Rh (D) blood group identified later in 1941 by Landsteiner and Wiener (Rahman and Lodhi, 2004). Since then these two systems considered as the most important blood group from the point of view of blood transfusion purposes. Blood group systems are common to all human populations; even though they differ in frequencies of specific types. The occurrence of ABO and Rh (D) groups shows a discrepancy among different races, ethnic groups, and socio-economic classes in many parts of the world (Sidhu and Sidhu, 1980). Approximately 700 red cell antigens are characterized and categorized into 30 blood group systems by the International Society of Blood Transfusion; in addition, ABO and Rh (D) are significantly recognized (ISBT, 2008). The antigens of ABO and Rh (D) blood group are important gene products and useful in population genetics studies, migration patterns among populations, in assessing the likelihood of being hemolytic in the newborn, for forensic determinations as well as for medico-legal purposes, predominantly in doubtful fatherliness; they have enormous applications in blood transfusion practices and organ replacement in that the giver blood type must fit that of the receiver (Kassahun et al., 2015). Different types of blood groups are hereditary and determined by the presence or absence of surface antigens and an antibody (Daniel and Clark, 2007) that could play a vital role during blood donation and transfusion. Humans however, have different types and combinations of these molecules (Daniels, 2002). Blood group substances (antigens) are controlled by a genetic locus consisting of a different number of alleles e.g. A, B, and O in the ABO system (Murray et al., 2003; Daniels, 2002). The ABO blood group system is controlled by a particular gene with IA, IB and IO alleles located on the long arm of chromosome 9 (Zahid et al., 2016). The IA and IB alleles are Co-dominant but IO allele is recessive to both in the situation when either of A or B allele affects the expression of it in the same gene locus (Murphy et al., 2003). Surface antigens on RBCs determine the ABO blood group system that is, antigen A determines blood group A, antigen B determines blood group B, or both antigens (A and B) determines blood group AB and no antigen determines blood group O. This in turn categorizes all human blood in one of the following groups; B, AB, A and O (Zahid et al., 2016) and the genotypes were; OO, AO, BO, AA, BB and AB (Khalid et al., 2013). Rh(D) is another clinically significant blood type that causes hemolytic disease of the fetus and newborn, which is controlled by a gene found on the short arm of chromosome 1 (Murphy et al., 2003). It is also di-allelic; consisting of D (dominant) and d (recessive) alleles. People who have RBCs with D-antigen on their surface are known as Rh+ (Rhesus-positive) and represent DD or Dd genotype, while those without D-antigen on their RBCs are called as Rh- (Rhesus-negative) and represent dd genotype (Knowles and Poole, 2002). Till now, just about 49 Rh (D) antigens are identified and defined as highly immunogenic (Rayhana et al., 2013). Contrasting the ABO group, anti-D antibodies are only formed in Rh- individuals when they are exposed to Rh+ blood, rather than commonly existing in the blood (Saladin, 2003). The two genes, RHD and RHCE encode Rh blood group antigens. These genes are highly homologous and have close related genomic sequences, each comprising 10 coding exons placed in different alignment on chromosome one (Daniels, 2002). Antibodies to D negative individuals can cause transfusion reactions during blood transfusion or pregnancy. If an Rh- individual receives an Rh+ blood, the receiver produces anti-D (Bethesda, 2005); hence D antigen is the other notable structure. A similar disorder can happen when an Rh- woman is expecting an Rh+ fetus. The first gestation period is likely to be safe because the placenta typically averts motherly and fetal blood from blending. Though, during delivery or miscarriage, placental failure may leak anti-D antibodies from mother to Rh+ fetal blood. After all, fetal erythrocytes would become agglutinated and hemolyzed. Thus, the new born baby is being hemolytic with severe anemia called Erythroblastosis fetalis (Saladin, 2003). For this reason, the Rh status is regularly checked in blood givers, blood receivers, and in mothers-to-be (Bethesda, 2005). In view of ABO and Rh systems together, 8 blood types could be found as indicated in Figure 1. “B+” is to mean somebody has B antigen and Rhesus factor on RBCs and could receive blood from same B+ type donor and vice versa.

On one side, in the ABO blood group distributions, type AB (7%) < type B (20%) < type A (27%) < type O (46%) in ascending order were common among African-Americans and the same distribution patterns also seen in Caucasians in the United State, as type AB (3%) < type B (9%) < type A (41%) < type O (47%). Additionally, type AB (3%) < type B (9%) < type A (42%) < type O (46%) were also observed among Western Europeans, what is more, type O has high distribution pattern while AB was the least (Pramanik and Pramanik, 2000; Adeyemo and Soboyejo, 2006). On the other side, Rh+ is recorded as 95% in African-Americans, 100% in Africans while Rh- is 5.5% in South India, 5% in Nairobi, 7.3% in Lahore, 4.8% in Nigeria (Mwangni, 1999; Omotade et al., 1999). According to Atire (2015) agglutination is the mass piling of red blood cells with their antigens by antibody molecules and form bridges between them. When antigens on RBCs combined with their specific antibodies aggregates of the red blood cells were formed. Hence, agglutination occurs and this can happen in two stages. Sensitization- the first stage, antibodies found in the serum bind to the corresponding antigen on the red blood cell surface, a red blood cell catch-up by antibodies thus, being sensitized. The physical agglutination (clumping) is the second stage, occurs when an antibody potentially binding to a large number of antigens on RBCs producing a net or mesh that holds the cells together. If the aggregates formed from these cells were too large they can be seen with unaided eye. However, there are also aggregates which cannot be seen without the aid of biological tool. Successful blood transfusion can be achieved when the contributor and receiver blood group antigen systems being compatible and depends on the ability of agglutinins of these blood groups to cause haemolytic transfusion reaction and haemolytic disease of the fetus and newborn (Knowles and Poole, 2002; Murphy et al., 2003). Blood transfusion safe-guarded the lives of many individuals. However, faulty procedures will cost severe and delayed complications; even become life-threatening (Wakgari and Getahun, 2019). Knowing the distribution data of ABO and Rh (D) blood group is vital for enrollment of voluntary contributors as required for each region across the country, to take precautionary actions counter to the diseases linked with diverse blood types and for proper management of blood in the blood bank. Blood Transfusion Service (BTS) is an important practice of modern health care system without which emergency cases will not be mitigated efficiently. The main purpose of a BTS is to deliver faultless and safe blood as well as blood products and possibly to meet patient's requirement (Kotwal et al., 2014). Even though, the incidence of the ABO and Rhesus blood types described in Ethiopia was insufficient, nothing has been done in Woldia University. Thus, the general objectives of the present study are: to assess the distribution patterns of ABO and Rh (D) blood groups among Natural and Computational Science faculty graduating class students in Woldia University and the specific objectives are: (a) to estimate the phenotypic, allelic and genotypic frequencies of ABO and Rh (D) blood groups. (b) to create awareness and document a blood group database for safe blood transfusion.
Description of the study area
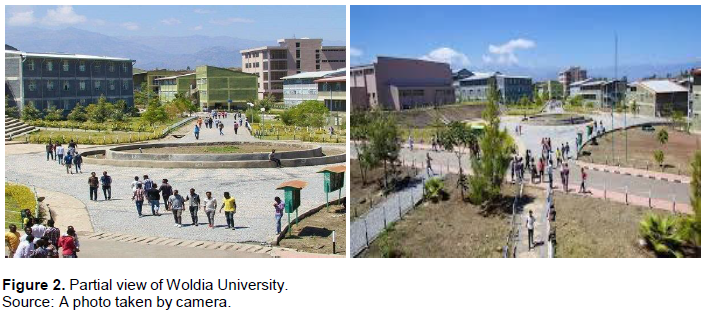
Ethiopia is a country that establishes dynamic growth oriented higher educational institutions and Woldia University is among the higher institutions in Ethiopia (Figure 2). It was founded in Woldia town, the capital of North Wollo Zone Amhara regional state through the council of ministers regulation No 223/2011 issued on May 26, 2011 and formally recognized by Ministry of Education, Ethiopia. Foundation stone for building accomplishments of the university was put down on October, 26, 2008 by his Excellency Ato Ayalew Gobeze, previous head state of the Amhara Region and his Excellency Dr. Adhana Haile, previous secondary state minister of education. At present, the overall area of the university is 200 hectares of acreage. The university has two grounds, namely, the main campus called Woldia University and the second one is Mersa campus of Agriculture. It is 30 kms distance from the main campus. The first allocation of students, add up to 599, has been known to the university on December 10/2011 in excellent welcome ceremony including invited visitors, town inhabitants, representatives of different zone and Woreda administrative offices and university’s community. Students have been assigned into four faculties and 12 departments. In its second operation, the university accepted over 1457 new students who come across different regions of the country, that is, from Amhara, Oromia, Tigray, Southern Nation Nationalities and peoples, Gambela, Afar, Somali, Harari and Benishangul gumz regions. The amount of faculties grew into six including Natural and Computational Sciences; the two newly added being the faculty of Agriculture and pedagogical and behavioral science faculty. Likewise, the number of departments doubled into 24 and different courses and programs have been offered, leading it to nationally competent and highly renowned higher education in several areas of study. Nowadays, the university consists of over 5500 student populations.
Study design and sample population
The observational cross sectional study was conducted in Woldia University main campus during the 1st February 2020 to 28th April 2020 blood donation campaign. The study populations were Natural and computational sciences graduating class students of Woldia University. From 560 Natural and Computational Science Faculty graduating class students, a total of 429 voluntary students were taking part in blood donation operations and thus considered as study subjects. From 429 study subjects 237 were males and 192 were female students. The age of the participants were above 18 years and socially represents different ethnic groups as they come across different regions of the country that is, Amhara, Southern Nations Nationalities and Peoples (SNNP), Oromia, Gambela, Tigray, Afar, Harari, Somali and Benishangul gumz regions of Ethiopia.
Specimen collection and laboratory investigation
First of all, the objectives and procedures of blood donation were briefed to all the participants (students) during the campaign over a week at university level. Then donors were screened by Woldia blood bank service professionals and the selection was based on the criteria and guidelines used in blood donation processes. Assessments like body weight which is greater than 45 kg; Hemoglobin levels; for male 13.5 to 17.0 g/dl and for female 12.5 to 16 g/dl, blood pressure; up to 160/90mmHg were performed in order to select candidate donors. In addition, mental readiness, good health status, physical wellbeing and medical fitness of individuals were taken into considerations. Thus, donors who satisfied these criteria were enlisted and accepted. Then the study subjects were asked to fill up registration forms which comprise personal details, socio-demographic details, occupation and medical history. All blood collections were taken from voluntary donors at blood donation camps in Woldia University. After blood donation, antigen-antibody agglutination tests of ABO and Rh blood groups was done using commercially available and standard anti-sera (Bhasin and Chahal, 1996) that is, anti-A, anti-B and Anti-D at Woldia blood bank service by laboratory experts. Anti-sera were actually, validated by national blood bank. During blood typing, agglutination was recorded as a positive reaction. Blood groupings were done by separate glass slides on which blood drops were designated as A, B, and D and are mixed with different disinfected applicator sticks. If aggregates were seen in the blood drop A, then it belongs to blood group A, if aggregates were observed in blood drop B, then it belongs to blood group B, if aggregates were observed in both A and B blood drops, then it belongs to blood group AB and if neither A nor B drops showed aggregates, then it belongs to blood group O. In the same way, aggregates in blood drop D were reflected as Rh+ and no aggregates as Rh- (Avent and Reid, 2000). Finally, the results were observed and documented as B+, A+, O+ AB+ and B-, A-, O- and AB- observation under microscope was also employed when doubtful cases were confirmed.
Statistical analysis
Descriptive statistical measures on phenotypic frequencies of ABO and Rh (D) blood groups were carried out and stated in simple percentages (Tables 1 to 3). The allelic and genotypic frequencies were also estimated from the observed phenotypes by considering Hardy–Weinberg assumptions. The IA, IB, and IO alleles from ABO blood groups were symbolized by p, q, and r, respectively. The frequencies were computed following Sutton (1980); Wakgari and Getahun (2019). Thus, IO allele which is corresponding to r = √O, IA allele which is corresponding to p = 1 - √ (O + B) and allele IB which is corresponding to q = 1 - √ (O + A) were calculated. Then, the genotypic frequencies were computed as: p2 = IAIA, q2 = IBIB, 2pq = IAIB, 2pr = IAIO, 2qr = IBIO and r2 = IOIO. The total genotypic frequency could be: p2 + 2pq + q2 + 2pr + 2qr + r2 = (p + q + r) 2 = 1 and p + q + r = 1(Hanania et al., 2007; Wakgari and Getahun, 2019). The same procedure was applied to calculate dominant allele (D) and recessive allele (d) frequencies of Rh blood group. Thus, Id allele which is corresponding to q = √Rh- and ID allele which is corresponding to P = 1 – q were calculated. The genotypic frequencies were computed from the observed allelic frequency under the assumption of Hardy-Weinberg equilibrium: p2 = IDID, q2 = IdId, 2pq = IDId. Thus, the total genotypic frequencies could be: p2 + 2pq + q2 = (p + q)2 = 1 and p + q = 1. Chi-square (χ2) test (P < 0.05) was also computed to compare the observed and expected ABO and Rh blood phenotype frequencies were in the Hardy- Weinberg equilibrium. Therefore, χ2 =Σ (O - E) 2 / E where, E = Expected frequency; O = Observed frequency. Expected phenotypic frequencies for each blood group were calculated following Wakgari and Getahun (2019). (1) Blood group A = f (AA + AO) × 429, (2) blood group B = f (BB + BO) × 429, (3) blood group AB = f (AB) × 429, (4) blood group O = f (OO) × 429, (5) blood group Rh+ = f (DD + Dd) × 429 and (6) blood group Rh- = f (dd) × 429. Where, “f” is frequency.
Ethical considerations
Generally actions implemented in researches concerning human subjects were in agreement with the National and Institutional Ethical standards of the research committee. Approval to conduct the study was decided by the Health Research Ethics Committee of Woldia University. An introduction letter was obtained from the Department of biology which was presented to the provost of the faculty for permission to carry out the research. Informed consent was also obtained from participants and collected data were kept private.
The ABO and Rh (D) blood group distributions among Natural and Computational Science Faculty graduating class students
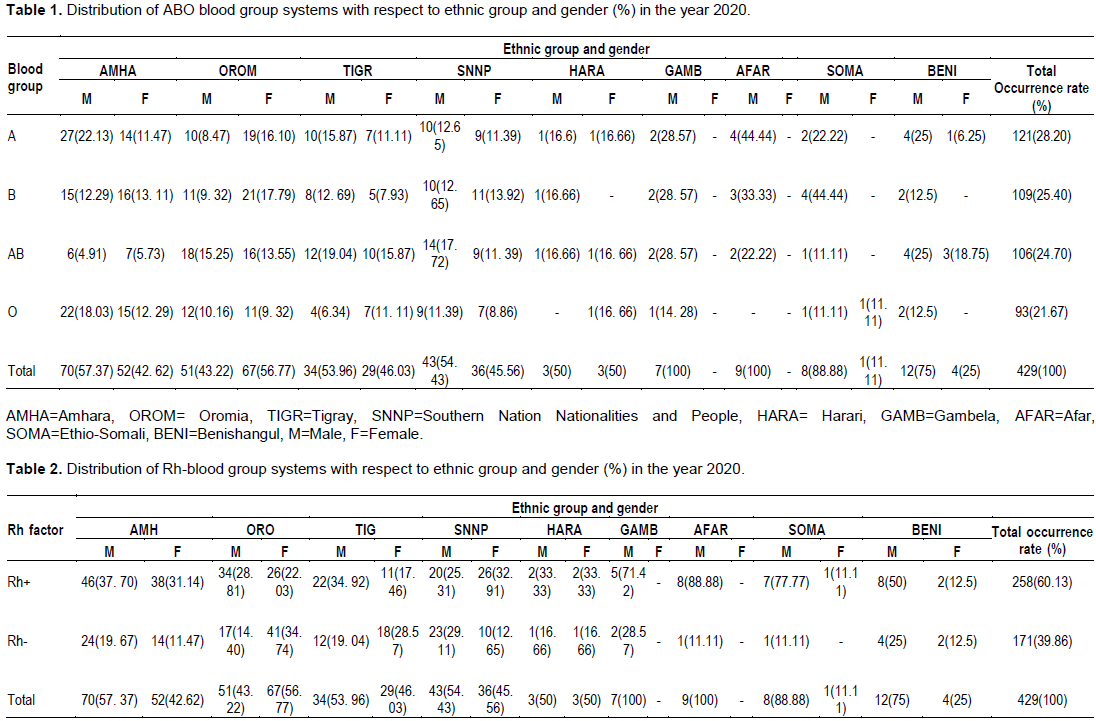
Tables 1 and 2 respectively showed the ABO blood groups and Rhesus factor distributions with respect to ethnic group and gender among blood donors (students) in Woldia University.
Furthermore, the overall ABO blood phenotypes were highly frequent in male students who come from Amhara, Tigray, SNNP,Gambela, Afar, Somali and Benishangul gumz ethnic groups than female students hence represent the highest distribution. However, the vice versa happened in Oromia region and the ABO blood phenotypes were observed equally in both male and female students from Harari ethnic group. Besides, the same trend holds true for Rh (D) blood phenotypes. Comparatively, Amhara, Oromia, SNNP and Tigray regions respectively have the highest frequency whereas, Benishangul gumz, Afar, Somali, Gambela and Harari regions in decreasing order represent the least frequency in ABO and Rh(D) distributions. However, the frequencies in each blood group in fact depend on the number of volunteer students who belongs to different ethnic groups in blood donation operations (Tables 1 and 2). The main reasons behind deviations in number among donors were a huge number of female students from the menstruating age groups likely to be found anemic, low body weight, lack of awareness, lack of inspiration and fear of blood donation. Thus, considered as unfit for donating blood and voided during the pre-donation screening and counseling. These reasons in the present result were also shared by Swamy et al. (2012). The health status of the female students however, needs to be improved by providing proper nutritional diet and iron supplements. An effort has to be done with female students to avoid fear regarding blood donation by educating them about the advantages of blood donations. The phenotype and genotype frequencies of ABO and Rh (D) groups vary widely across different races, geographical areas of the world and may not be found in equal numbers in different populations (Kumar et al., 2018; Atire, 2015; Wakgari and Getahun, 2019). The present study also showed that A, B, and Rh positive blood groups are having the highest prevalence rate of 28.20, 25.40, and 60.13% respectively which is relatively contradictory to other studies conducted by Kumar et al. (2018). Another blood group AB is also found to be lowest position in occurrence rate (24.70%) and O is having the last lowest occurrence (21.67%) (Table 1). When comparing Rhesus factors, Rhesus-negative factor shows the lowest prevalence percentage (39.86%) (Table 2). A similar finding by Kumar et al. (2018) revealed Rhesus- negative has lowest prevalence rate. Both ABO and Rh (D) are routinely typed in any blood bank or blood transfusion service (Bakare et al., 2006) but their frequencies were different (Enosolease and Bazuaye, 2008). In the present result, it is also common to get specific blood types with less frequency with respect to ethnic group and gender. However, knowing the distribution patterns of ABO and Rh (D) blood groups is crucial for better blood management (Canizalez-Román et al., 2018).
The result of the present study showed that the frequencies of the ABO and Rh (D) blood types distributions respectively were in the order A (28.20%) > B (25.40%) > AB (24.70%) > O (21.67%) and Rh+ (60.31%) > Rh- (39.86%) (Tables1 and 2). On the contrary, another study in Oromia region conducted by Wakgari and Getahun (2019) reported that O (41.32%) > A (31.9%) > B (21.4%) > AB (5.4%) and Rh+ (92.86%) > Rh- (7.14%). A study done by Kassahun et al. (2015) also shows deviation to the present study in that the prevalence of AB (5.2%), B (21.3%), A (24.5%) and O (41.0%) and 7.94%for Rh- and 92.06% for Rh+ in Silte zone, Ethiopia. According to Nwauche and Ejele (2004) a lot of researches have shown that blood group AB is the least common while O is the most common in different ethnic groups. Even though, O is the most commonly shared blood group in most populations in different parts of the world, blood groups B or A are rarely prevalent (Wakgari and Getahun, 2019). According to the study conducted by Khattak et al. (2008) the ABO blood phenotypes distribution patterns were reported to be B (32.40%) > O (29.10%) > A (27.92%) > AB (10.58%) in Swat district, Pakistan. Khalid et al. (2013) also indicated that studies conducted in Bangladesh and India showed AB < A < O < B typical Asian distribution patterns. Some European nations however, showed an AB < B < O < A pattern (Khalid et al., 2013). A hypothesis supposed by Lemu et al. (2017) reported that in malaria endemic areas the ‘O’ blood group is more frequent than non ‘O’ types and this helps, individuals with blood type ‘O’ survived better. In these areas however, individuals with both Rh- and ‘O’ types thought to be convincing malaria transmission as asymptomatic carriers, this is probably because of the beneficial effects of their phenotype make them resistant to the disease. Having the above scenario in mind, most studies in various parts of the world point out that, the dominance of O blood type could be important to fight against malaria because O blood type is not suitable for rosette formation by Plasmodium falciparum (Wakgari and Getahun, 2019). Moreover, since blood type O is universal donor, its higher prevalence again is very important particularly when emergency cases are present. This can also provide better information for proper management and safe transfusion practices in blood banks (Lemu et al., 2017). The present study also revealed that Rhesus-negative frequency was less common (39.86%) than Rhesus-positive (60.31%) indicating that it could be scarcely available in blood banks and unable to meet patients need. Thus, individuals should be motivated and persuaded to give blood and make this blood type more accessible in blood banks. Wakgari and Getahun (2019) indicated that the phenotypic frequency of Rhesus-negative factor is less common in most parts of the world. In Nigeria and Madagascar for example, 6 and 1% respectively were reported as Rh-. In China, Indonesia, and Japan less than 1% of the population is Rh- Lemu et al. (2017).
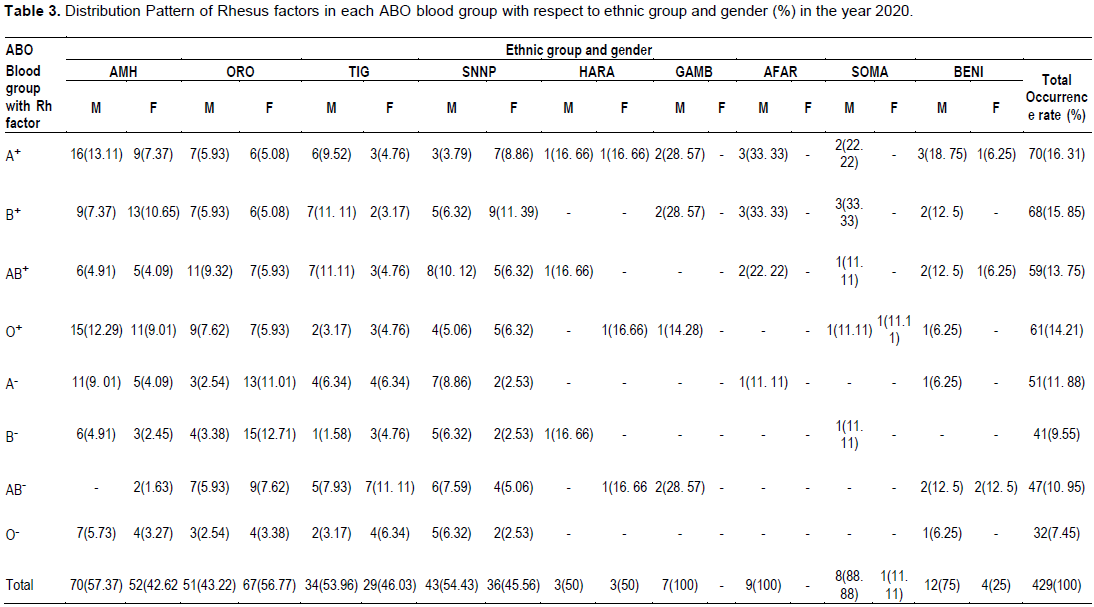
Table 3 shows the distribution pattern of Rhesus factors in each ABO blood types with respect to ethnic group and gender. In ABO/Rh(D) combinations, Rhesus‑positive factors distribution pattern was found in the order A+ (16.31%) > B+ (15.85%) > O+ (14.21%) > AB+ (13.75%) and Rhesus-negative factors were observed in the order A- (11.88%) > AB- (10.95%) > B- (9.55%) > O- (7.45%) which is different from overall ABO blood group pattern that is A (28.20%) > B (25.40%) > AB (24.70%) > O (21.67%) (Table1). With regard to sex, Rhesus-positive and Rhesus-negative patterns respectively were found to be B+ > O+ > A+ > AB+ and AB- > A- > B- > O- in females. However, A+ > B+ = AB+ > O+ and A- > AB- > B- = O- respectively were observed in both Rhesus positive and Rhesus negative patterns in males (Table 3). Similarly the study conducted by Kumar et al. (2018) showed the prevalence of Rhesus-positive patterns in females in the order B+ > O+ > A+ > AB+. In the present study, with respect to number, discrepancies in both male and female sexes were also observed in each Rhesus-positive and Rhesus-negative patterns. However, in the overall Rhesus-positive factors males were more frequent, while females were less frequent and vice versa in Rhesus-negative factors (Tables 2 and 3). With regard to ethnic group, Amhara, Oromia, Tigray, Gambela, Afar, Somali and Benishangul gumz regions were represented by the highest Rhesus-positive factors with more frequent in males than in females, while Harari ethnic group represented by equal number of both sexes and SNNP region showed vice versa. Overall, these regions however, exhibit high Rhesus-positive factor frequency than Rhesus-negative factor frequencies (Tables 2 and 3). In addition, Amhara, SNNP, Gambela, Afar, Somali and Benishangul gumz regions were represented by the highest Rhesus-negative factors and highly frequent in males than in females. Harari showed the same trend as Rhesus-positive factor frequency stated above. But Oromia and Tigray regions showed frequency deviation in both sexes with reference to Rhesus-negative prevalence (Tables 2 and 3). On one hand, the study conducted by Atire (2015) indicated that, O+ (32.43%), A+ ( 22.97%), B+ (20.27%), AB+ (2.70%) and B+ (5.41%), A+ ( 4.05%), O+ (2.7%), AB+ (0%) respectively were observed in males and females with Rh-positive. On the other hand, AB- (0%), A- (1.35%), O- (2.70%), B- (4.05%), and B- (0%), AB- (0%), O- (0%), A- (1.35%) respectively were found in Rh-negative males and females who belong to Amhara ethnic group. According to the study of Atire (2015), the order A+ (23.08%), B+ (11.54%), AB+ (1.92%), O+ (30.77%) and A+ (9.62%), B+ (7.70%), AB+ (1.92%), O+ (5.77%) respectively were found in Rh-positive males and females who belong to Oromo ethnic group while Rh-negative males and females respectively show the order A- (0%), B- (1.92%), AB- (0%), O- (1.92% ) and A- (0%), B- (1.92%), AB- (1.92%), O- (0%). Another study conducted by Hussain et al. (2013) reported that, out of the 724 tested subjects 613 (84.67%) subjects were Rh+ and 111(15.33%) subjects were Rh-. Patel et al. (2012) also reported the Rhesus grouping on male’s sex; 28.78% were O+ blood type and the remaining 1.98% was O- blood type.
The ABO and Rh (D) blood groups allelic and genotypic frequencies among Natural and Computational Science Faculty graduating class students
The allelic as well as genotypic frequencies of ABO and Rh (D) groups vary widely across different races and geographical areas of the world (Atire, 2015). In the present study, the results of allelic and genotypic frequencies were estimated by following Hardy-Weinberg assumptions and calculated according to Kumar et al. (2018). The estimated allelic frequencies of the ABO blood types were; 0.314 for IA, 0.2939 for IB and 0.4655 for IO and the calculated genotypic frequencies found to be 0.0985 for IAIA, 0.2923 for IAIO, 0.0863 for IBIB, 0.2736 for IBIO, 0.1845for IAIB and 0.2166 for IOIO. The calculated values revealed that IO and IAIO respectively, exhibit the highest allelic and genotypic frequencies, Whereas, IB and IBIB respectively, found to be the lowest allelic and genotypic frequencies. In the present study, Rhesus blood group allelic and genotypic frequencies were also calculated following Kumar et al. (2018), Wakgari and Getahun, 2019). That is the allelic frequencies for ID = 0.3687 and for Id = 0.6313 were found. The genotypic frequencies found to be 0.1359 for IDID, 0.4655 for IDId and 0.3985 for IdId. Thus, these estimations showed that Id and IDId respectively were the most frequent in allelic and genotypic frequencies. But ID and IDID respectively were the least frequent in allelic and genotypic frequencies (Table 4).
Table 5 indicates that the allelic distribution of Id deviates from the rest of the studies at national and international level. The deviation may be due to allele Id is found in heterozygous form. Genotypic frequencies in Table 5 can also be calculated from allelic frequencies. The frequency dominance of IO in most of the studies in Table 5 may also be due to the fact that A and B blood groups can carry O allele in the heterozygous state, in addition to the homozygous condition.
The ABO and Rh (D) blood groups observed and expected frequencies and Chi-square test
In ABO blood groups, the observed and expected frequencies were not significantly different (Table 6). That is the critical chi-square (0.05, three degree of freedom) = 7.815. Thus, null hypothesis is accepted that it says this population is in Hardy-Weinberg proportions, (χ2 for ABO = 35.4381, which is greater than the critical value, df = 3; P < 0.05). On the contrary, in Rh (D) blood phenotypes the observed and expected frequencies of individuals were significantly different (Table 6). That is the critical chi-square (0.05, one degree of freedom) = 3.841. Thus, the null hypothesis is rejected that it says this population is in Hardy-Weinberg proportions (χ2 for Rh (D) = 0.000011, which is less than the critical value, df = 1; P< 0.05) thus, not fitting Hardy-Weinberg assumptions. However, according to the study of Wakgari and Getahun (2019), the observed and expected frequencies show no significant difference among individuals having both ABO and Rh blood groups (χ2 test for ABO = 0.4729, df = 3 and χ2 test for Rh = 0.0145, df = 1; P < 0.05).

Blood at all times had a special mysteriousness in that lives of individuals depend on it. In the present study the most common blood type is A (28.20%) and O (21.67%) is the least common among the donors (students) in Woldia University. Rh-positive were (60.31%) and Rh-negative were (39.86%). In the present result, it is also common to get specific blood types with less frequency with respect to ethnic group and gender. Individuals should be motivated and persuaded to give blood and make Rh- more available in blood banks. Furthermore, awareness about donation of blood has to be created in order to increase the number of female donors. The allelic and genotypic frequencies were also reported in the present study. However, deviations were observed compared to most studies at national and international levels (Table 5). The difference is may be due to the fact that few alleles are found in heterozygous state in addition to homozygous state. In ABO blood groups, the observed and expected frequencies were not significantly different while Rh (D) blood groups show significance variation (Table 6). The data obtained in the present study could be an important input for blood bank services to have better blood management and safe blood transfusion practices in different regions of Ethiopia and abroad in the future.
The author has not declared any conflict of interests.
The author appreciates Woldia University for its kind cooperation during the study. The volunteer student participants were also highly appreciated for donating their blood. Thanks also go to Woldia blood bank professionals for their assistance in conducting the blood test. Special thanks also go to Woldia blood bank service for providing anti-sera used for blood typing.
REFERENCES
|
Adeyemo OA, Soboyejo OB (2006). Frequency distribution of ABO, Rh blood groups and blood genotypes among the cell biology and genetics students of University of Lagos, Nigeria. African Journal of Biotechnology 5(22):2062-2065.
|
|
|
|
Atire FA (2015). Analysis of the Blood Type and Group among Undergraduate Physics Students of Dilla University, Ethiopia. Hereditary Genetics 4:140.
|
|
|
|
|
Avent ND, Reid ME (2000). The Rh blood group system: a review. Blood 95(2):375-387.
Crossref
|
|
|
|
|
Bakare AA, Azeez MA, Agbolade JO (2006). Gene frequencies of ABO and rhesus blood groups and hemoglobin variants in Ogbomosho, South-West Nigeria. African Journal of Biotechnology 5:224-229.
|
|
|
|
|
Bethesda DL (2005). Blood Groups and Red Cell Antigens. In: The Rh blood group. USA: National Center for Biotechnology Information pp. 1-6.
|
|
|
|
|
Bhasin MK, Chahal SM (1996). Immunology a short course.3rd ed. Wiley's liss New York P 484.
|
|
|
|
|
Canizalez-Román A, Campos-Romero A, Castro-Sánchez JA, López-Martínez MA, Andrade-Muñoz FJ (2018). Blood Groups Distribution and Gene Diversity of the ABO and Rh (D) Loci in the Mexican Population. BioMed Research International.
Crossref
|
|
|
|
|
Daniel HL, Clark AG (2007). Principle of population genetics. 4th ed. Sinaur. Associates. Sunderland, Massachusetts P 633.
|
|
|
|
|
Daniels G (2002). Human blood groups. Blackwell Science, 2nd edition Oxford.
Crossref
|
|
|
|
|
Enosolease ME, Bazuaye GN (2008). Distribution of ABO and Rh-D blood groups in the Benin area of Niger-Delta: Implication for regional blood transfusion. Asian Journal of Transfusion Science 2(1):3-5.
Crossref
|
|
|
|
|
Garraty G, Dzik W, Issitt PD, Lubin DM, Reid ME, Zelinski T (2000). Terminology for blood group antigens and genes-historical origins and guideline in the new millennium. Transfusion 40:477-489.
Crossref
|
|
|
|
|
Hanania S, Hassawi D, Irshaid N (2007). Allele frequency and molecular genotypes of ABO blood group system in a Jordanian population. Journal of Medical Science 7:51-58.
Crossref
|
|
|
|
|
Hussain R, Fareed M, Shah A, Afzal M (2013). Prevalence and gene frequencies of A1A2BO and Rh(D) blood group alleles among some Muslim populations of North India. Egypt Journal of Medicine Human Genetics 14:69-76.
Crossref
|
|
|
|
|
ISBT (2008). International Society of Blood Transfusion "Table of blood group systems".
|
|
|
|
|
Kassahun T, Yohannes P, Mebeaselassie A (2015). Frequency distribution of ABO and Rh blood group alleles in Silte Zone, Ethiopia. Egyptian Journal of Medical Human Genetics 16(1):71-76.
Crossref
|
|
|
|
|
Khalid M, Aslam N, Aslam M, Ahmad R (2013). Distribution of ABO and Rh (D) blood groups among blood donors in district Mardan, Pakistan. Journal of Saidu Medical College 3(2):318-322.
|
|
|
|
|
Khattak ID, Khan TM, Syed P, Shah AM, Ali A (2008). Frequency of ABO and rhesus blood groups in district Swat, Pakistan. Journal of Ayub Medical College Abbottabad 20(4):127-129.
|
|
|
|
|
Knowles S, Poole G (2002). Human blood group systems. In: Murphy MF, Pamphilon DH, editors. Practical Transfusion Medicine. 1st ed. London, UK: Blackwell Science pp. 24-31.
|
|
|
|
|
Kotwal U, Raina TR, Sidhu M, Dogra M (2014). Distribution of ABO & Rh (D) Blood Groups among Blood Donors of Jammu Region with Respect to Various Ethnic Groups. Journal Medical Thesis 2(1):31-34.
|
|
|
|
|
Kumar S, Modak PK, Ali SH, Barpanda SK, Gusain VS, Roy R (2018). A retrospective study: ABO and Rh phenotype blood group distribution among blood donors in H.N.B. Base Hospital, Srinagar, Uttarakhand. Indian Journal of Family Medicine Primary Care 7:34-38.
Crossref
|
|
|
|
|
Lemu G, Arega T, Berhanu E, Hassen M (2017). High rhesus Rh (D) negative frequency and ethnic‑group based ABO blood group distribution in Ethiopia. BMC research notes 10(1):330.
Crossref
|
|
|
|
|
Murphy WJ, Fronicke L, O'Brien SJ, Stanyon R (2003). The Origin of Human Chromosome 1 and Its Homologs in Placental Mammals. Genome Research 13(8):1880-1888.
Crossref
|
|
|
|
|
Murray RK, Granner DK, Mayes PA, Rodwell VW (2003). Harper"s Illustrated Biochemistry 26th Edition, a Lange medical book McGraw-Hill Companies.
|
|
|
|
|
Mwangni J (1999). Blood group distribution in an urban population of patient targeted blood donors. East African Medical Journal 76(11):615-618.
|
|
|
|
|
Nwauche CA, Ejele OA (2004). ABO and rhesus antigens in a cosmopolitan Nigeria population. Nigerian Journal of Medicine 13(3):263-266.
|
|
|
|
|
Omotade OO, Adeyemo AA, Kayode CM, Falade SL, Ikpeme S (1999). Gene frequencies of ABO and Rh (D) blood group alleles in a healthy infant population in Ibadan, Nigeria. West African Journal of Medicine 18:294-297.
|
|
|
|
|
Patel PA, Patel SP, Shah JV, Oza HV (2012). Frequency and distribution of blood groups in blood donors in western ahmedabad a hospital based study. National Journal of Medical Research 2:202-206.
|
|
|
|
|
Pramanik T, Pramanik S (2000). Distribution of ABO and Rh blood groups in Nepalese medical students: a report. Eastern Mediterranean Health Journal 6(1):156-158.
|
|
|
|
|
Rahman M, Lodhi Y (2004). Frequency of ABO and Rhesus blood groups in blood donors in Punjab. Pakistan Journal of Medical Science 20:315-318.
|
|
|
|
|
Rayhana S, Zaida R, Asadul M, Rabeya Y, Shyamoli M,Abdus S, Mainul H (2013). Study of ABO and Rh-D blood groups among the common people of capital city of Bangladesh. International Journal of Pharmacy and Pharmaceutical Sciences 5(3).
|
|
|
|
|
Saladin K (2003). Anatomy and Physiology: The unity of Form and Function, 3rd edition. The McGraw- Hill Companies, USA. pp. 679- 698.
|
|
|
|
|
Sidhu S, Sidhu LS (1980). ABO blood group frequencies among the Sansis of Punjab. Collegium Antropologicum 4:55-58.
|
|
|
|
|
Sutton HE (1980). An Introduction to Human Genetics. 3rd ed. Philadelphia USA: Saunders College. P. 592.
|
|
|
|
|
Swamy CM, Basavaraj PB, Kavitha GU, Shashikala P (2012). Prevalence of ABO and Rhesus blood group among blood donors. Indian Journal of Public Health Research & Development 3:106-109.
|
|
|
|
|
Tekade R, Warghat N, Sharma N, Wankhade A, Baig M (2011). Gene Diversity among some endogamous population of Amravati District. Journal of Biotechnology 2(5):558-567.
Crossref
|
|
|
|
|
Wakgari F, Getahun DD (2019). Distribution of ABO and Rh (D) blood groups among students attending secondary and preparatory schools in Bote town, Oromia national regional state, Ethiopia. International Journal of Science and Technology Educational Research 10(1):1-8.
Crossref
|
|
|
|
|
Yassin W (2013). Frequency of ABO and Rhesus (RhD) blood group alleles among students of Oromo ethnic group belonging to Arsi, Guji, and Borena clans in Robe college of teachers education, Ethiopia A Thesis Submitted to the School of Graduate Studies, Haramaya university in partial fulfillment of the requirements for the Degree of Master of Science in Genetics.
|
|
|
|
|
Zahid H, Yahyaoui A, Uwingabiye J, El Khazraji A, El Hadef R, Messaoudi N (2016). Phenotypic and allelic distribution of ABO and Rh-D blood Groups in Blood Transfusion Center of Avicenna Military Hospital, Marrakech, Morocco. International Journal of Medicine and Health Research 2(1):1-9.
|
|