ABSTRACT
Genetic variability is a prerequisite to crop improvement. The objective of the present study was to assess and quantify the genetic variability, estimate heritability and genetic advance for yield and yield contributing characters of released and pipeline chickpea varieties based on agro- morphological traits. A total of 16 chickpea materials (8 improved varieties, 7 advanced lines, and one local check) were planted in Randomized Complete Block Design (RCBD) with three replications at Shambu, Hawa Galan, Mata, Alaku Belle, and Badesso, in Western Ethiopia. Important agronomic data were collected and subjected to analysis using statistical analysis software (SAS). The combined analysis of variance (ANOVA) indicated highly significant differences (P≤0.01) among chickpea genotypes for grain yield and other agronomic traits except for number of seed per pod and branch per plant, indicating the existence of ample genetic variability among present chickpea genotypes. Genotypic coefficient of variation (GCV) and phenotypic coefficient of variation (PCV) for the character such as grain filling duration, days to flowering and hundred seed weight, showed very small difference demonstrating that the observed variations for these traits were mostly due to genetic factors with little impact of environment. The higher heritability coupled with higher genetic advance was noted for 100 seed weight, number of pods per plant, number of seed per pod and grain yield signifying the ease of phenotype-based selection for the improvement of those traits.
Key words: Chickpea (Cicer airetinum L.), genetic variability, phenotypic coefficient of variation (PCV), genotypic coefficient of variation (GCV), selection.
Among pulses, chickpea (Cicer arietinum L.) is the fourth leading grain legume primarily grown for food and feed as well as soil fertility amendment in Ethiopia (CSA, 2015). Besides, Ethiopia is known as secondary center of origins for different crop in general and for chickpea in particular. Regardless of its importance and presence of immense genetic variability, its yield is by far below its potential. This yield gap can be altered through proper manipulation of variable genotypes and thereby used in a breeding program. The main objective of any breeding programs in the world is to produce high-yielding and better-quality lines for release as cultivars to farmers and commercial growers. The prerequisite to achieving this goal is to find sufficient amount of variability.
For long-time, plant breeders were aware that predominant portion of phenotypic variation were accounted for by environmental variation than from genotypes and genotypes by environmental interactions. Thus, in-depth knowledge of genetic variation has paramount importance for yield and its component improvement in any crop as the observed variability is a combined effect of genetic, environments and various interactions between genes and environments, of which only the former one is heritable. Genotypic variability is, therefore, the component of variation which is due to the genotypic differences among individuals within a population and is the main concern of plant breeders all over the world (Tadesse et al., 2016).
Selection would generate promising genotypes only if the source germplasms used in crossing are genetically diverse (Ali et al., 2008). When genetically diverse parents were chosen for crossing, there is a likelihood of producing heterotic progenies and advance required genetic recombination. However, the amount of genetic variability present in any genotypes will not merely dictate the selection of superior genotypes. Therefore, in addition to the existence of genetic variability, the extent to which the characters in questions are transmitted from parents to offspring is very important to draw realistic conclusion vis-à-vis superior selections (Falconer and Mackay, 1996). Transmission of a quantitative trait from parents to offspring which by itself is highly influenced by genotype and environment interaction and traits with low heritability might not be improved through selection.
Additionally, the estimates of heritability alone do not lonely deliver an idea about the expected gain in the next generation but should be considered in conjunction with estimates of genetic advance, the change in the mean value among successive generations (Johnson et al., 1955; Shukla et al., 2006). Assessment of genetic variability using appropriate tools such as genetic coefficient of variation, heritability estimates, and genetic advance is, therefore, undeniably indispensable to boost yield as well as the quality of any crop and/or forage in any breeding program (Ali et al., 2008). The objective of the present study was, therefore, to assess and quantify the genetic variability of chickpea germplasm grounded on agro-morphological traits and evaluating heritability and genetic advance among desi type chickpea genotypes for yield and yield contributing characters.
Experimental sites, designs and experimental materials
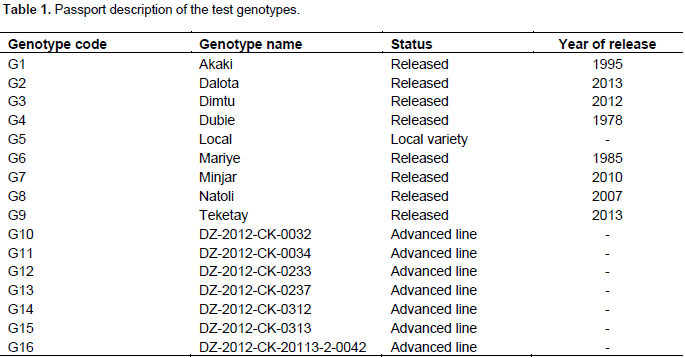
A field experiment was conducted at five locations viz., Shambu (09° 32'N 037° 04'E), Hawa Galan (08° 38' N 034° 50'E), Mata (08° 34' N 034° 44'E), Alaku Belle (08° 37'N 034° 42'E) and Badesso (034° 42'E 034°47'E), Western Ethiopia, during the 2016/2017 main cropping season. A total of 16 Desi type chickpea varieties viz., 8 cultivars released over three decades, 1 local variety and 7 advanced lines collected from Debre Zeit Agricultural Research Center (DZARC) were used (Table 1). The experiment was laid out in a randomized complete block design with three replicates and with plot size of 3 m length and 1.8 m width. All other crop management practices and recommendations were applied uniformly to all varieties as recommended for the crop.

Statistical analysis
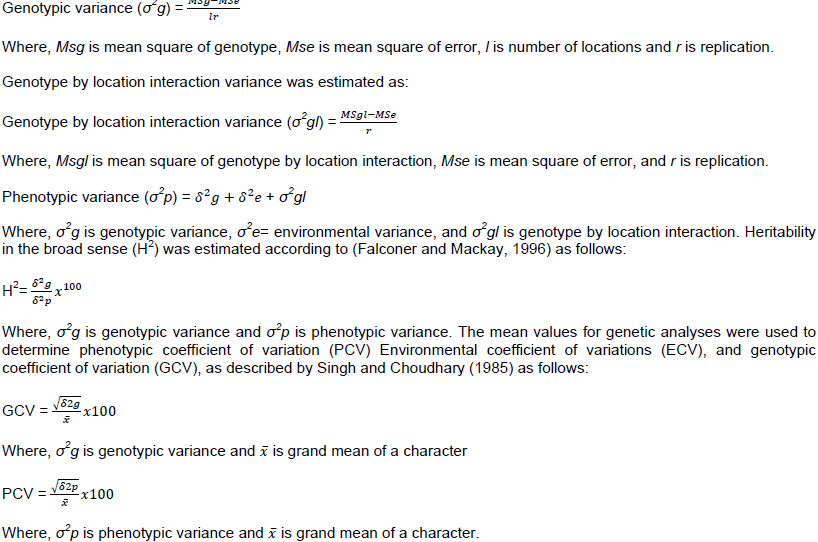
Days to 50% flowering, days to 90% maturity, grain filling duration, number of pods per plant, number of seed per pod, plant height, number of branches per plant, hundred seed weight, and grain yield data were collected as suggested in IBPGR, ICRISAT, ICARDA (1993) and were subjected to analysis using appropriate software. Analysis of variance (ANOVA) using randomized complete block design was computed for all measured characters using SAS (SAS Institute, 2003). Genotypic (σ2g), genotype by location interaction (σ2gl) and phenotypic variances (σ2p) were obtained from the analysis of variance (ANOVA) table according to Comstock and Robinson (1952) as follows,
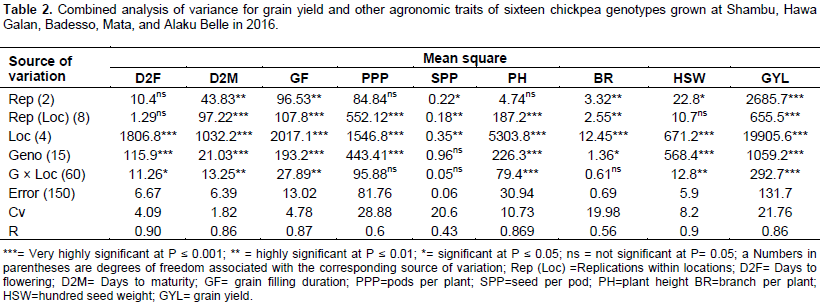
The combined analysis of variance (ANOVA) for grain yield and other agronomic traits of 16 chickpea genotypes grown at five locations in 2016/2017 is shown in Table 2. The analysis of variance (ANOVA) indicated highly significant differences (P≤0.01) among chickpea genotypes for grain yield and other agronomic traits except for seed per pod and branch per plant demonstrating the presence of ample genetic variability among chickpea genotypes. Once the presence of genetic variability is secured, it is the task of the breeder to separate the heritable portion from the non-heritable part to plan for the proper breeding program. This might give an opportunity to plant breeders to improvement of characters with high heritability via selection.
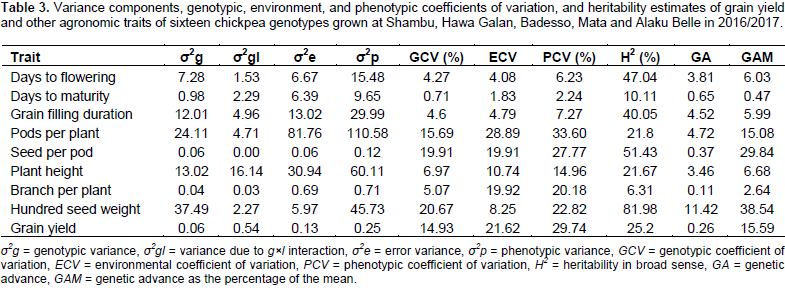
Splitting the total phenotypic variance into the genotypic, genotype by environment interaction, and error variances were done on their expected mean squares (EMS) as per the fixed effects model. The genotypic variance (σ2g) accounts for low proportion of the total phenotypic variance (σ2p) as compared to the variances due to error (σ2e) in most of the traits studied (Table 3). This shows that the observed phenotypic differences were not alone due to inherent genetic differences among the genotypes but also the substantial portion was due to environmental factor and the interplay between environment and genotype. Genotypic variance, phenotypic variance, genotypic coefficient of variability (GCV), environmental coefficient of variation (ECV), phenotypic coefficient of variability (PCV), broad sense heritability, and genetic advance for nine (9) agronomic characters are shown (Table 3).

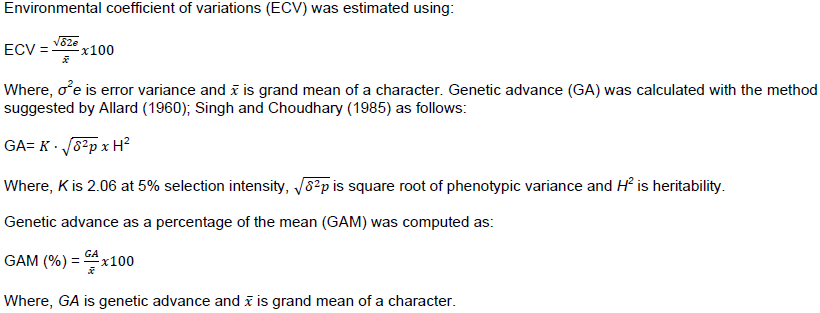
Estimates of phenotypic coefficients of variation (PCV) and genotypic coefficients of variation (GCV) ranged from 2.24 (for days to maturity) to 33.60% (for number of pod per plant) and 6.71 (for days to maturity) to 20.67% (for 100 seed weight), respectively. Likewise, estimates of environmental coefficient of variation ranged from 1.83 (for days to maturity) to 28.89 (for number of pods per plant) (Table 3). Ali et al. (2010) also reported lowest phenotypic and environmental coefficient of variation for days to maturity in chickpea. Deshmukh et al. (1986) classified PCV and GCV values as low (0-10%), moderate (10 - 20%) and high (>20%). Reliant on this suggestion, high GCV was observed for 100 seed weight, and moderate GCV was observed for number of seed per pod, number of pods per plant, and grain yield.
The low value of a genotypic coefficient of variation (GCV) and phenotypic coefficient of variation (PCV) was noted for characters such as days to 50% flowering and days to maturity. Similar result was reported in numerous findings (Panwar and Singh, 2000; Bergale et al., 2001; Dwivedi et al., 2008; Khodadadi et al., 2011; Kumar et al., 2011).The result of GCV expresses the true genetic potential of the genotypes. In the present study, the PCV values were higher than the corresponding GCV suggesting the existence of substantial environmental variation. This result was completely in agreement with the result of combined analysis of variance (ANOVA) table. However, traits such as grain filling duration, days to flowering and 100 seed weight, which showed very small difference indicating the observed variations for these traits were mostly due to genetic factors with little environmental factors.
Estimation of broad sense heritability, genetic advance (at 5% selection intensity) and the corresponding genetic advance as a percent of the mean were estimated for each measured character. Heritability estimates are classified as low (5-10%), medium (10-30%) and high (30-60%) (Dabholkar, 1992). The broad sense heritability (H2) values more than 80% was observed for 100 seed weight. This implies that the expected gain from selection would be high if this trait is used as selection criteria in chickpea breeding. Traits having high heritability combined with genetic advance could result in a better genetic gain through selection since the variation that prevails in such a trait is due to additive gene action (Johnson et al., 1955; Vimal and Vishwakarma, 1998). Hundred seed weight, number of pods per plant, number of seed per pod and grain yield showed high heritability combined with high genetic advance as a percentage of the mean which could be used as a powerful tool in phenotypic selection as such characters are controlled by the additive genes and less influenced by the environment.
Genetic gain (GAM) that could be expected from selecting the top 5% of the genotypes as a percent of the mean, varied from 0.47% for days to maturity to 38.54% for 100 seed weight. According to Johnson et al. (1955), genetic advance as a percent of the mean was categorized as high (≥20%), moderate (10-20%) and lower (0-10%). Depending on this delineation, number of seed per pod and 100 seed weight showed high genetic advance as a percent of the mean, whereas number of pods per plant and grain yield showed moderate genetic advance as a percent of the mean. Therefore, selection based on traits with a high-level genetic advance as a percent of the mean will result in the improvement of the performance of the genotypes.
It can be concluded that direct selection can be done for most of the yield attributing traits since it exhibited high genetic variability and high range of variation. Traits with high heritability and genetic advance such as 100 seed weight, number of seed per pod and grain yield will grant superior genotypes through phenotypic based selection.
The authors have not declared any conflict of interests.
The authors are grateful for the chickpea peer grant scheme (USAID) and Oromia Agricultural Research Institute for financial support.
REFERENCES
|
Ali Q, Ahsan M, Farooq J (2010). Genetic variability and trait association in chickpea (Cicer arietinum L.) genotypes at seedling stage. Electron. J. Plant Breed. 1(3):334-341.
|
|
|
|
Ali Y, Atta BM, Akhter J, Monneveux P, Lateef Z (2008). Genetic variability, association and diversity studies in wheat (Triticum aestivum L.) germplasm. Pak. J. Bot. 40(5):2087-2097.
|
|
|
|
|
Allard I (1960). Principles of Plant Breeding, Chapter 6 through Chapter 9, University of California, Davis.
|
|
|
|
|
Bergale S, Mridulla B, Holkar AS, Ruwali KN, Prasad SVS (2001). Genetic variability, diversity and association of quantitative traits with grain yield in bread wheat (Triticum aestivum L.). Madras Agric. J. 88(7):457-460.
|
|
|
|
|
Comstock RE, Robinson HF (1952). Genetic parameters, their estimation and significance. In: Proceedings of the 6th International Grassland Congress 1:248-291.
|
|
|
|
|
Central Statistical Agency (CSA) (2015). Crop and livestock product utilization. Statistical Bulletin. Addis Ababa, Ethiopia.
|
|
|
|
|
Dabholkar AR (1992). Elements of Biometrical Genetics. Concept Publishing Company, New Delhi 110059. P 431.
|
|
|
|
|
Deshmukh SN, Basu MS, Reddy PS (1986). Genetic variability, character association and path coefficients of quantitative traits in Virginia bunch varieties of groundnut. Indian J. Agric. Sci. 56:816-821.
|
|
|
|
|
Dwivedi SL, Upadhyaya HD, Stalker HT, Blair MW, Bertioli DJ, Nielen S, Ortiz R (2008). Enhancing crop gene pools with beneficial traits using wild relatives. Plant Breed. Rev. 30:179-187.
Crossref
|
|
|
|
|
Falconer DS, Mackay TC (1996). Introduction to quantitative genetics. John Willey and Sons. Inc. pp. 313-320.
|
|
|
|
|
IBPGR, ICRISAT, ICARDA (1993). Descriptors for Chickpea (Cicer arietinum L.). International Board for Plant Genetic Resources, Rome, Italy; International Crops Research Institute for the Semi-Arid Tropics, Patancheru, India; International Center for Agricultural Research in the Dry Areas, Aleppo, Syria.
|
|
|
|
|
Johnson HW, Robinson HF, Comstock RE (1955). Estimates of genetic and environmental variability in soybeans. Agron. J. 47(7):314-318.
Crossref
|
|
|
|
|
Khodadadi M, Fotokani MH, Miransari M (2011). Genetic diversity of wheat (Triticum aestium L) genotypes based on clusters and principal component analyses for breeding strategies. Aust. J. Crop Sci. 5(1):17-22.
|
|
|
|
|
Kumar S, Singh AK, Singh R (2011). Diversity analysis of wheat genotypes based on morpho-physiological and RAPD markers in relation to moisture stress. Vegetos 24(2):217-224.
|
|
|
|
|
Panwar D, Singh I (2000). Genetic variability and character association of some yield components in winter x spring nursery of wheat. Adv. Plant Sci. 8(1):95-99.
|
|
|
|
|
SAS Institute (2003). SAS/STAT guide for personal computers, version 9.1 edition. Cary, NC: SAS Institute Inc.
|
|
|
|
|
Shukla S, Bhargava A, Chatterjee A, Srivastava A, Singh SP (2006). Genotypic variability in vegetable amaranth (Amaranthus tricolor L) for foliage yield and its contributing traits over successive cuttings and years. Euphytica 151(1):103-110.
Crossref
|
|
|
|
|
Singh RK, Chaudhary BD (1985). Analysis in biometrical genetics. Kalyani Publisher, New Delhi, India.
|
|
|
|
|
Tadesse M, Fikre A, Eshete M, Girma N, Korbu L, Mohamed R, Bekele D, Funga A, Ojiewo CO (2016). Correlation and Path Coefficient Analysis for Various Quantitative Traits in Desi Chickpea Genotypes under Rainfed Conditions in Ethiopia. J. Agric. Sci. 8(12):112-118.
Crossref
|
|
|
|
|
Vimal SC, Vishwakarma SR (1998). Heritability and genetic advance in barley under partially reclaimed saline-sodic soil. Rachis (1-2): 56-57.
|
|