ABSTRACT
This is an investigation of equinoctial asymmetry in Total electron content (TEC) variability at Niamey (Latitude: 13° 30' 49.18" N, Longitude: 2° 06' 35.28" E) using the Global Ionospheric Maps model constructed by the Center for Orbit Determination in Europe (CODG model) during solar cycle 23, that is, from year 1999 to year 2009. Niamey Center for Orbit Determination in Europe Total Electron Content (CODG TEC) from 1999 to 2009 show that ionization follows solar cycle and presents semi-annual variation with equinoctial asymmetry. In CODG TEC, generally, March/April maximum density is larger than that of September/October except during years 1999 and 2001. For all years (1999-2008), electronic density is higher between 1400 and 1700 UTC with the maximum at 1400 UTC. On one hand, Ap and aa index via pixel diagram and on the other hand, seasonal and sunspot cycle variation have been used to explain the exception of years 1999 and 2001. It was found that asymmetry of 1999 is due to solar wind particularly to fluctuating wind and asymmetry of 2001 results from CMEs.
Key words: Global positioning system (GPS), Center for Orbit Determination in Europe Total Electron Content (CODG TEC), ionization, asymmetry, equatorial ionosphere.
The equinoctial asymmetry in monthly or seasonal ionospheric parameters such as foF2, NmF2, TEC (Rishbeth et al., 2000; Chakraborty and Hajra, 2008; Ouattara et al., 2012; Nanéma and Ouattara, 2013; Hajra et al., 2016) and in geomagnetic activity (Green, 1984; Cliver et al., 2000; 2002; Chakraborty and Hajra, 2010; Hajra et al., 2013) have been intensively investigated and three principal hypotheses or mechanisms are proposed to explain such variation: (1) axial mechanism (Bohlin, 1977) for which the peak occurrence times correspond to those of the maximum of solar B0 angle (Cliver et al., 2000). This mechanism is also explained by seasonal variation of solar wind speed (Murayama, 1974); (2) equinoctial mechanism (Svalgaard, 1977) where the peak occurrence times are those of the minima of the solar declination (Cliver et al., 2000 and (3) Russell-McPherron mechanism (Russell and McPherron, 1973) where the peak occurrences are due to those of the maximum of solar P angle.
The solar B0 angle corresponds to Earth’s heliographic latitude; and the solar P angle is the position angle of the northern extremity of the Sun’s rotation axis, measured eastward from the north point of the disk (Cliver et al., 2002). For the understanding of the response of CODG model in West Africa region, we morphologically analyse CODG TEC time variation from 1999 to 2009 as a function of sunspot number R12. Pixel diagrams were also built with geomagnetic aa and Ap indices. The three mechanisms (Axial, Russell McPherron and equinoctial) were verified for explaining ionospheric semi-annual variation. One of the goals of the present paper is to determine a possible cause of the asymmetry.
The Total Electron Content (TEC) at Niamey station (Geo Lat 13°28’45.3”N; Geo Long: 02°10’59.5”E) during solar cycle 23 was determined using the model of the coefficients of the ionosphere given by Centre for Orbit Determination in Europe (CODE). The CODE is one of the centres of analysis of International GNSS Service (IGS,
http://www.igs.org/network). The Global Ionospheric Maps model constructed by the Center for Orbit Determination in Europe (GIM/CODE or CODG model) is used to get the Total Electron Content. Throughout the paper TEC obtained with the GIM/CODE model is called CODG TEC. The database includes:
(1) CODG TEC computed at Niamey station (Geo Lat 13°28’45.3”N; Geo Long: 02°10’59.5”E) in Niger by using IGS database where IGS means International GNSS (Global Navigation Satellite Systems) Service. These data can be found at http://igscb.jpl.nasa.gov;
(2) Geomagnetic index aa (Mayaud, 1968, 1971, 1972, 1973), taken from SPIDR database (
http://isgi.unistra.fr/data_download.php), permits the evaluation of different geomagnetic conditions (quiet and disturbed conditions).
(4) The planetary index Ap, obtained from NGDC database (
http://www.ngdc.noaa.gov), characterizes the geoeffectivity of solar particles (Chapman and Bartels, 1940) from coronal holes (Nolte et al., 1976).
It is well known that there are three types of solar winds (Legrand and Simon, 1989; Simon and Legrand, 1989; Richardson et al., 2000; Richardson and Cane, 2002; Ouattara and Amory Mazaudier, 2009): (1) high stream solar wind speed coming from coronal holes; (2) slow solar wind coming from solar heliosheath and (3) fluctuating solar wind due to the fluctuation of solar neutral sheet. It can be noted that: (1) Ap index permits the evaluation of the impact of each type of solar wind (high solar wind speed, slow solar wind and fluctuating solar wind). In fact, this parameter is correlated to solar wind velocity (Snyder et al., 1963; Crooker et al., 1977; Ahluwalia et al., 1994); moreover, it gives a possibility to evaluate the response of the magnetosphere to solar wind inhomogeneity (Dessler and Fejer, 1963); Tsurutani et al. (1995, and references therein) pointed out that Alfvén waves are able to provoke geomagnetic disturbances in high latitudes via their southward magnetic field components.
These disturbances are taken into account in the determination of Ap values (Ahluwalia, 2000). The other sources which contribute to the estimation of Ap values are coronal mass ejections (CMEs) (Gosling, 1976; Newkirk et al., 1981) which was first observed by using the coronagraph installed on board The Seventh Orbiting Solar Observatory (OSO-7 satellite) launched on 29 September 1971 (Ahluwalia, 2000). (2) aa index permits the evaluation of different geomagnetic conditions (quiet and disturbed conditions) and particularly the determination of each class of activity by means of pixel diagrams (Ouattara and Amory-Mazaudier, 2009). In the present paper, monthly CODG TEC are analysed with attention focused on equinoctial peaks and their asymmetry in order to determine its probable solar sources. This will be done not only by means of pixel diagrams but also by the use of Cliver et al. (2002) results.
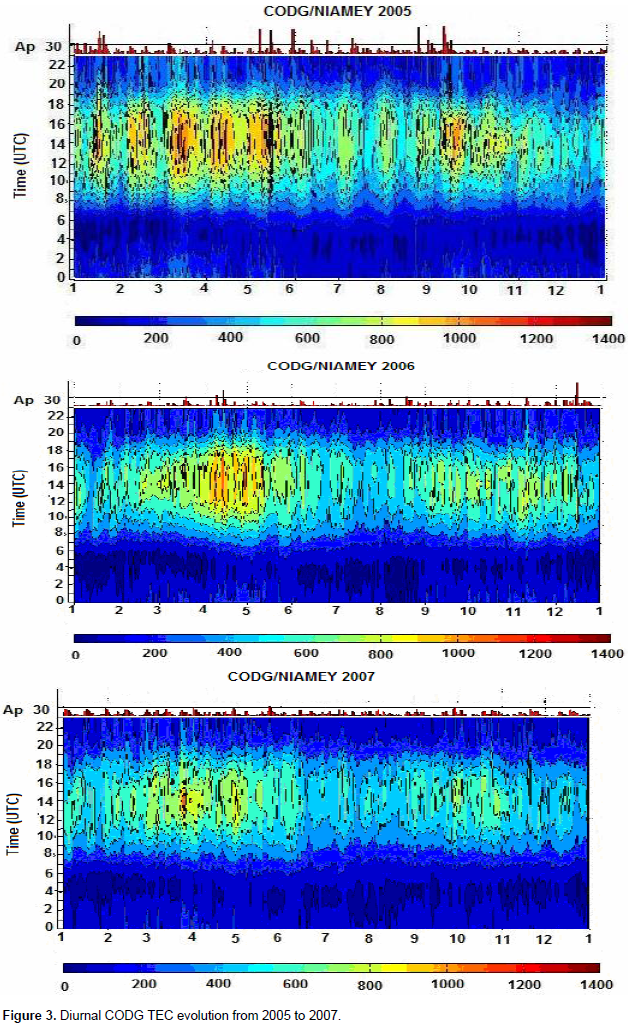
Here, the results and analysis were first presented followed by expose of the possible source the peak asymmetry. Figures 1, 2 and 3 give monthly CODG TEC variation from year 1999 to 2007 at Niamey Station. In the top of each panel, red colour shows Ap index monthly variation. In each panel, months are given in abscises axis and universal time calculate (UTC) in ordinates axis. In this figure, TEC is expressed in the unit of 1015 el/m2 (TECU) and colour code starts from blue (corresponding to zero) to red (corresponding to 1400 TECU). CODG TEC highlights semi-annual variation which is well known in ionosonde data monthly variation. It can be seen in Figures 1, 2 and 3 that the equinoctial maxima and its asymmetry; in general, the maxima of October are superior to those of March except in 1999 and 2001 where it is opposite. Ionization is maximal between 1200 UTC and 1700 UTC with its maximum density at 1400 UTC for all panels.


Moreover, it can be noted that on one hand, the intensity of the equinoctial maxima varies with solar cycle (R12) and on the other hand, TEC intensity is correlated with the Ap value. Figure 4 shows monthly TEC (red) and monthly R12 (blue) evolution from 2000 to 2010 which shows that annual TEC varies with sunspot number; in consequence, annual electronic density can be expressed as a function of sunspot number. Figure 5 shows season variation of CODG TEC during quiet time characterized by days where aa ≤ 20 nT (panel a) and during disturbed period characterized by aa > 20 nT (panel b). This figure exhibits that the highest peaks appear during solar maximum. This result is consistent with the ionosonde data of Ouagadougou Station as reported by Ouattara et al. (2009). In panel a, one can see the peak asymmetry and March/April peak is higher than that of September/October for all years except these of 1999 and 2001 where it is the opposite. The comparison between results of panels a and b shows that peak amplitude is higher during disturbed period than that of quiet period and the disturbed condition does not modify the asymmetry observed during quiet time. Analyses of these TEC variations will allow us appreciate (1) the annual variation of the ionosphere and the effect of solar phases on the ionosphere and (2) the impact of solar events on ionosphere.


Possible sources of CODG TEC seasonal asymmetry
To determine the source of CODG TEC asymmetry, sunspot number R12, geomagnetic Ap index, pixel diagrams and the results of Cliver et al. (2002) were used.
a) CODG TEC asymmetry source according to sunspot number
Figure 6 gives seasonal TEC variation at 1200 UT as a function of sunspot number R12 from 1999 to 2008. The green graph concerns local summer season (July month); blue graph is devoted to spring season (March/April); and pink graph highlights autumn season (September/October) TEC variations. Chestnut graph gives winter season (January) TEC variations. Each graph symbol corresponds to one year. From bottom to up, year increases from 1998 to 2007. From Figure 6 it can be concluded that there is linear dependency between seasonal TEC and sunspot number R12. When R12 is less than 96, TEC increases linearly with R12 and the correlation coefficient is in range [0.924, 0.984]. For a given sunspot number, July TEC is the largest than the others. The analysis of Figure 6 exhibits that (1) CODG TEC increases linearly with sunspot number until CODEG TEC is less than 100 TECU, (2) CODG TEC does not show winter anomaly because summer CODG TEC is always larger than that of winter and (3) for R12 = 42, R12 = 76 and R12 = 102 there is no equinoctial asymmetry.

c) CODG TEC asymmetry source according to pixel diagrams
Figure 8 shows pixel diagrams for year 1999 (top panel) and year 2001 (bottom panel). Each line of the pixel shows a 27-day rotation, and successive lines solar rotations. Each number is the daily average of aa index. Shock activity started by non-recurrent sudden storm commencement (SSC) days (
http://isgi.unistra.fr/data_download.php) (indicated by circle) with one, two or three days’ duration and identified in pixel diagram by olive red and/or red colours. Recurrent activity is characterized by recurrent red or olive red colours without begging SSC days. Quiet days activity is given by white and blue colours with the other days contributing to fluctuating activity. Each class of activity can be shown in Figure 8. It emerges from Figure 8 with respect to the work of Ouattara (2009) that asymmetries are more due to intense solar activity during October month than during March month. In pixel diagram of the year 1999 (Figure 8a), the asymmetry results from fluctuating activity due to the fluctuating solar wind (Ouattara, 2009) provoked by the fluctuation of solar neutral sheet (Legrand and Simon, 1989). In pixel diagram of the year 2001 (Figure 8b), the asymmetry is due to CMEs (Ouattara, 2009). Thus, the results obtained from the analysis of pixel diagrams and from the use of Ap index are the same.

d) CODG TEC asymmetry source according to the results of Cliver et al. (2002)
Cliver et al. (2002) gives the dates of peaks of semi-annual variation of geomagnetic index aa during quiet time and disturbed period and the mechanism that likely explained such variation. The periods of the peak occurrence obtained from their work is given in the top of Tables 1 (disturbed period) and 2 (quiet period). For analysing the results of this research, the gap (shown by D in the table) between their peak date with respect to the mechanism and the observed peak date was determined. Observed dates are indicated in red and the possible mechanism is given by minimum value of D. This minimum value is highlighted in green. Tables 1 and 2 show that the semi-annual variation of CODG TEC at Niamey during the years 1999 and 2001 is managed by Russell McPherron mechanism.
The presence of equinoctial peak asymmetry for the year 2001 cannot be explained by the change mechanism for it is the same mechanism for March/April and for September/October. During year 1999, the asymmetry may be explained by the change of mechanism. During March/April, the mechanism is equinoctial and during September/October it is Russell McPherron. Only the year 2006 semi-annual variation is completely explained by Russell McPherron mechanism and that during both quiet and disturbed periods. The synthesis (Table 3) of the mechanism that occurs during the 11 years involved (quiet time) and 10 years involved (disturbed period) shows that Russell McPherron mechanism can be used to explain the CODG TEC semi-annual variation at Niamey Station.
Seasonal CODG TEC presents semi-annual variation with maximum TEC observed between 1000 - 1500 UTC. The peak is seen at 1400 UTC. The seasonal CODG TEC shows equinoctial peak asymmetry. March/April peak amplitude is higher than that of September/October except during 1999 and 2001. Ap values analysis and pixel diagrams investigation show that peak asymmetry is due to moderate solar wind during 1999 and similar to CMEs during 2001. This study argues that in 2001 the asymmetry cannot be explained by the change in solar activity while this situation seems to be the cause of the asymmetry observed during 1999. The overview of TEC behaviour shows that Russell McPherron mechanism manages the semi-annual variation of TEC at Niamey station.
The authors have not declared any conflict of interests
REFERENCES
|
Ahluwalia HS (2000). Ap time variations and interplanetary magnetic field intensity. J. Geophys. Res. 105(A12):27481-27487.
Crossref
|
|
|
|
Ahluwalia HS, Xue SS, Fikani MM (1994). Geomagnetic activity index and solar wind speed for solar cycles, in 8th International Solar-Terrestrial Physics Symposium, Sendai edited by H. Oya, G. Rostoker 1(120). Tohuko University Press Sendai.
|
|
|
|
|
Bohlin JD (1977). Extreme-ultraviolet observations of coronal holes. Sol. Phys. 51:377
Crossref
|
|
|
|
|
Chakraborty SK, Hajra R (2008). Solar control of ambient ionization of the ionosphere near the crest of the equatorial anomaly in the Indian zone. Ann. Geophys. 26:47.
Crossref
|
|
|
|
|
Chakraborty SK, Hajra R (2010). Variability of total electron content near the crest of the equatorial anomaly during moderate geomagnetic storms. J. Atmos. Sol. Terr. Phys. 72:900.
Crossref
|
|
|
|
|
Chapman S, Bartels J (1940). Geomagnetism. Vol. 2. Oxford Univ. Press, London P 601.
|
|
|
|
|
Cliver EW, Kamide Y, Ling AG (2000). Mountains vs. valleys: The semiannual variation of geomagnetic activity. J. Geophys. Res. 105:2413.
Crossref
|
|
|
|
|
Cliver EW, Kamide Y, Ling AG (2002). The semiannual variation of geomagnetic activity: phases and profiles for 130 years of aa data. J. Atmos. Sol. Terr. Phys. 64:47–53.
Crossref
|
|
|
|
|
Crooker NU, Feynman J, Gosling JT (1977). On high correlation between long term averages of solar wind speed and geomagnetic activity. J. Geophys. Res. 82:1933-1937.
Crossref
|
|
|
|
|
Dessler AJ, Fejer JA (1963). Interpretation of Kp index and M-region geomagnetic storms, Planet. Space Sci. 11:505-511.
Crossref
|
|
|
|
|
Gosling JT (1976). Transient phenomena in the solar atmosphere and solar wind, in Physics of Solar Planetary Environments, edited by DJ. Williams, AGU pp. 286-303.
Crossref
|
|
|
|
|
Green CA (1984). The semiannual variation in the magnetic activity indices Aa and Ap. Planet. Space Sci. 32:297.
Crossref
|
|
|
|
|
Hajra R, Echer E, Tsurutani BT, Gonzalez WD (2013). Solar cycle dependence of High-Intensity Long-Duration Continuous AE Activity (HILDCAA) events, relativistic electron predictor? J. Geophys. Res. 118:5626.
Crossref
|
|
|
|
|
Hajra R, Chakraborty SK, Tsurutani BT, DasGupta A, Echer E, Brum CGM, Gonzalez WD, Sobral JHA (2016). An empirical model of ionospheric total electron content (TEC) near the crest of the equatorial ionization anomaly (EIA). J. Space Weather Space Clim. 6:A29.
Crossref
|
|
|
|
|
Legrand JP, Simon PA (1989). Solar cycle and geomagnetic activity: A review for geophysicists. Part I. The contributions to geomagnetic activity of shock waves and of the solar wind. Ann. Geophys. 7(6):565-578.
|
|
|
|
|
Mayaud PN (1968). Indices Kn, Ks et Km, 1964-1967, 156 pages, Ed. CNRS, Paris.
|
|
|
|
|
Mayaud PN (1971). Une mesure planétaire d'activité magnétique basée sur deux observatoires antipodaux. Ann. geophys. 27:71.
|
|
|
|
|
Mayaud PN (1972). The aa indices: a 100-year series characterizing the magnetic activity. J. Geophys. Res. 77(34):6870-6874.
Crossref
|
|
|
|
|
Mayaud PN (1973). A hundred year series of geomagnetic data. 1868-1967, IAGA Bull. 33, Zurich 251p.
|
|
|
|
|
Murayama T (1974). Origin of the semiannual variation of geomagnetic Kp indices. J. Geophys. Res. 79:297.
Crossref
|
|
|
|
|
Nanéma E, Ouattara F (2013). HmF2 quiet time variations at Ouagadougou and comparison with IRI-2012 and TIEGCM predictions during solar minimum and maximum. Arch. Appl. Sci. Res. 5(5):55-56.
|
|
|
|
|
Newkirk GA, Hundhausen J, Pizzo V (1981). Solar cycle modulation of galactic cosmic rays: Speculation on the role of coronal transients. J. Geophys. Res. 86:5387-5396.
Crossref
|
|
|
|
|
Nolte JT, Krieger AS, Timothy AF, Gold RE, Roelof EC, Viana G, Lazarus AJ, Sullivan JD, McIntosh PS (1976). Coronal holes as sources of solar wind. Sol. Phys. 46:303-332.
Crossref
|
|
|
|
|
Ouattara F (2009). Contribution à l'étude des composantes du champ magnétique solaire et l'ionosphère équatoriale. Thèse de Doctorat d'Etat, Faculté des Sciences et technique, université Cheikh Anta Diop, Dakar, Sénégal, 348 p.
|
|
|
|
|
Ouattara F, Amory Mazaudier C (2009). Solar-geomagnetic activity and Aa indices toward a standard classification. J. Atmos. Solar-Terr. Phys. 71:1736-1748.
Crossref
|
|
|
|
|
Ouattara F, Amory-Mazaudier C, Fleury R, Lassudrie Duchesne P, Vila P, Petitdidier M (2009). West African equatorial ionospheric parameters climatology based on Ouagadougou ionosonde station data from June 1966 to February 1998. Ann. Geophys. 27:2503-2514.
Crossref
|
|
|
|
|
Ouattara F, Ali MN, Zougmoré F (2012). A comparative study of seasonal and quiet time foF2 diurnal variation at Dakar and Ouagadougou stations during solar minimum and maximum for solar cycles 21-22. Eur. Sci. J. pp. 1-14
|
|
|
|
|
Rishbeth H, Muller-Wodarg ICF, Zou L, Fuller-Rowell TJ, Millward GH, Moffett RJ, Idenden DW, Aylward AD (2000). Annual and semiannual variations in the ionospheric F2-layer: II. Physical discussion. Ann. Geophys. 18:945-956.
Crossref
|
|
|
|
|
Richardson IG, Cane HV (2002). Sources of geomagnetic activity during nearly three solar cycles (1972–2000). J. Geophys. Res. 107(A8):1187.
Crossref
|
|
|
|
|
Richardson IG, Cliver EW, Cane HV (2000). Sources of geomagnetic activity over the solar cycle: relative importance of coronal mass ejections, high-speed streams, and slow solar wind. J. Geophys. Res. 105(A8):18200-18213.
Crossref
|
|
|
|
|
Russell CT, McPherron RL (1973). Semiannual variation of geomagnetic activity. J. Geophys. Res. 78:92.
Crossref
|
|
|
|
|
Simon PA, Legrand JP (1989). Solar cycle and geomagnetic activity: A review for geophysicists. Part II. The solar sources of geomagnetic activity and their links with susnspot cycle activity. Ann. Geophys. 7(6):579-594.
|
|
|
|
|
Snyder CW, Neugebauer M, Rao UR (1963). The solar wind velocity and its correlation with cosmic ray variations and with solar and geomagnetic activity. J. Geophys. Res. 68:6361-6370.
Crossref
|
|
|
|
|
Svalgaard L (1977). Geomagnetic activity: dependence on solar wind parameters. In: Zirker JB (Ed.), Coronal Holes and High Speed Wind Streams. Colorado Associated University Press, Boulder P 371.
|
|
|
|
|
Tsurutani BT, Gonzalez WD, Gonzalez ALC, Tang F, Arballo JK, Okada M (1995). Interplanetary origin of geomagnetic activity in the declining phase of the solar cycle. J. Geophys. Res. 100:21.717-21.733.
|
|