ABSTRACT
Knowledge of distribution of ABO and Rh blood groups is helpful for effective management of blood banks and safe blood transfusion services. The prevalence of these blood groups varies worldwide and may not be found in equal numbers even among ethnic groups. The aim of this study was to find out the distribution of ABO and Rh (D) blood groups among students attending high schools in Bote town, Ethiopia from March–April 2017. Blood samples were taken from 392 (N = 775) volunteer students from finger-pricks and blood groups were determined on open slide by haemagglutination method using commercially available anti-sera A, B, and Rh (D). Descriptive statistics was used to calculate percentage frequencies of blood phenotype. The genotypic and allelic frequencies of the blood groups were calculated from the observed phenotypes under the assumption of Hardy–Weinberg equilibrium. In the ABO system, type O was the most prevalent (41.3%) followed by A (31.9%), B (21.4%) and AB the least (5.4%), in the pattern O > A > B > AB. Most of the students were found to be Rh+ (92.86%). Regarding the combined ABO/Rh blood groups, O+ was the most prevalent (38%), A+ (30%), B+ (20%) and AB+ (5%) and O- was also the most frequent (3%) among Rh-negative (Rh-) students. The allelic frequencies of O (r), A (p) and B (q), D and d were 0.64, 0.21, 0.15, 0.73 and 0.27, respectively. Genotypic frequency of IOIO was the most (0.413) frequent while that of IBIB was the least (0.021) while DD and dd were 53.3 and 7.3, respectively. The observed and expected frequencies of individuals having ABO and Rh blood were not significantly different in both blood systems (goodness-of-fit χ2 for ABO = 0.4729, df = 3 and χ2 for Rh = 0.0145, df = 1; P < 0.05). The present study gives vital information regarding the management of blood bank and transfusion services in the community.
Key words: Blood alleles, agglutination, blood bank, blood transfusion, prevalence, Rhesus factor.
Until the discovery of the ABO blood group over 100 years ago, all blood had been assumed to be the same, and the often tragic consequences of blood transfusions were not understood (Tekade et al., 2011). Blood groups are genetically determined and exhibit polymorphism in different populations. A total of 30 human blood group
systems are now recognized by the international society of blood transfusion of which the ABO and Rhesus (Rh) are the most important in clinical practice (Jaff, 2010; Tekade et al., 2011). ABO and Rh blood group antigens are hereditary characters and are useful in population genetic studies, researching population migration patterns, as well as resolving certain medicolegal issues, particularly of disputed paternity and are of great importance in blood transfusion and organ transplantation in that the donor blood type should match that of the recipient (Kassahun et al., 2015).
The differences in human blood are due to the presence or absence of certain protein molecules called antigens and antibodies. The antigens are located on the surface of the red blood cells (RBC) and the antibodies are in the blood plasma (Daniel and Clark, 2007).
The ABO blood group system is governed by a single gene located on chromosome 9 with three alleles (IA, IB and IO) (Zahid et al., 2016). The IA and IB alleles are co-dominant but both of them are dominant over the recessive allele IO in intra-allelic interaction in diploid condition (Murphy et al., 2003).The ABO system is determined by the presence of red blood cell antigens, an antigen A (group A), B antigen (group B), or both antigens (group AB), or neither of the antigens (group O), which classifies all human blood in one of four groups (phenotypes) A, B, AB, O (Zahid et al., 2016) with six genotypes, that is OO (type O), OA (type A), OB (type B), AA (type A), BB (type B), AB (type AB (Khalid et al., 2013).
Rhesus blood group system (Rh) is the second most important blood group system due to hemolytic disease of newborn. It is determined by a gene located on the short arm of chromosome 1 (Murphy et al., 2003) with two alleles (D and d). Individuals who have the D antigen on their red cells are known as Rhesus-positive (Rh+) (DD or Dd genotype) while those without antigen D (dd genotype) in their red blood cells are Rh- (Knowles and Poole, 2002). Antibodies to D can cause transfusion reactions. Unlike ABO blood group spontaneous antibodies are never formed against Rh antigens and repeated exposure is needed to make significant amount of antibodies to cause a transfusion reaction (Guyton and Hall, 2006). If an Rh- person receives an Rh+ transfusion, the recipient produces anti-D. A related condition sometimes occurs when an Rh- woman carries an Rh+ fetus. The first pregnancy is likely to be uneventful because the placenta normally prevents maternal and fetal blood from mixing. However, at the time of birth, or if a miscarriage occurs, placental tearing exposes the mother to Rh+ fetal blood. She then begins to produce anti-D antibodies. If she becomes pregnant again with an Rh+ fetus, her anti-D antibodies may pass through the placenta and agglutinate the fetal erythrocytes. Agglutinated RBCs hemolyze, and the baby is born with a severe anemia called hemolytic disease of the new born (HDN) or Erythrblastosis fetalis (Saladin, 2003).
The frequency of the ABO and Rh blood groups vary worldwide and may not be found in equal numbers in various populations. Among African-Americans the distribution of ABO blood group, type O, 46%; type A, 27%; type B, 20%; and type AB, 7%. Among Caucasians in the United States, the distribution of type O is 47%; type A, 41%; type B, 9%; and type AB 3%. Among Western Europeans type O, 46%; type A, 42%; type B, 9%; and type AB, 3% (Pramanik, 2000). In African American, Rhesus (D) negative is approximately 7% and Rhesus (D) positive is 93%. In other Europeans, Rhesus (D) negative is about 16% and Rhesus (D) positive is 84%. In African descent, Rhesus (D) negative is less than 1% and Rhesus (D) positive is over 99% (Bamidele et al., 2013).
The success of human blood transfusion requires compatibility for the two major blood group antigen systems and on the ability of agglutinins of both blood groups to cause haemolytic transfusion reaction and haemolytic disease of the foetus and newborn (Knowles and Poole, 2002; Murphy et al., 2003). Blood transfusion is a life-saving procedure but can cause acute and delayed complications. Complications of blood transfusions with wrongly labeled blood groups may be mild or can be life-threatening.
The type and stock levels of blood and blood products available in the hospital blood bank in any community should ideally closely correlate with the distribution of the clinically significant red cell antigens in the general population (Erhabor et al., 2010). The knowledge of the distribution of ABO and Rh (D) blood groups is essential for the effective management of a Blood Bank's inventory, whether it is in a smaller local transfusion centre or a regional or national blood transfusion service. Blood Transfusion Service (BTS) is an integral part of modern health care system without which efficient medical care is impossible. The main aim of a BTS is to provide effective blood and blood products, which should be as safe as possible, and adequate to meet patient's need (Kotwal et al., 2014).
Although the prevalence of the ABO and Rhesus blood has been reported in few parts of Ethiopia, none has been carried out in Bote town. Therefore, the aim of this study was to determine the distribution of ABO and Rh (D) blood group alleles, genotypes and phenotypes among students attending secondary and Preparatory schools in Bote town, Oromia National Regional State, Ethiopia.
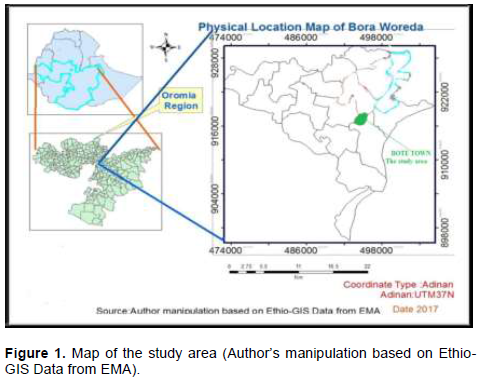
Study area
The study was carried out in Bote town in Bora district which is found in East Shoa Zone Oromia National Regional State (Figure 1). Bote town is located at 110 km South of Addis Ababa. It is found at 8°8'N, 38°57'E and an altitude of 1,611 meters above sea level.
The town has a total population of 28,469 (14,594 males and 13,875 females) with the ethnic composition of Oromo (55.1%), Amhara (24.2%), Gurague (18.3%), Tigrie (1.1%), and Hadiya and Walayta (1.3%) (Source: Central Statistical Authority, 2007).
Study population and sampling techniques
The study populations were all students of secondary and preparatory schools found in Bote town. The schools were Bora Secondary School with 540 students, Bote Preparatory School with 165 and Professor Badege Academy (Secondary School) with 70 students and the total population size in these schools was 775 students.
Discussion was made with all the students of the schools concerning the purpose of the study and the importance of knowing one’s own blood group in the aspects of nutrition, health, blood transfusion and blood donation. After the discussion, they were asked to give sample blood voluntarily and 392 (more than 50% students from each school) gave the sample. The participants consisted of 204 (52%) males and 188 (48%) females. The blood sample collection and analysis were conducted from March - April, 2017 in the biology laboratories of Bote Secondary School and Bote preparatory school.
Blood sample collection and blood groups determination
The blood samples were collected from finger pricks by professional laboratory technicians from the District Health Center. The samples were then tested for ABO and Rhesus factor blood groups by using Anti-A, Anti-B, Anti-D on open glass slide method following Bhasin and Chahal (1996).
Commercially available standard anti-sera A, anti-sera B and anti-sera D were used for the study. Blood grouping was done by commercial reagent kit supplied by SPINREACT, S.A.U.-Ctra. Santa Coloma, 7E-17176 SANT ESTEVE DE BAS-(Gerona) Spain and obtained from Adama blood bank service. Blood was treated with anti-A, anti-B and anti-D anti-sera on separate glass slides, marked as A, B and D and were mixed with separate sterilized applicator sticks. The mixture was observed for agglutination. The blood group was determined based on agglutination with the corresponding anti-sera. If agglutination was present in the blood drop A, then it belongs to A blood group, agglutination in blood drop B, B group, agglutination in both A and B blood drops, AB group and if no agglutination in both A and B drops, then O group. Similarly, agglutination in blood drop D was considered as Rh+ and no agglutination Rh- (Avent and Reid, 2009). Therefore, the results were recorded as A+, B+, AB+, O+ and A-, B-, AB- and O-.
Statistical analysis
Descriptive statistics was used to calculate frequencies of the phenotype of the blood ABO and Rh blood groups and results were reported as frequencies and percentages.
The genotypic and allelic frequencies of the ABO and Rh blood groups were calculated from the observed phenotypes of ABO and Rh under the assumption of Hardy–Weinberg equilibrium. The three alleles of ABO blood groups, i.e., IA, IB, and IO, and their frequencies were represented by p, q, and r, respectively. The frequencies were calculated as follows:
r = √O = Allele IO
p = 1 - √B + O = Allele IA
q = 1 - √A + O = Allele IB
Therefore, the genotypic frequencies are represented as:
(p + q + r) 2 = p2 + 2pq + q2 + 2pr + 2qr + r2 = 1 and p + q + r = 1
Where, p2 is the genotypic frequency of IAIA, q2 is the genotypic frequency of IBIB, 2pq is the genotypic frequency of IAIB, 2pr is the genotypic frequency of IAIO, 2qr is the genotypic frequency of IBIO and r2 is the genotypic frequency of IOIO as cited in Hanania et al. (2007).
The frequencies of the Rh blood group allele D (dominant allele) and d (recessive allele) were determined as:
q = √Rh- = Allele d
P = 1 – q = Allele D
The Rh blood (D) group genotypic frequency was calculated from the allelic frequency under the assumption of Hardy-Weinberg equilibrium as follows:
DD + 2Dd + dd = 1
Genotype DD = p2
Genotype Dd = 2pq
Genotype dd = q2
Chi-square (χ2) test (P < 0.05) was used to check whether the observed and expected frequency distributions of the ABO blood groups and Rh factor were in the Hardy Weinberg equilibrium or not.
χ2 =Σ (Of - Ef)2 / Ef
Where, Of = Observed frequency; Ef = Expected frequency
Expected phenotypic frequencies for each blood group were calculated as:
1) A blood group Ef = frequency of (AA + AO) X number of total sample,
2) B blood group Ef = frequency of (BB + BO) X number of total sample,
3) AB blood group Ef = frequency of AB X number of total sample ,
4) O blood group Ef = frequency of OO X number of total sample,
Ethical consideration
Ethical clearance was obtained from the Health Bureau of Oromia National Regional State. Before data collection, an informed consent was obtained from the students and collected data were kept confidential.
Distribution of ABO and Rh blood groups
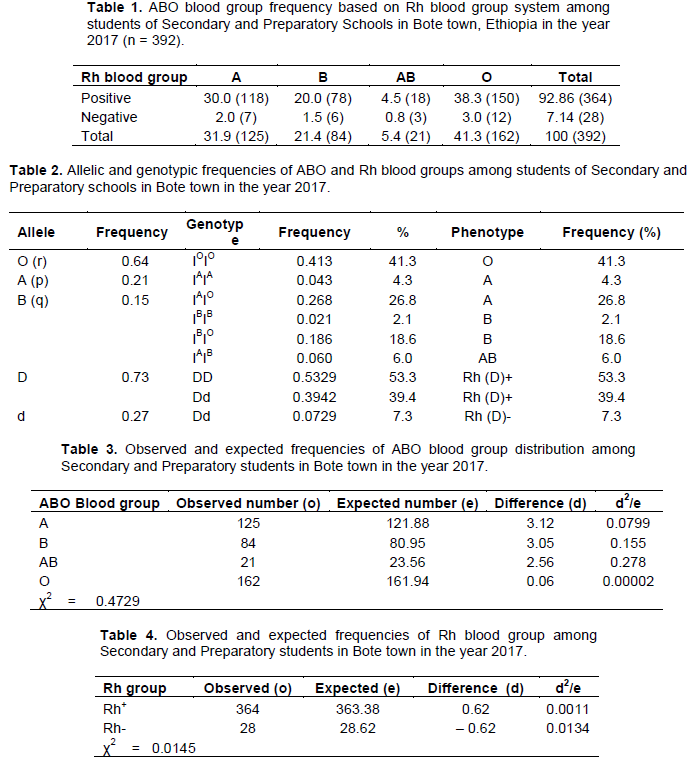
The phenotypic frequency distribution of ABO of blood groups based on Rh blood group is shown in Table 1. In the ABO blood group system, type O was the most prevalent (41.32%), followed by type A (30.1%), type B (21.4%) and type AB was the least frequent (5.4%) in the order O > A > B > AB. Regarding Rh factor, most of the participants were found to be Rh+ (92.86) of which O+ was the most (38.3%) and AB+ was the least (0.8%) prevalent.
Allelic frequencies of ABO and Rh (D) blood groups
Results of allelic and genotypic frequencies of ABO and Rh blood groups are depicted in Table 2. The allelic frequencies of the ABO blood group of r (IO), p (IB) and q (IA) were 0.64, 0.21 and 0.15, respectively (IO > IA > IB) while allelic frequencies of the Rh blood group of D and d were 0.73 and 0.27, respectively. Genotypic frequency of IOIO was the most (0.413) frequent while that of IBIB was the least (0.021) frequent.
Observed and expected frequencies of ABO blood group and Rh factor
Tables 3 and 4 represent comparison between observed and expected frequencies of the ABO blood group and Rh factor, respectively. The observed and expected frequencies of individuals having ABO and Rh blood were not significantly different in both blood systems (goodness-of-fit x2 for ABO = 0.4729, df = 3 and for Rh = 0.0145, df = 1; P < 0.05).
Distribution of ABO and Rh blood groups
The study of blood groups is fundamental in the clinical practice due to the inherent relationship in transfusion medicine and organ transplants (Roback et al., 2011). In blood banks it is challenging to get enough blood units, especially for the less frequent blood types. Thus, it is necessary to implement effective programs among health institutions to get specific blood types and products according to their geographic distribution. To meet this need it is important to know the distribution of ABO and Rh (D) blood groups in several areas of a country (Canizalez-Román et al., 2018).
The frequencies of ABO and Rh blood groups vary worldwide and are not found in equal numbers even among ethnic groups of the same country. Many studies have shown that blood group O is the most common while AB is the least common in different ethnic groups (Nwauche and Ejele, 2004). The result of the current study revealed that the frequencies of the blood group distribution was in the order O > A > B > AB. Accordingly, type O was the highest (41.32%), A (31.9%), B (21.4%) and AB (5.4%). With regard to Rh factor, most (92.86%) of the participants were Rh+ while only 7.14% were Rh- which is in agreement with most studies conducted in different parts of the world, including Ethiopia, though the figures may vary significantly. In Silte zone, Ethiopia, Kassahun et al. (2015) reported the prevalence of O (41.0%), A (24.5%), B (21.3%) and AB (5.2%) and 92.06% Rh+ and 7.94% Rh-. Among Sidama ethnic group (Ethiopia) the distribution of ABO blood group of type O (51.3%), type A (23.5%), type B (21.9%) and type AB (3.3%) (Tewodros et al., 2011). Similarly, (Teklu and Shiferaw, 2016) reported the prevalence of O (43.0%), A (32.0%), B (21.5%) and AB (3.5%). Fekadu (2015) reported the general Ethiopians ABO blood group distribution of type O, 40%, type A (31%), type B (23%) and type AB (6%). The relative frequencies of ABO and Rhesus blood groups in the current study, did not deviate from the typical pattern of O > A > B > AB in the country.
In African-American the distribution of type O is 46%, type A (27%), type B (20%) and type AB (7%). In Caucasians in the United State, the distribution of type O is 47, type A (41%), type B (9%) and type AB is (3%). Also, among Western Europeans, type O is 46%, type A (42%), type B (9%) and type AB is 3% Adeyemo and Soboyejo, 2006). In a study done on in Nepalese medical students, Upadhyay-Dhungel et al. (2013) found type O (34.87%), type O (30.17%), type A (28.17%) and type AB (6.79%) and Rh+ (95.38%). Canizalez-Román et al. (2018) reported a very high prevalence of type O (61.82%), type A (27.43%), type B (8.93), and type AB (1.81%) and 95.58% Rh+ in the Mexican population.
Although, blood group O is the most common phenotype in most populations in different parts of the world, blood type B or type A are rarely the most prevalent. In a study carried out in Bannu region in Pakistan, Khan et al. (2009) reported the prevalence pattern of B > A > O > AB. In Swat district in Pakistan, Khattak et al. (2008) reported the percentage frequencies of B (32.40%), O (29.10%), A (27.92%) and AB (10.58%) (B > O >A > AB). The findings of Khalid et al. (2013) in Pakistan show that the frequency of O (27.93%), A (24.75%), B (27.97%) and with a relatively higher percentage of AB (19.36%) compared to most studies worldwide. Khalid et al. (2013) reported that in Bangladesh and India most studies have shown the typical Asian pattern of B > O > A > AB distribution. From Saudi Arabia Sarhan et al. (2009)reported that blood group O (56.8%) to be more common than A (33.4%), B (6.0%) and AB (3.4%) blood groups. Majority of Asians have a typical B > O > A > AB pattern while most Africans, Americans, Australians and English exhibit an O > A >B > AB pattern of ABO phenotypes. Some European nations on the other hand show an A > O > B > AB pattern Khalid et al. (2013) and the general Indian subcontinent has the pattern, B ≥ O > A > AB Khan et al. (2009).
The findings of Khan et al. (2009) also show that blood group B (36.6%) was the most prevalent followed by O (35.5%, A (21.4%) and AB (7.0%) which showed the same trend of prevalence as in the general Indian subcontinent (B ≥ O > A > AB).
The higher distribution of blood type O recorded in this study has advantage to the region as Bote town is located in the Central Rift Valley of Ethiopia where malaria is prevalent. Lemu et al. (2017) reported that there is a hypothesis that the frequency of group ‘O’ is higher than non-‘O’ phenotypes in malaria endemic areas. It appears that the natives with blood type ‘O’ better survived severe malaria. On the other hand, both Rh-negative and ‘O’ phenotypes might have encouraged malaria transmission in the area as asymptomatic carriers prevailed probably because of their resistance to malarial disease showing the beneficial effects of the phenotypes. Thus, dominance of O group could be protective against malaria because studies have shown that the erythrocytes of an individual with blood type O might not be suitable for rosette formation by Plasmodium falciparum. Besides, the higher prevalence of type ‘O’ blood has its advantage which may include emergency blood transfusion as blood group O is a universal donor (lack both A and B antigen) hence it is readily available. This can also be seen as good input for blood bank services for effective management of blood and safe blood transfusion services (Lemu et al., 2017).
The frequency of the Rh-negative phenotype differs significantly between populations. In Africa and Asia the Rh-negative phenotype is less common. For example, there are reports of a 6% rate of Rh-negatives in Nigeria and only 1% in Madagascar. In various regions of India Rh negativity was found to be 0.6–8.4%. In South East Asia and Far East the D-negative phenotype is even rarer. In China, Indonesia, and Japan less than 1% of the population is Rh- Lemu et al. (2017). On the other hand, Western nations like Britain (Garratty et al, 2004) and United States have Rh factor negativity of 17 and 15%, respectively. A study conducted in Saudi Arabia revealed that 29% of the population was Rh- (Eweidah et al., 2011). Rh- frequencies of about 29% were documented among Basques and in distinct populations living in the High Atlas Range of Morocco (Weinstock, 2014). In the general Indian subcontinent, Khan et al. (2009) reported the frequency of Rh+ (89.5%) and Rh- (10.5%).
The results of this study revealed that the frequency of Rh- was very low (7.14%) and the scenario may imply the shortage and difficulty of getting it when required from blood banks and to meet patient's need. In line with this, Lemu et al. (2017) reported that Rh- blood group is rare in many populations which implies that it is scarcely available in blood banks and thus populations in which Rh-negative group is more common may be approached, individuals are encouraged and convinced to donate blood to make this blood group more available in blood banks.
The prevalence of the Rh factor in the current study is consistent with previous studies conducted in different parts of Ethiopia. For instance, among blood donors in Jimma city, 93% were Rh+ and 7% Rh- (Teklu and Shiferaw, 2016) and Kassahun et al. (2015) noted 92.06% Rh+ and 7.94% Rh-negative in Silti zone.
Allelic frequencies of ABO and Rh (D) blood groups
In the current study, the allelic frequencies of O (0.64), A (0.21) and B (0.15); D (0.73), and d (0.27), and Rh factor were very close to the findings of Kassahun et al. (2015) in a similar study conducted in Silte zone, Ethiopia. In their study, the allelic frequencies of O (r), A (p) and B (q), D, and d were 0.65, 0.19 and 0.15, 0.72 and 0.28, respectively. They also found that 92.06% were Rh+ while 7.94% were Rh-. The pattern of allelic frequencies IO > IA > IB was consistent with the results of previous studies conducted in Oromia National Regional State. For instance, in the Arsi clan frequency of IA is 0.19, IB 0.16, and IO 0.65 while in Guji clan IA is 0.21, IB 0.16, and IO 0.63 and in Borena clan IA 0.22, IB 0.15, and IO 0.63 [33]. Of the six different genotypes, IOIO was the most (41.3%) frequent. The predominance of IO allele may be due to the fact that blood groups A and B (IAIO and IBIO) carry O allele in their heterozygous state, in addition to the homozygous IOIO. In the general Indian subcontinent, (Yassin, 2013) reported allelic frequencies of p (0.154), q (0.249), r (0.591), D (0.676) and d (0.324) and these allelic frequencies show variation from those of the current study in which O (r) was 0.64, A (p), 0.21, B (q), 0.15, D was 0.73 and d was 0.27. Allele D is dominant over allele d.
The calculated Chi-Square value for ABO blood group was 0.4078 which has the P value is between 0.95 and 0.90 with 3 degrees of freedom (P > 95%). The results indicated that there was no significant difference between observed and expected values in the distribution of ABO blood groups. Regarding the Rh blood group, there was also no significant difference between observed and expected values (Goodness of fit X2 = 0.0119, df = 1, P > 95%).
In the current study the pattern of distribution of the ABO blood groups was O > A > B > AB and most (92.86%) of the participants were Rh+, O+ also being the most frequent (38.3%). The frequency of Rh- blood group among the study population was very low which indicates the scarcity of people with the blood type and difficulty of getting it when it is needed. Therefore, the outcome of this study could be used as baseline information for the effective management of a Blood Bank inventory in the area.
The authors have not declared any conflict of interests.
The authors thank Bora Secondary School, Professor Badege Academy and Bote Preparatory School management for their cooperation in conducting the study in their respective school. The student participants are thanked for giving blood samples voluntarily. Mr. Biniam Kefyalewu and Mr. Mewuded Desta are thanked for their professional expertise in blood collection and assistance in conducting the blood test. Special thanks also go to Oromia National Regional State Education Bureau and Adama Science and Technology University for funding the study and Adama Blood Bank Service for providing anti-sera used for blood typing.
REFERENCES
|
Adeyemo OA, Soboyejo OB (2006). Frequency distribution of ABO, Rh blood groups and blood genotypes among the cell biology and genetics students of University of Lagos, Nigeria. African Journal of Biotechnology 5(22):2062-2065.
|
|
|
|
Avent ND, Reid ME (2000).The Rh blood group system: a review". Blood 95(2):375-87.
|
|
|
|
|
Bamidele O, Arokoyo DS, Akinbola AO (2013). Distribution of ABO and rhesus blood groups among medical students in Bowen University, Iwo, Nigeria. Annals of Biological Research 4(11):1-6.
View
|
|
|
|
|
Bhasin MK, Chahal SM (1996). Immunology a short course.3rd ed. Wiley`s liss New York. P 484
|
|
|
|
|
Canizalez-Román A, Campos-Romero A, Castro-Sánchez JA, López-Martínez MA, Andrade-Mu-oz FJ (2018). Blood Groups Distribution and Gene Diversity of the ABO and Rh (D) Loci in the Mexican Population. BioMed Research International.
Crossref
|
|
|
|
|
Daniel HL, Clark AG (2007). Principle of population genetics. 4th ed. Sinaur. Associates. Sunderland, Massachusetts P 633.
|
|
|
|
|
Erhabor O, Adias TC, Jeremiah ZA, Hart ML (2010). Abnormal hemoglobin variants, ABO, and Rhesus blood group distribution among students in the Niger Delta of Nigeria. Pathology and Laboratory Medicine International 2:6-12.
|
|
|
|
|
Eweidah MH, Rahiman S, Ali MH, Al-Shamary AMD (2011). Distribution of ABO and Rhesus (RHD) blood groups in Al-Jouf Province of the Saudi Arabia. Anthropologist 13(2):99-102
Crossref
|
|
|
|
|
Fekadu AA (2015). Distribution of ABO and Rh Blood Groups among Students of Some Ethnic Groups at Dilla University, Ethiopia. International Journal of Genetics and Genomics 3(1):8-19.
Crossref
|
|
|
|
|
Garratty G, Glynn SA, McEntire R (2004). ABO and Rh(D) phenotype frequencies of different racial/ethnic groups in the United States. Transfus 44:703-706.
Crossref
|
|
|
|
|
Guyton AC, Hall JE (2006). Textbook of medical physiology. 11th. WB Sounders Company, Philadelphia.
|
|
|
|
|
Hanania S, Hassawi D, Irshaid N (2007). Allele frequency and molecular genotypes of ABO blood group system in a Jordanian population. Journal of Medical Science 7:51-58.
Crossref
|
|
|
|
|
Jaff MS (2010). ABO and rhesus blood group distribution, in Kurds. Journal of Blood Medicine 1:143-146.
Crossref
|
|
|
|
|
Kassahun T, Yohannes P, Mebeaselassie A (2015). Frequency distribution of ABO and Rh blood group alleles in Silte Zone, Ethiopia, Egyptian Journal of Medical Human Genetics 16(1):71-76
Crossref
|
|
|
|
|
Khalid M, Aslam N, Aslam M, Ahmad R (2013). Distribution of ABO and Rh (D) blood groups among blood donors in district Mardan, Pakistan. Journal of Saidu Medical College 3(2):318-322.
|
|
|
|
|
Khan MS, Bakhshi A, Akhtar MS, Amin-ud-Din M (2009). Distribution of ABO and Rh D blood groups in the population of Poonch District, Azad Jammu and Kashmir. Eastern Mediterranean Health Journal 15(3):717-721.
Crossref
|
|
|
|
|
Khattak ID, Khan TM, Syed P, Shah AM, Ali A (2008). Frequency of ABO and rhesus blood groups in district Swat, Pakistan. J. Ayub Med Coll Abbottabad 20(4):127-129.
|
|
|
|
|
Knowles S, Poole G (2002). Human blood group systems. In: Murphy MF, Pamphilon DH, editors. Practical Transfusion Medicine. 1st ed. London, UK: Blackwell Science pp. 24-31.
|
|
|
|
|
Kotwal U, Raina TR, Sidhu M, Dogra M (2014). Distribution of ABO & Rh (D) Blood Groups Among Blood Donors of Jammu Region with Respect to Various Ethnic Groups. Journal Medical Thesis 2(1):31-14.
|
|
|
|
|
Lemu G, Arega T, Berhanu E, Hassen M (2017). High rhesus (Rh(D)) negative frequency and ethnic‑group based ABO blood group distribution in Ethiopia. BMC research notes 10(1):330.
Crossref
|
|
|
|
|
Murphy WJ, Fronicke L, O'Brien SJ, Stanyon R (2003). The Origin of Human Chromosome 1 and Its Homologs in Placental Mammals". Genome Research 13(8):1880-1888.
Crossref
|
|
|
|
|
Nwauche CA, Ejele OA (2004). ABO and rhesus antigens in a cosmopolitan Nigeria population. Nigerian Journal of Medicine 13(3):263-266.
|
|
|
|
|
Pramanik T (2000). Distribution of ABO and Rh blood groups in Nepalese students: A report Eastern Mediterranean Health Journal 6(1):156-158.
|
|
|
|
|
Roback JD, Grossman BJ, Harris T, Hillyer CD (2011). American Association of Blood Banks: Technical Manual, American Association of Blood Banks.
|
|
|
|
|
Saladin K (2003).Anatomy and Physiology: The unity of Form and Function, 3rd edition. The McGraw- Hill Companies, USA pp. 679-698.
|
|
|
|
|
Sarhan MA, Saleh KA, Bin-Dajem SM (2009). Distribution of ABO blood groups and Rhesus factor in Southwest Saudi Arabia. Saudi Medicine Journal 30(1):116-119.
|
|
|
|
|
Tekade R, Warghat N, Sharma N, Wankhade A, Baig M (2011). Gene Diversity among some endogamous population of Amravati District. Journal of Biotechnology 2(5):558-567.
|
|
|
|
|
Teklu Z, Shiferaw B (2016). Pattern of ABO and Rhesus Blood Groups Distribution of Five Years Survey in Jimma Town Blood Bank, South West Ethiopia Journal of Health Education Research and Development ISSN: pp. 2380-5439.
|
|
|
|
|
Tewodros Z, Abraham D, Berhanu E (2011). Association of ABO blood group and Plasmodium falciparum malaria in Dore Bafeno Area, Southern Ethiopia. Asian Pacific Journal of Tropical Biomedicine 1(4):289-294.
Crossref
|
|
|
|
|
Upadhyay-Dhungel K, Banskota GN, Das PK, Sohal A (2013). Distribution of ABO and Rh blood groups in Nepalese medical students. Janaki Medical College Journal of Medical Sciences 1(2):17-20.
Crossref
|
|
|
|
|
Weinstock C (2014). It is worthwhile filling in the remaining blank spots for blood group antigen frequencies. Blood Transfus 12:3-6.
|
|
|
|
|
Yassin W (2013). Frequency of ABO and Rhesus (RhD) blood group alleles among students of Oromo ethnic group belonging to Arsi, Guji, and Borena clans in Robe college of teachers education, Ethiopia A Thesis Submitted to the School of Graduate Studies, Haramaya university in partial fulfillment of the requirements for The Degree of Master of Science in Genetics.
|
|
|
|
|
Zahid H, Yahyaoui A, Uwingabiye J, El Khazraji A, El Hadef R, Messaoudi N (2016). Phenotypic and allelic distribution of ABO and Rh-D blood Groups in Blood Transfusion Center of Avicenna Military Hospital, Marrakech, Morocco. International Journal of Medicine and Health Research 2(1):1-9.
|
|
|
|