ABSTRACT
Sweet potato (Ipomoea batatas [L.] Lam) is an important root crop in Malawi and Sub-Saharan Africa where micronutrient deficiency is an eminent health problem. Using 15 sweet potato genotypes grown in a randomized complete block design at Bvumbwe Research Station, a study was undertaken to determine the extent of variability of selected micronutrients in the genotypes as influenced by storage root age and peeling. Analysis of variance (ANOVA) showed significant (p≤ 0.01) variability among genotypes for dry mater, β-carotene, ascorbic acid levels and reduction of β-carotene due to peeling across all ages. Significant (p ≤ 0.05) variations in zinc, iron and copper were also observed among all genotypes. Peeling reduced β-carotene, ascorbic acid levels, iron, zinc and copper content while late harvesting resulted in low iron, zinc and copper. Therefore, 5 months after planting (MAP) and 4 MAP are recommended for high levels of β-carotene and ascorbic acid and iron, zinc and copper, respectively. Ten genotypes exhibited acceptable levels of dry mater of ≥30%. Zondeni (10.9 mg/100 g, WW) and Babache (23.84 mg/100 g, WW) had highest levels of β-carotene and ascorbic acid, respectively. Mzungu displayed the highest levels of Iron (0.67 mg/100 g, DW) and zinc (0.63 mg/100 g, DW) while Yoyera (0.61 mg/100 g, DW) had the highest levels of copper. Variations of various traits entail potential to breed for higher levels of micronutrients.
Key words: Sweet potato, genotypes, β-carotene, ascorbic acid, iron, zinc, copper, peeling, storage root age.
Approximately one billion (795 million) people from developing countries suffer from hunger, malnutrition and poverty (FAO, 2015). Various reasons including climate change, environmental degradation, dwindling of natural resources and an ever increasing population have been implicated. In 2015, global population was estimated at 7.3 billion and was expected to climb up to about 9.7 billion in 2050 when nearly 90% of the population will be in resource poor developing countries of Asia, Africa and Latin America (James, 2015). The UN population projection shows that the trend will continue until the end of this century when the global population will reach 10.8 billion or more (UN DESA, 2015). Such increases in global population will result in ever increasing number of food in-secure people, who by definition are people with no physical and economic access to enough safe and nutritious food which meets their dietary needs at all times (FAO, 1996).
However, over 3 billion people suffer from a different, sneakier form of hunger than the simple lack of sufficient quantities of foodstuffs referred to as micronutrient malnutrition or “hidden hunger” which is caused by a lack of food of sufficient dietary quality (Kennedy et al., 2003; FAO, 2013). Monotonous diets which are a hallmark of Sub-Saharan countries, based on cereals and other starchy staple foods frequently fail to deliver sufficient quantities of essential minerals and vitamins like Iodine, Iron, Zinc and Vitamin A (Demment et al., 2003). Such diets predisposed communities to micronutrient deficiencies resulting in micronutrient malnutrition (FAO/WHO, 2002). Generally, such deficiencies result in increased chances of infectious and non-infectious disorders which include impaired vision, measles, diarrhoea, pneumonia and malaria (World Health Report, 2004). Young children, pregnant and lactating women are particularly at risk because they have a higher need for minerals and vitamins (Nabakwe and Ngare, 2004). In order to address the prevalent micronutrient deficiencies directly, the conventional approach is supplementation, food fortification, dietary diversification and nutrition education (Laurie and Faber, 2008). Food based approaches to nutrition improvement are well documented worldwide (Musinguzi et al., 2006; Nawiri et al., 2012) and in such methods, choice of candidate crops is critical. Sweet potato is a logical choice for such interventions as the crop is nutrient rich and widely cultivated ranking second after cassava in area and production in the tropical and sub-tropical regions (FAOSTAT, 2012; Boney et al., 2014). In the Sub-Saharan Africa (SSA), the crop is farmed on more than 3 million hectares with estimated yield of 13 million tons annually (Low and Van Jaarsveld, 2008).
In Malawi, sweet potato is the second most widely grown root crop after cassava. Since the crop is highly tolerant to drought and poor soil conditions, frequent droughts in Malawi have led to increased sweet potato cultivation as evidenced by production increase of 370% from 1995 to 2006 (FEWS/MoAFS, 1995, 2006).
There is an emergent recognition of sweet potato as a cheap produce for combating food insecurity and micronutrient malnutrition worldwide (Yamakawa and Yashimoto, 2002; Hotz et al., 2012; Girard et al., 2017) because sweet potato is a renowned important source of carbohydrates, vitamins (A, C, D and E), fiber, iron, potassium, zinc, copper and protein (Woolfe, 1992; Low et al., 2009; Sreekanth et al., 2010; Hotz et al., 2012). However, variability of micronutrients with genotypes of sweet potato has been reported widely (Woolfe, 1992; Abubakar et al., 2010; Meludu, 2010; Sunette, 2010), therefore there is need to ascertain the levels of various micronutrients in different genotypes grown by farmers in Malawi. Hence the study was conducted to identify mineral and vitamin rich sweet potato genotypes and quantify variations of different nutrients in different genotypes in order to recommend right genotypes which can assist in addressing different micronutrient deficiencies (iron, zinc, copper, vitamins A and C) in Malawi.
Study genotypes
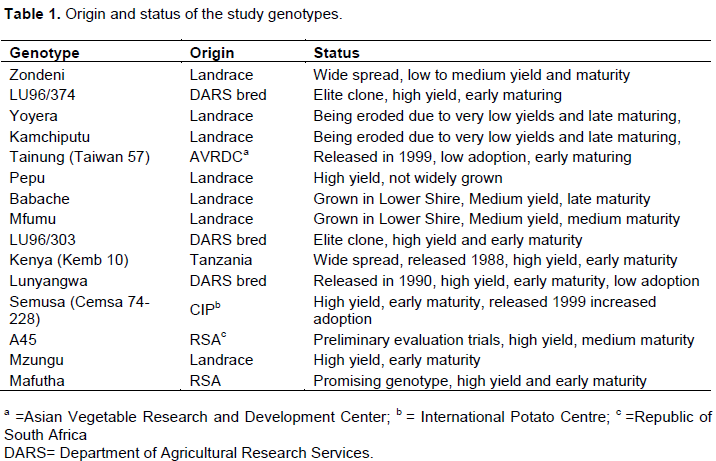
The study used fifteen sweet potato genotypes from different sources (Table 1) comprising four released genotypes, two local bred elite clones, two elite introductions and seven landraces. The sweet potato genotypes were chosen on the basis of their status (Table 1) and were maintained at Bvumbwe Agricultural Research Station for one season following standard procedures that included randomized complete block design (RCBD) experimental plots replicated thrice. A gross plot consisted of two ridges (4.8 m long) spaced at 90 × 90 cm apart and planting stations of 30 × 30 cm apart. The sweet potato cuttings were planted at 30 cm apart within ridges. The seven landraces represented low to high yielding, early to late maturing, good to bad taste, texture, varying flesh colour, flavour and susceptibility and resistance to weevil attack as described by farmers using their knowledge (Indigenous Knowledge Systems). Released genotypes, locally bred clones and introductions represented breeders’ selections. Sampling for analysis started at four months after planting (MAP) and continued in the fifth and seventh MAP. Generation of soil analysis, dry matter and micronutrients data was done in the Bvumbwe Agricultural Research Station laboratories.
Bvumbwe Agricultural Research Station field soil analysis
Top and sub soil samples (30 cm deep) from the experimental plots were collected and analyzed for pH, zinc, iron and copper following standard protocols as prescribed by the Association of Official Analytical Chemistry (AOAC, 2000) in order to compare the mineral results in the genotypes with respect to those of the top and sub soils on the planting day.
Determination of dry matter content
Dry matter content was measured by random sampling of five storage roots of a genotype from each plot and chopped into 2 cm thick strips. Two hundred grams of the chopped samples in three replicates were oven-dried at 105°C until weight remained constant (Carey and Reynoso, 1999; AOAC, 2000). Percentage dry matter was calculated as:
Preparation of samples for nutrient analysis
Mature storage roots from six randomly selected plants of a genotype were harvested at 4, 5 and 7 MAP with each sample split into two batches. One batch was washed, chopped into 1-cm cubes, mixed, packed in well-sealed plastic bags and stored at -20°C until extraction time. The second batch was peeled (by removing the epidermis and cortex) and preserved like batch one. Analysis of nutrients was undertaken within 2 months of harvesting.
Determination of b-carotene
Preparation of b-carotene standard stock and working solutions (1.7695 × 10⁻³M)
b-carotene (0.100 g, 95%) was dissolved in petroleum ether and diluted to the mark in a volumetric flask (100 ml). Aliquots of this stock solution (0.1, 0.2, 0.3, 0.4 and 0.5 ml) were pipetted into a set of 50-ml amber volumetric flasks and diluted to give a set of standard solutions with absorbance readings between 0 and 1.0. The absorbances of the standard solutions were determined at 450 nm in a spectrophotometer.
b-carotene extraction and determination
Beta-carotene content was determined spectrophotometrically as described by Imungi and Wabule (1990). Fresh peeled and unpeeled samples were initially homogenized using a blender. Exact portions (2.00 g) in duplicates were weighed in a 50-ml extraction conical centrifuge tube and mixed with cold acetone (40 ml). The samples were centrifuged for 60 s before filtering with suction through a Buchner funnel. The flask and residues were washed with acetone while receiving the washing in the funnel. The filtered residues were white in colour which indicated that all b-carotene had been extracted. Petroleum ether (40 ml) was put in a separator funnel. The resultant acetone extract was then added into the separator funnel. Distilled water was slowly added while letting it flow along the walls of the funnel. The mixture was not shaken to avoid formation of an emulsion. The two phases were allowed to separate and the lower aqueous acetone phase was discarded. The resultant was washed first with distilled water (300 ml) and three times with distilled water (200 ml) to remove the acetone completely. The petroleum ether phase was collected in a 50-ml volumetric flask. The ethereal extract was made to pass through the funnel containing filter paper and anhydrous sodium sulphate. The washing solvent was also collected into the volumetric flask and the volume was made to the mark. The absorbance of the b-carotene ethereal extract was read at 450 nm in a UV/VIS spectrophotometer. b-carotene content was calculated using the following formula:
mg/g = (A × Volume × 104) / (2592 × Sample weight) (2)
where A= Absorbance.
Extraction and determination of ascorbic acid
A 5 g of sample was homogenised in a solvent system (100 ml) for two minutes at medium speed, and allowed to stand for 30 min in a refrigerator for the supernatant to settle before determination. Ascorbic acid was determined according to AOAC (2000). The 2,6 dichlorophenolindophenol titrimetric (0.250 g) method described in AOAC was used for determination of the acid. The dye was standardized by titrating it against ascorbic acid standard (2.0 ml) in solvent system (5.0 ml) before determination. The supernatant (10.0 ml) was transferred in a well-rinsed and dried conical flask, titrated in triplicate against 2,6 -dichlorophenolindophenol until end point (pink coloration). Blank determinations were done to correct sample and standard titre values. Ascorbic acid concentration (mg/100 g) was calculated using the equation:
Concentration of ascorbic acid (mg/100 g) = (X- B) × (F/E) × (V/Y) × 100 (3)
Where X= average ml for sample titration, B = average ml for sample blank titration, F = mg ascorbic acid equivalent to 1.0 ml indophenol standard solution, E = number of grams, V = initial volume of assay solution and Y = volume of sample aliquot titrated.
Extraction and determination of metals (Zn, Fe and Cu)
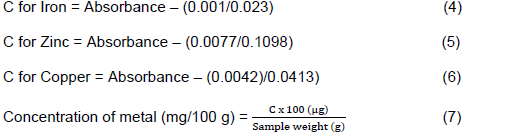
Extraction of Zn, Fe and Cu was done as described in AOAC (2000). Sweet potato chips (1.00 g) were dried in an oven (110°C) for 12 h and the dried material was ashed in a furnace for 5 h at 500°C. The samples were cooled to room temperature in desiccator and subsequently weighed using an analytical balance. To the ash, some deionised water (10 drops) and nitric acid (5.85 M, 4 drops) were added as the excess acid evaporated in the oven (110°C) for 30 min. The residues in crucibles were ashed for an additional 1 h at 500°C, cooled and ash taken up in hydrochloric acid (5.09 M, 10.0 ml). The resultant mixture was diluted to the mark in a 50.0-ml volumetric flask with de-ionized water. Standard solutions (50.0 ml; 0.0, 0.05, 0.10, 0.20, 0.30, 0.40 and 0.5 ppm) of each sample were prepared and their absorbances read at 422.7, 248.3 and 213.9 nm for copper, iron and zinc, respectively in a UV/VIS spectrophotometer. The absorbance of sample solutions was read immediately after each standard and their concentration C (ppm) was calculated from standard calibration plot as follows:
Determination of sweet potato genotypes’ loss/gain of b-carotene and ascorbic acid
Loss or gain in b-carotene and ascorbic acid among unpeeled sweet potato genotypes was determined by calculating the difference among b-carotene and ascorbic acid readings at 4, 5 and 7 MAP for each genotype. The results were converted into percentages and assigned a negative or positive sign representing loss or gain of b-carotene and ascorbic acid, respectively. The percentages were plotted into graphs.
Data analysis
Agronomic traits and micronutrients data were subjected to ANOVA using AGROBASE software (Agrobase, 1999) in order to determine differences among genotypes, months of harvest (4, 5 and 7 MAP) and preparation form (peeled and unpeeled). Genotypes were assumed to be fixed, with time of harvesting and sample type effects as random. Least significant difference (p<0.05) was used to compare means.
Dry matter content of 15 genotypes
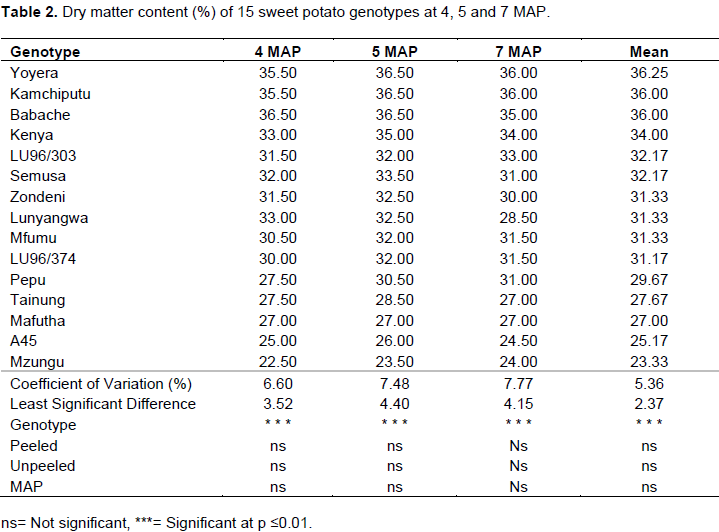
The dry matter (DM) content of sweet potato storage roots at 4, 5 and 7 MAP are presented in Table 2. The DM results demonstrated significant variation among the genotypes within the three MAP at p≤0.01. Variations in percentage DM content across harvesting times and in both sample types, peeled and unpeeled, were not significant at p≤0.05. Across the harvesting times, genotype Yoyera a landrace, exhibited the highest DM content (36.25%) followed by two other landraces; Babache and Kamchiputu (36%). Mzungu (23.33%) and A45 (25.17%) were relatively low in percent DM content. Acceptable levels of dry matter content in preferred genotypes in Malawi are ≥30% (Chipungu et al., 1999) and Kamchiputu and Yoyera are among the best genotypes. Genotypes with high dry matter are preferred because they are usually low in sugar (Baafi et al., 2016a). Determination of dry matter is important since % DM is among key component traits that contribute to total root yield (TRY), others being large root yield (LRY), number of large root per plant (NLR/P), root dry matter yield (RDMY) and harvest index (HI) (Amoatey et al., 2016).
Variation in b-carotene content
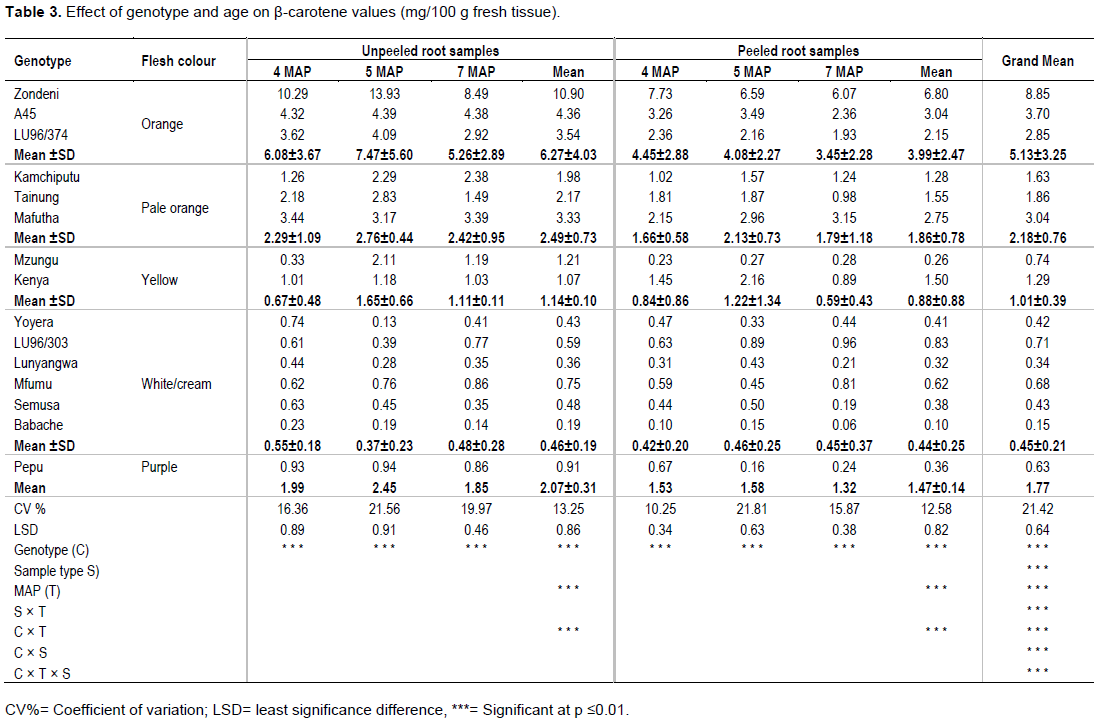
ANOVA results on b-carotene content in 15 sweet potato genotypes, harvested at three different times (MAP) and in two sample type (peeled and unpeeled), are presented in Table 3. The variables under study; genotype, harvesting times and sample type results and their first order interactions; genotype × storage root age, genotype × sample type and storage root age × sample type and second order interactions (genotype × storage root age × sample type) were all highly significant at p≤0.01.
Effect of genotype and flesh colour on b-carotene content
Using unpeeled storage roots at 5 MAP, which is the recommended MAP in Malawi (Chipungu et al., 1999), the results showed high and significant variations in b-carotene content (p≤0.01) among the genotypes (Table 3). This is probably due to the wide spectrum of storage root colour where carotenoids are responsible for the yellow, orange and red colours roots (Rodriguez-Amaya, 1993). Zondeni, an orange fleshed genotype provided the highest b-carotene content (13.93 mg/100 g) followed by A45 (4.39 mg/100 g) which is also an orange fleshed genotype. There was a usual general downward trend in b-carotene levels in the genotypes from orange, pale orange to yellow storage root flesh colour registering colour category means of 7.47±5.60, 2.76±0.44 and 1.65±0.66 mg/100 g, respectively. Very low b-carotene levels were registered in unpeeled white/cream genotypes where genotype Yoyera (0.13 mg/100 g) registered the lowest levels. These observations agree with Stathers et al. (2005) and Mbwaga et al. (2007) findings which showed low beta carotene levels in white/cream genotypes but are contrary to other studies that concluded that white/cream genotypes have absolutely no beta carotene (Van Jaarsveld et al., 2005; Ingabire and Vasanthakaalam, 2011).
The findings also reinforced the fact that root fresh colour is an indicator of relative b-carotene levels with orange and cream showing highest and lowest levels, respectively. The results complement findings by K’osambo et al. (1998), Picha (1985) and Huang et al. (1999) which revealed that b-carotene are largely responsible for the orange flesh colour in sweet potato. Level of b-carotene in genotype Zondeni (13.93 mg/100 g at 5 MAP) is comparatively among the highest in eastern and southern Africa Region (K’osambo et al., 1998; Carey et al., 1999; Manrique and Herman, 2000). Andrade et al. (2009) showed in their study that there is a strong negative correlation between dry matter and b-carotene content in sweet potato; however, Zondeni (31.33%), in this study had fairly high and acceptable levels of dry matter (Table 1). Yield stability studies done in different sites in Malawi also showed that Zondeni was the most stable genotype across all sites (Kathabwalika et al., 2013) implying that it can be grown successfully across the country. However, levels of b-carotene in Zondeni, A45 and other orange fleshed genotypes in the study (Table 3), fall far short of what is considered high by the International Potato Centre (CIP, 2005) (100 g/1 g of fresh tissue). Nevertheless, the genotypes can make considerable contribution towards addressing vitamin A deficiency (VAD) whose incidences are worrisome in Africa including Malawi (Hotz et al., 2011; Shisana et al., 2013; Girard et al., 2017). Isolation and identification of genotypes with high level of b-carotene is important for effective choice of parents in breeding improved varieties with higher b-carotene levels (Vimala et al., 2012; Kiarie et al., 2016; Naidoo et al., 2016).
Effect of peeling on b-carotene content at 5 MAP
Table 3 reveals that on average, at all MAP, peeling of sweet potato root samples significantly (p≤0.01) reduced b-carotene levels in most genotypes. However, variation in gain or loss resulting from peeling was mainly observed at 5 MAP where some genotypes such as Kenya, Yoyera, LU96/303, Lunyangwa and Semusa gained while the rest lost b-carotene (Data not shown). In this study, peeling of storage roots generally resulted in b-carotene loss averaging 28.7, 46.7 and 39.1% at 4, 5 and 7 MAP, respectively inferring that sweet potato peels contain substantial amounts of b-carotene. This observation concurs with findings by Akoetey et al. (2017) which showed that sweet potato peels are a good source of micronutrients including b-carotene. Rodriguez-Amaya (1993) also reported that most fruits and vegetables have higher carotenoid levels in the peel than the pulp. However, the increases in b-carotene levels after peeling in Yoyera, Kenya,LU96/303 and Lunyangwa presents a challenge to scientists that would be solved by a proper understanding of responsible genes and the dynamics of their expression. A study done by Baafi et al. (2016b) showed that genetic variability for the traits that control expression of micronutrients (b-carotene, iron and zinc) in sweet potato are mostly controlled by additive gene effect and the study found significant heterosis suggesting that levels of micronutrients could be improved through breeding.
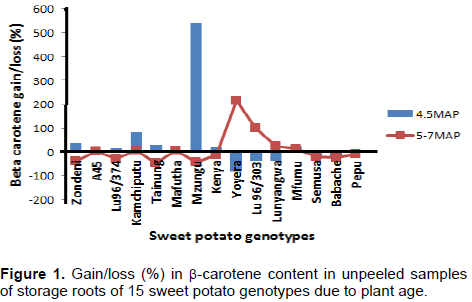
Effect of root age on b-carotene content in unpeeled samples
Figure 1 shows that except for Kamchiputu and Mafutha, all orange, pale orange and yellow fleshed genotypes gained and lost b-carotene as the roots aged from 4 to 5 MAP and 5 to 7 MAP, respectively in unpeeled samples. In general, the opposite was observed in white/cream fleshed genotypes where losses and gain in b-carotene was observed as the roots aged from 4 to 5 MAP and 5 to 7 MAP, respectively in unpeeled samples. This observation suggests that various genotypes would have various recommended time of harvesting for maximum use of the micronutrient. However, it is well established that plant age affects the composition of food nutrients including b-carotene levels. Carey et al. (1999) reported increasing β-carotene levels with age; the values peaked at 5 MAP and declined thereafter. Also, in leafy vegetables, the β-carotene content of mature leaves of lettuce (12 µg/g) and endive (14 µg/g) were nearly three times higher than those of the young leaves (Ramos and Rodriguez-Amaya, 1987).
Percent contribution of variables to the total sum of squares
Since all the variables and their interactions under study showed significant (p≤0.01) contributions to β-carotene content as presented in Table 3, an estimate of the contribution of each variable to the total sum of squares (TSS) of β-carotene content was conducted to isolate determinant variables of β-carotene in sweet potato genotypes (Table 4).
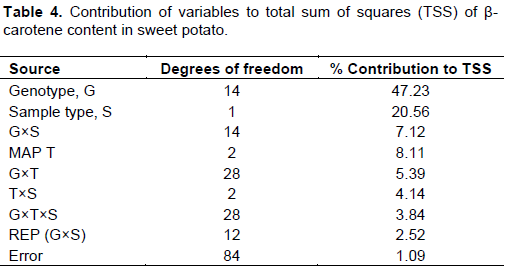
The results revealed that genotypes’ β-carotene content was largely due to genetic variability which accounted for 47.23% of the TSS (Table 4). This means that β-carotene content could be shared among genotypes through breeding since it is genes-based. The second variable of importance was sample type (peeled or unpeeled), which contributed 20.56% to the TSS; unpeeled sample being superior in β-carotene content. This is not surprising since peels are known to contain more carotenoids than the pulp (Rodriguez-Amaya, 1993). The contribution of harvesting time and other interactions to TSS was less than 10% and therefore regarded as less important in determining β-carotene.
Ascorbic acid (Vitamin C) content in sweet potato genotypes
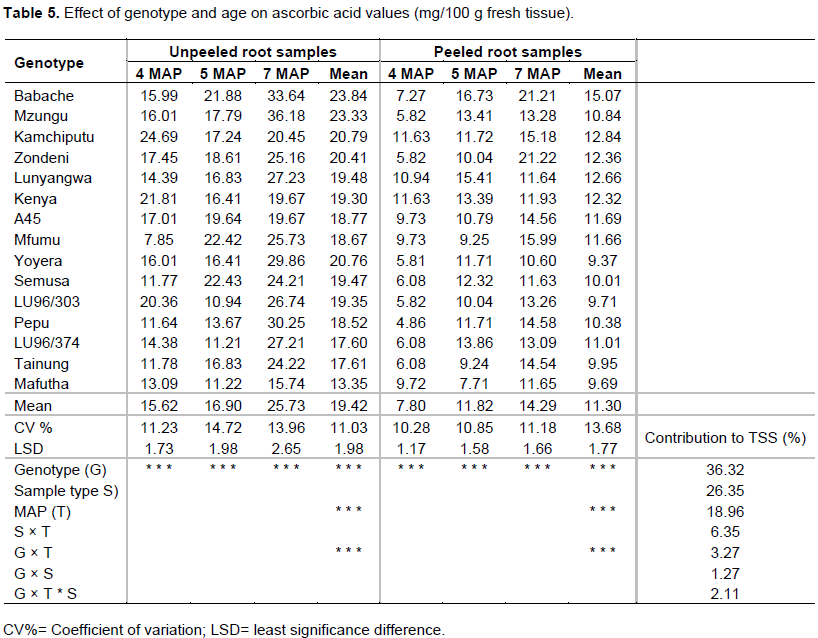
The levels of ascorbic acid in 15 genotypes assessed at 4, 5 and 7 MAP in unpeeled and peeled storage root samples of sweet potato are provided in Table 5.
Genotypic variability of ascorbic acid content
At 5 MAP and in unpeeled samples, the results in Table 5 showed that significant (p≤0.01) variation in ascorbic acid content existed among the genotypes. Genotypic variability contributed the highest percent to the TSS (36.32%) followed by sample type (26.35%; unpeeled). For instance, genotype Semusa (22.43 mg/100 g; fresh weight; 5 MAP) gave the highest ascorbic acid content and was not significantly different from Mfumu (22.42
mg/100 g; 5 MAP) and Babache (21.88 mg/100 g; 5 MAP) (p≤0.01) while the least was LU96/303 (10.94 mg/100 g; 5 MAP). On average, across harvesting times and sample types, different genotypes exhibited different rankings for ascorbic acid content. For instance, in unpeeled samples, Babache (23.84 mg/100 g) ranked highest while Mafutha was lowest (13.35 mg/100 g). In the peeled samples, Babache (15.07 mg/100 g) was the highest and Yoyela (9.37 mg/100 g) was the lowest. The mean level of ascorbic acid from unpeeled samples across all MAP (19.42 mg/100 g) was lower than (26.35mg/100g) reported by Bradbury and Singh (1986) from four Solomon Island sweet potato genotypes.
Effect of age on ascorbic content
The performance of 15 genotypes in ascorbic acid content as affected by delayed harvesting in unpeeled samples is presented in Figure 2. A one month delay (4 to 5 MAP) in harvesting resulted in the accumulation of ascorbic acid levels in 10 out of the 15 genotypes with highest accumulation percent in genotype Mfumu (185.6%) and Semusa (90.6%).
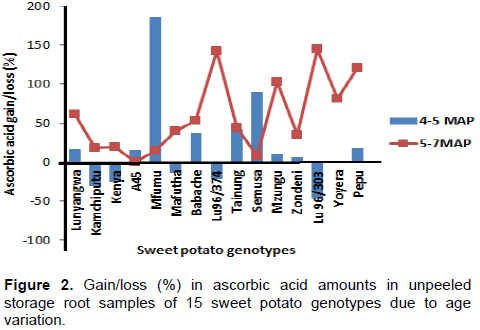
The genotype LU96/303 (-46.27%) experienced the highest percent loss at 5 MAP followed by Kamchiputu (-30.17%). An average accumulation of 42.6% was observed due to age from 4 to 5 MAP. A two months delay from 5 to 7 MAP resulted in further accumulation of ascorbic acid in all genotypes. The genotype LU96/303 which experienced the highest loss due to one month delay in harvesting from 4 to 5 MAP, showed the highest percentage gain (144.42%) in ascorbic acid due to two months delay from 5 to 7 MAP followed by LU96/374 (142.73%). The lowest percentage gain was exhibited by A45 (0.15%). A two months delay from 5 to 7 MAP gave an average percent increase in ascorbic acid of 59.3%. Generally, delayed harvesting of sweet potato roots resulted in increased ascorbic acid content due to increased size of storage root which is directly associated with increased levels of water soluble ascorbic acid (Rukundo et al., 2013). Lanier and Sistrunk (1979) showed that ascorbic acid levels vary with size of storage roots. This study also corroborated findings from elsewhere that showed that sweet potato is a good source of vitamin C (Low et al., 2009; Sreekanth et al., 2010; Hotz et al., 2012).
Mineral content (Iron, Zinc and Copper)
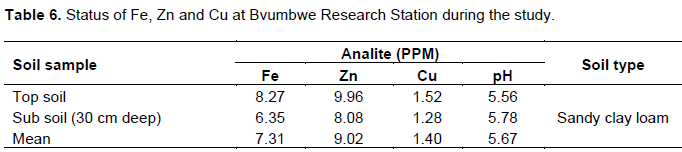
Table 6 presents the status of soil mineral composition at the planting of study genotypes at Bvumbwe Agricultural Research Station. Iron (Fe), zinc (Zn) and copper (Cu) contents in peeled and unpeeled sweet potato samples at 4, 5 and 7 MAP are presented in Tables 7, 8 and 9, respectively. The sweet potato genotypes exhibited significant (p≤0.05) variations in the three mineral elements at 4, 5 and 7 MAP and sample types (peeled and unpeeled). This can be attributed to dynamics in soil mineral content and interaction between minerals and genotypes (Woolfe, 1992; Ingabire and Vasanthakaalam, 2011; Ukom et al., 2011). Zhang et al. (2003) and Laurie et al. (2012) showed that sweet potato is rich in various minerals including K, Ca, Fe, P, Se, Cu and Zn. Iron, zinc and copper are usually present in the soil in adequate to excess amounts (Table 6) (Laurie et al., 2012), such that deï¬ciencies are due to their presence in unavailable forms rather than their lack. Environmental factors such as leached soils, acid, sandy soils, organic soils, intensively cropped soils, soils with high pH, and eroded soils also affect solubility of micronutrients (Brady and Weil, 2002). However, mineral content variations in genotypes are attributed mainly to differences among genotypes in uptake efficiency and capacity to solubilize non-available nutrients (Rengel, 2001).
Effect of genotype, age and peeling on iron content
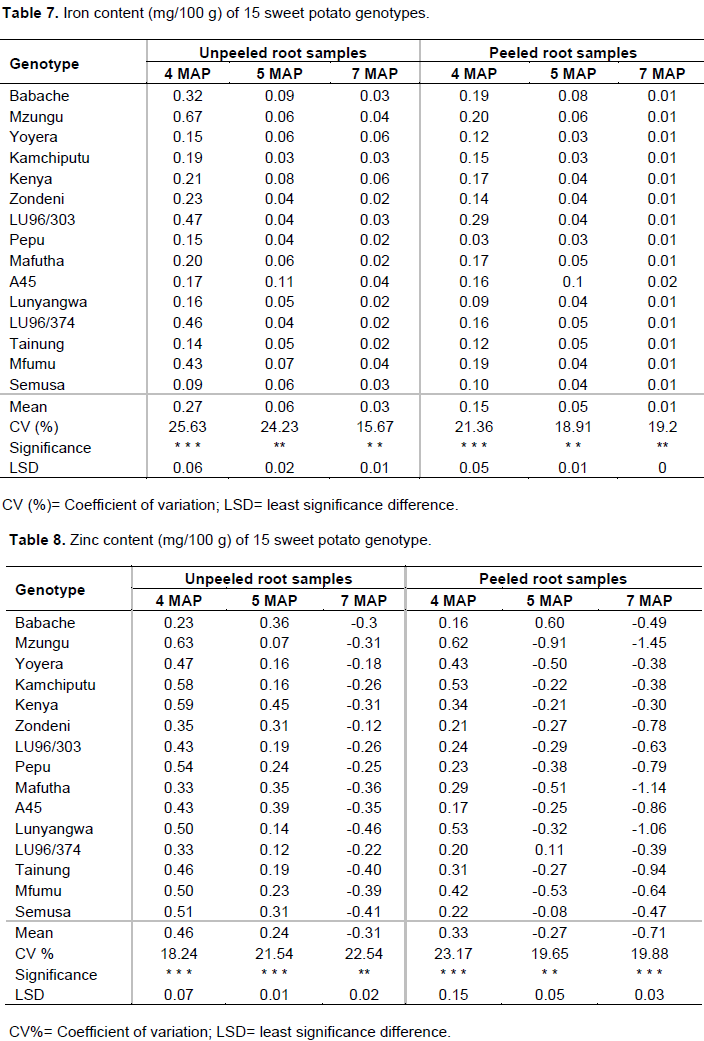
Results in Table 7 indicate that the highest iron content (0.67 mg/100 g) in unpeeled samples was recovered at 4 MAP in genotype Mzungu followed by LU96/374 (0.46 mg/100 g) and Mfumu (0.43 mg/100 g). Unpeeled Semusa at 4 MAP recorded the least iron (0.09 mg/100 g). Upon peeling of samples at 4 MAP, LU96/303 retained the highest amount (0.29 mg/100 g) while Pepu had the least iron (0.03 mg/100 g). Delays in lifting of storage roots reduced iron content in all genotypes and in both peeled and unpeeled samples, with the highest value being unpeeled A45 (0.11 mg/100 g) at 5 MAP. This loss could be due to the sweet potato plant ultimately using up the iron in the storage root. Iron content from all genotypes at average MAP (0.12 mg/100 g) observed in this study is lower than what Sanoussi et al. (2016) (0.63 mg/100 g), Bradbury and Holloway (1988) (0.93 mg/100 g) and Laurie et al. (2012) (0.995 mg/100 g) reported in Benin, Australia and South Africa, respectively. Thus, Malawian genotypes in the study need to be bred for increased iron levels since lack of iron is the main cause of severe anaemia in children (Sanoussi et al., 2013).
Effect of genotype, age and peeling on zinc content
The levels of zinc in the 15 genotypes in the study are provided in Table 8. The highest level of zinc in unpeeled storage roots was registered in genotype Mzungu (0.63 mg/100 g) at 4 MAP followed by Kenya and Kamchiputu (0.59 and 0.58 mg/100 g, respectively). In peeled samples, genotype Mzungu remained the highest (0.62 mg/100 g) followed by Kamchiputu and Lunyangwa (0.53 mg/100 g). Babache is the only genotype that showed an increase in Zn content from 0.16 to 0.60 g/100 g in peeled samples and from 0.23 to 0.36 mg/100 g in unpeeled samples when lifting was delayed by a month (from 4 to 5 MAP). Across genotypes, the results indicated that when storage roots are harvested late and peeled, Zn levels decreases. At 4 MAP, potentially 14 out of 15 unpeeled genotypes in the study (Table 8) have higher zinc levels than that reported by Woolfe (1992) (0.24 mg/100 g), Sanoussi et al. (2016) (0.25 mg/100 g) and comparable with 0.59mg/100g reported by Bradbury and Holloway (1988). The levels found by Woolfe (1992) and Sanoussi et al. (2016) are below daily recommended dietary intake in both children and adults (La Frano et al., 2014), hence Malawian genotypes would not necessarily need zinc fortification.
Effect of genotype, age and peeling on copper content
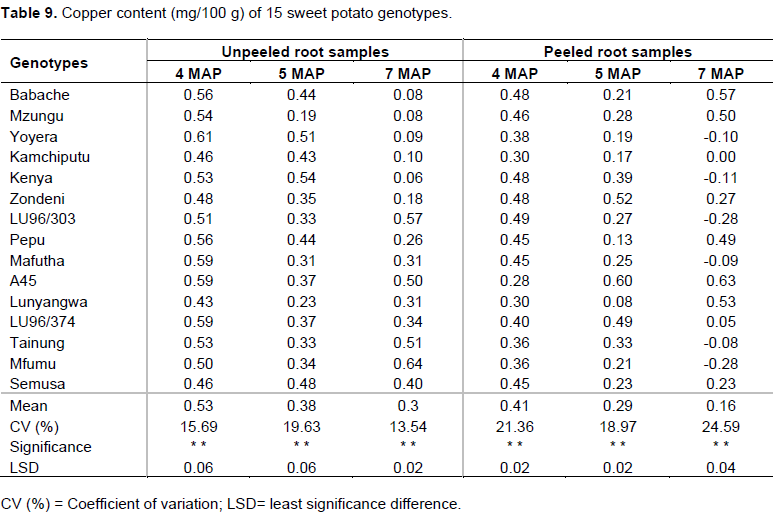
Highest levels of copper were observed at 4 MAP among unpeeled genotypes ranging from 0.43 to 0.61 mg/100 g (Table 9). A general dwindling trend in copper content from 4 to 5 MAP was exhibited in both preparation methods resulting from age of the storage roots except for Kenya and Semusa (unpeeled samples) and Zondeni and LU96/374 (peeled samples).
Thus peeling of storage roots of some genotypes resulted in total loss of copper at 7 MAP. While Woolfe (1992) reported copper mean value of 0.35 mg/100 g, Kruger et al. (1998) (0.32 mg/100 g), Bradbury and Holloway (1988) (0.16 mg/100 g), Away (2008) (0.42 mg/100 g), mean copper values observed in this study (0.28 mg/100 g; peeled) and (0.40 mg/100 g; unpeeled) are comparably higher. This entails high potential of the Malawian germplasm as a source of dietary copper, which is good for prevention of anemia, low body temperature, bone fractures and osteoporosis (Decuyperes, 2000).
Sweet potato is a cheap and suitable option for alleviating "hidden hunger" of micronutrients in developing countries owing to its richness in b-carotene, a precursor for pro-vitamin A, ascorbic acid (Vitamin C), iron, zinc and copper. In general, the study revealed that peeling reduces Vitamin A and C, iron, zinc and copper in genotypes while delayed harvesting of sweet potato results in reduced levels of iron, zinc and copper. Harvesting at 5 and 4 MAP gives highest levels of (Vitamin A and C) and (iron, zinc and copper), respectively. The most important determinant of levels of Vitamin A and C is genotype other than sample type or any other interactions. Vitamin A levels generally decrease as genotypes’ flesh colour changes from orange, pale orange, yellow to white/cream; thus, sweet potato based VAD programs should target orange fleshed sweet potato.
A total of 10 out of the 15 genotypes in the study exhibited acceptable levels of dry matter of ≥30% and genotypes Kamchiputu, Yoyela and Babache were among the best. Zondeni (10.9 mg/100 g) and Babache (23.84 mg/100 g) are the best genotypes in terms of levels of Vitamin A (β-carotene) and Vitamin C (ascorbic acid) respectively. Genotype Mzungu is the best in iron (0.67 mg/100 g) and zinc (0.63 mg/100 g) levels while Yoyera (0.61 mg/100 g) provides the highest levels of copper.
The authors have not declared any conflict of interests.
REFERENCES
|
Abubakar HN, Olayiwola IO, Sanni SA, Idowa MA (2010). Chemical composition of sweet potatoes (Ipomoea batatas Lam) dishes as consumed in Kware state, Nigeria. Int. Food Res. J. 17:411- 416.
|
|
|
|
Andrade M, Barker I, Cole D, Dapaah H, Elliot H, Fuentes S, Gruneberg W, Kapinga R, Kroschel J, Labarta R, Lemaga B, Loechl C, Low J, Lynam J, Mwanga R, Ortiz O, Oswald A, Thiele G (2009). Unleashing the Potential of Sweet potato in Sub-Saharan Africa: Current Challenges and Way Forward, Working Paper 2009-1, International Potato Center (CIP), Lima, Peru.
|
|
|
|
Agrobase TM (1999). Agronomic Software. 71 Waterloo St Winnipeg, R3N0S4, Canada.
|
|
|
|
Akoetey W, Britain MM, Morawicki RO (2017). Potential use of byproducts from cultivation and processing of sweet potatoes. Ciênc. Rural 47(5).
Crossref
|
|
|
|
Amoatey HM, Sossah FL, Ahiakpa JK, Quartey EK, Appiah AS, Segbefia MM (2016). Phenotypic profiles of different accessions of sweet potato (Ipomoea batatas (L.) Lam) in the coastal savanna agro-ecological zone of Ghana. Afr. J. Agri. Res. 11(26):2316-2328.
Crossref
|
|
|
|
Girard WA, Grant F, Watkinson M, Okuku HS, Wanjala R, Cole D, Levin C, Low J (2017). Promotion of orange-fleshed sweet potato increased vitamin A intakes and reduced the odds of low retinol-binding protein among postpartum Kenyan Women. J. Nutr.
Crossref
|
|
|
|
Association of Official Analytical Chemists (AOAC) (2000). Official Methods of Analysis. 17th ed. Association of Official Analytical Chemists, Washington, DC.
|
|
|
|
Away AK (2008). Levels of selected nutrients in verities of Ipomoea batatas grown in vihiga county, Kenya. MSc Thesis.
|
|
|
|
Baafi E, Carey EE, Blay ET, Ofori K, Gracen VE, Manu-Aduening J (2016a). Genetic incompatibilities in sweet potato and implications for breeding end-user preferred traits. Austral. J. Crop Sci. 10(6):887.
Crossref
|
|
|
|
Baafi E, Ofori K, Carey EE, Gracen VE, Blay ET, Manu-Aduening J (2016b). Genetic Control of Beta-carotene, Iron and Zinc Content in Sweet potato. J. Plant Stud. 6(1).
Crossref
|
|
|
|
Boney W, Yalu A, Ramakrishna A, Deros M (2014). Genotypic Variability Estimates of Agronomic Traits for Selection in A Sweet potato [Ipomoea batatas (L.) Lam.] Poly crosses Population in Papua New Guinea. J. Plant Breed. Genet. 2(3):131-136.
|
|
|
|
Bradbury JH, Holloway WD (1988). Chemistry of tropical root crops. Australian Centre for International Agricultural Research. Canberra, pp. 101-119.
|
|
|
|
Bradbury JH, Singh U (1986). Thiamin, riboflavin, and nicotinic acid contents of tropical root crops from the South Pacific. J. Food Sci. 51(6):1563-1568.
Crossref
|
|
|
|
Brady NC, Weil RR (2002). The nature and properties of soils. 13th edition. Upper Saddle, New Jersey, Prentice Hall pp. 957-967.
|
|
|
|
Carey EE, Reynoso D (1999). Procedures for the evaluation of pathogen tested sweet potato clones In: Sweet potato Germplasm Management (Ipomoea batatas) Training manual. International Potato Centre, Lima, Peru pp. 170-186.
|
|
|
|
Carey EE, Hagenimana V, K'osambo L, Oyunga MA, Benesi I, Smit N, Ocitti p'Obwoya C, Turyamureeba G, Ndolo PJ, Low J (1999). Using orange-fleshed sweetpotato varieties to combat vitamin A deficiency and enhance market opportunities for smallholder farmers in sub-Saharan Africa. In: food security and crop diversification in SADC countries: the role of cassava and sweet potato. Akoroda MO, Teri JM (eds.). Proceedings of the scientific workshop of the Southern African Root Crops Research Network (SARRNET) held at Pamodzi Hotel, Lusaka, Zambia, pp. 157-168.
|
|
|
|
Centro Internacional de la Papa (CIP) (2005). Sweet potato, treasure for the poor. La Molina, Peru, Intl. Potato Center.
View
|
|
|
|
Chipungu FP, Benesi IRM, Moyo CC, Mkumbira J, Sauti RFN, Soko MM, Sandifolo V (1999). Field evaluation of introduced sweet potato clones in Malawi. In: food security and crop diversification in SADC Countries: the role of cassava and sweet potato. Akoroda MO, Teri JM (eds.). Proceedings of the scientific workshop of the Southern African Root Crops Research Network (SARRNET) held at Pamodzi Hotel, Lusaka, Zambia pp. 151-156.
|
|
|
|
Decuyperes C (2000). Vegetable charts.
|
|
|
|
Demment MW, Young MM, Sensenig RL (2003). Providing micronutrients through food based- solutions: key to human and national development. J. Nutr. 133:3879S-3885.
|
|
|
|
Food and Agriculture Organisation (FAO) (2013). Food and Agriculture Organization of the United Nations (FAO). 2013. The State of Food Insecurity in the World 2013. The multiple dimensions of food security. Rome, Italy: FAO.
|
|
|
|
Food and Agriculture Organisation (FAO) (2015). Myanmar floods deal major blow to country's agriculture, the Food and Agriculture Organisation (FAO), 3 Sept 2015.
|
|
|
|
Food and Agriculture Organisation (FAO) (1996). World food summit plan of action. Rome, Italy.
|
|
|
|
Food and Agriculture Organisation / World Health Organisation (FAO/WHO) (2002). Human vitamin and mineral requirements. Report of a joint FAO/WHO expert consultation. Rome, Italy.
|
|
|
|
Food and Agriculture Organization Corporate Statistical Database (FAOSTAT) (2012). Global production and consumption of root and tuber. In: FAO corporate document repository. Report on the Inter-center review of root and tuber crops research in the CGIAR.
View
|
|
|
|
Famine Early Warning Systems / Ministry of Agricultural and Food Security (FEWS/MoAFS) (1995 to 2006). FAO/WFP crop and food supply assessment mission to Malawi.
|
|
|
|
Hotz C, Abdelrahman L, Sison C, Moursi M, Loechl C (2011). A food composition table for central and eastern Uganda. Washington (DC): HarvestPlus; 2011.
|
|
|
|
Hotz C, Loechl C, de Brauw A, Eozenou P, Gilligan D, Moursi M, Munhaua B, van Jaarsveld P, Carriquiry A, Meenakshi JV (2012). A large-scale intervention to introduce orange sweet potato in rural Mozambique increases vitamin A intakes among children and women. Br. J Nutrit. 108:163-176.
Crossref
|
|
|
|
Huang AS, Tanudjaja L, Lum D (1999). Content of alpha-, beta-carotene and dietary fiber in 18 sweetpotato varieties grown in Hawaii. J. Food compos. Anays. 12:147-151.
|
|
|
|
Ingabire MR Vasanthakaalam H (2011). Comparison of the Nutrient Composition of four sweet potatoes varieties cultivated in Rwanda. Am. J. Food Nutri.
View
|
|
|
|
Imungi JK, Wabule MN (1990). Some chemical characteristics and availability of vitamin A and vitamin C from Kenyan varieties of papayas (Carica papaya L.). Ecol. Food Nutr. 24:115-120.
Crossref
|
|
|
|
James C (2015). Global status of commercialized Biotech/GM Crops: 2015. ISAAA Brief No51. ISAAA: Ithaca, New York, USA.
|
|
|
|
Kathabwalika DM, Chilembwe EHC, Mwale VM, Kambewa D, Njoloma JP (2013). Plant growth and yield stability of orange fleshed sweet potato (Ipomoea batatas) genotypes in three agro-ecological zones of Malawi. Int. Res. J. Agric. Sci. Soil Sci. 3(11):383-392.
|
|
|
|
Kennedy G, Natel G, Shetty P (2003). The scourge of hidden hunger: global dimensions of micronutrient deficiencies. Food Nutr. Agric. 32:8-16.
|
|
|
|
Kiarie SM, Karanja LS, Obonyo MA, Wachira FN (2016). Application of SSR markers in determination of putative resistance to SPVD and genetic diversity among orange flashed sweet potato. J. Adv. Biol. Biot. 9(2):1-10.
Crossref
|
|
|
|
K'osambo LM, Carey EE, Misra AK, Wilkes J, Hagenimana V (1998). Influence of age, farming site and boiling on pro-vitamin A content in sweetpotato (Ipomea batatas (L.) Lam.) storage roots. J. Food Compos. Analys. 11:305-321.
Crossref
|
|
|
|
Kruger M, Sayed S, Langenhoven M, Holing F (1998). Composition of South African Foods, Vegetables and Fruits. Supplement to the MRC Food composition Tables 1991.Tygerberg: Medical research council, Pretoria, South Africa, pp. 245-278.
|
|
|
|
La Frano MR, de Moura FF, Boy E, Lönnerdal B, Burri BJ (2014). Bioavailability of iron, zinc and provitamin A carotenoids in biofortified staple crops. Nutri. Rev. 72(5):289-307.
Crossref
|
|
|
|
Lanier JJ, Sistrunk WA (1979). Influence of cooking methods on quality attributes and vitamin content of sweet potato. J. food Sci. 44:374-376.
Crossref
|
|
|
|
Laurie SM, Faber M (2008). Integrated community based growth monitoring and vegetable gardens focusing on crops rich in â-carotene: Project evaluation in a rural community in the Eastern Cape, South Africa. J. Sci. Food Agri. 88:2093-2101.
Crossref
|
|
|
|
Laurie SM, Faber M, van Jaarsveld PJ, Laurie RN, du Plooy CP, Modisane PC (2012). β-Carotene yield and productivity of orange-fleshed sweet potato (Ipomoea batatas L. Lam.) as influenced by irrigation and fertilizer application treatments. Sci. Horticult. 142(13):180-184.
Crossref
|
|
|
|
Low J, Lynam J, Lemaga B, Crissman C, Barker I, Thiele G, Namanda S, Wheatley C, Andrade M (2009). Sweet potato in sub-Saharan Africa. In: Loebenstein G, Thottappilly G (Eds.). The Sweet Potato. Springer, Berlin, pp. 359-390.
|
|
|
|
Low JW, Van Jaarsveld PJ (2008). The potential contribution of bread buns fortified with β-carotene-rich sweet potato in Central Mozambique. Food Nutr. Bull 29:98-107.
Crossref
|
|
|
|
Manrique K, Herman M (2000). Effect of G×E interaction on root yield and beta-carotene content of selected sweet potato varieties and breeding clones. CIP Program Report 2000:281-287.
|
|
|
|
Mbwaga Z, Mataa M, Msabaha M (2007). Quality and yield stability of orange-fleshed sweet potato (Ipomoea batatas (L)) grown in different Agro-ecologies. Afr. Crop Sci. Conf. Proc. 8:339-345.
|
|
|
|
Meludu NT (2010). Proximate analysis of Sweet potato toasted granules. Afr. J. Biomed. 13:89-91.
|
|
|
|
Musinguzi E, Kikafunda JK, Kiremire BT (2006). Utilization of indigenous food plants in Uganda: A case study of south –western Uganda. Afr. J. Food Agric. Nutr. Dev. 6 (2):723-724.
|
|
|
|
Nabakwe EC, Ngare KD (2004). Health and nutritional status of children in Western Kenya in relation to Vitamin A deficiency. East Afr. J. Pub. Heal. 1:1-8.
|
|
|
|
Naidoo SLM, Laurie SM, Odeny DA, Vorrster BJ, Mphela WM, Greyling MM, Crampton BG(2016). Genetic analysis of yield and flesh colour in sweet potato. Afr. Crop Sci. J. 24:(1)61-73.
Crossref
|
|
|
|
Nawiri MP, Nyambaka HN, Murungi JI (2012). Sundried cowpeas and Amaranthus leaves recipe improves β-carotene and retinol in serum and hemoglobin concentration among preschool children. Eur. J. Nutri.
View
|
|
|
|
Picha DH (1985). HPLC determination of sugars in raw and baked sweet potatoes. J. Food Sci.50:1189-1190.
Crossref
|
|
|
|
Ramos DRM, Rodriguez-Amaya DB (1987). Determination of the vitamin A value of common Brazilian leafy vegetables. J. Micronutr. Analys. 3:147-55.
|
|
|
|
Rengel Z (2001). Genotypic differences in micronutrient use efficiency in crops. Commun. Soil Sci. Plant Analys. 32:1163-1186.
Crossref
|
|
|
|
Rodriguez-Amaya DB (1993). Stability of carotenoids during the storage of foods. In: Charalambous G (ed.). Shelf life studies of foods and beverages. Chem. Boil. Phys. Nutr. Aspects. Amsterdam, Elsevier Science Publishers pp. 591-628.
|
|
|
|
Rukundo P, Shimelis H, Laing M, Gahakwa D (2013). Storage root formation, dry matter synthesis, accumulation and genetics in sweet potato. Austr. J. Crop Sci. 13:2054-2056.
|
|
|
|
Sanoussi AF, Dansi A, Bokossa-yaou I, Dansi M, Egounlety M, Sanni LO, Sanni A (2013). Formulation and biochemical characterization of sweet potato (Ipomoea batatas) based infant flours fortified with soybean and sorghum flours. Int. J. Curr. Microbiol. App. Sci. 2(7):22-34.
|
|
|
|
Sanoussi AF, Adjatin A, Dansi A, Adebowale A, Sanni LO, Sanni A (2016). Mineral Composition of Ten Elites Sweet Potato (Ipomoea batatas [L.] Lam.) Landraces of Benin. Int. J. Curr. Microbiol. App. Sci. 5(1):103-115.
Crossref
|
|
|
|
Shisana O, Labadarios D, Rehle T, Simbayi L, Zuma K, Dhansay A, Reddy P, Parker W, Hoosain E, Naidoo P, Hongoro C, Mchiza Z, Steyn NP, Dwane N, Makoae M, Maluleke T, Ramlagan S, Zungu N, Evans MG, Jacobs L, Faber M, SANHANES-1 Team (2013). South African National Health and Nutrition Examination Survey (SANHANES-1). HSRC Press, Cape Town, South Africa.
|
|
|
|
Sreekanth A, Nedunchezhiyan M, Laxminarayana K, Misra RS, Rajasekhara RK, Siva Kumar PS (2010). In: Attaluri S, Janardhan KV, Light, A. (Eds.), Sustainable Sweet potato Production and Utilization in Orissa, India. International Potato Center (CIP), Bhubaneswar pp. 11-18.
|
|
|
|
Stathers T, Namanda S, Mwanga ROM, Khisa G, Kapinga R (2005). Manual for Sweet potato Integrated Production and Pest Management Farmer Field Schools in sub-Saharan Africa, International Potato Center, Kampala.
|
|
|
|
Sunette ML (2010). Agronomic Performance, Consumer acceptability and nutrient content of new sweet potato varieties in South Africa. PhD thesis, University of Free state, South Africa 13-56.
|
|
|
|
Ukom AN, Ojimelukwe PC, Alamu EO (2011). All trans-cis β-carotene content of selected sweet potato (Ipomea batatas (L) Lam) varieties as influenced by different levels of nitrogen fertilizer application. Afr. J. Food Sci. 5(3):131-137.
|
|
|
|
United Nations Department of Environment and Social Affairs (UN DESA) (2015). World population prospects, 2015.
View
|
|
|
|
Van Jaarsveld PJ, Faber M, Tanumihardjo SA, Nestel P, Lombard CJ, Benade AJ (2005). Beta-carotene-rich orange-fleshed sweet potato improves the vitamin A status of primary school children assessed with the modified-relative-dose-response test. Am. J. Clin. Nutr. 81:1080-1087.
|
|
|
|
Vimala B, Sreekanth A, Hariprakash B, Wolfgang G (2012). Variation in morphological characters and storage root yield among exotic orange-fleshed sweet potato clones and seedling population. J. Root Crops 38(1):32-37.
|
|
|
|
Woolfe JA (1992). Sweet potato, An untapped food resource. New York/Cambridge, Cambridge University Press, UK pp. 23-79.
|
|
|
|
World Health Report (2004). Joint statement by the World Health Organization, the World Food Programme and the United Nations Children's Fund. Preventing and controlling micronutrient deficiencies in populations affected by an emergency. Multiple vitamin and mineral supplements for pregnant and lactating women and for children aged 6 to 59 months.
|
|
|
|
Yamakawa O, Yoshimoto M (2002). Sweet potato as food material with physiological functions. Acta Horticult. 583:179-185.
Crossref
|
|
|
|
Zhang LM, Wang QM, Wang YX (2003). The Main Nutrient Components and Health Care Function of Sweet Potato. Rain Fed Crops 23:162-166.
|