Full Length Research Paper
ABSTRACT
Peanut is of paramount importance in human and animal nutrition, as well as in improving producers’ income. However, its production is faced with abiotic and biotic constraints. Among the biotic constraints, Cercosporiosis diseases are a major handicap in Burkina Faso. In order to minimize the impact of these diseases on peanut yield, important work has been carried out and is still ongoing to select and develop resistant genotypes. This study, carried out in Gampela is aimed at testing the agronomic performance of 30 peanut genotypes from Texas in comparison with a local one (TS32-1). The experiment was carried out using a Fisher (3) repetition block experimental system and the data were processed using XLSTAT pro software. Parameters such as the growth percentage on 15 days after sowing, the survival rate, the severity of the disease and the yield were measured. With respect to Cercosporiosis susceptibility, only the local genotype TS32-1 was sensitive; the genotypes TxL151109-02, TxL151134-02, TxL151148-04, TxL151121-03, TxL151107-01 and TxL151151-01 were moderately resistant. Only genotype TxL151109-02 had a higher yield (0.36 t/ha) than that of the local one TS32-1 (0.28 t/ha) and the lowest yield was from the genotype TxL151105-05 (0.03 t/ha).
Key words: Arachis hypogaea, agronomic performance, Cercosporiosis, yield, Burkina Faso, Texas.
INTRODUCTION
Peanut (Arachis hypogaea L.) is an annual legume from South America, grown in most tropical and subtropical regions. It is grown on all continents on 25.32 millions hectares for a total production estimated to 42.77 million tons (USDA, 2018). Africa holds 42.19% of the total area used for ​​this crop with a production of 24.22%. Peanuts alone account for about 10% of world oilseed production (Fletcher and Nadolnyak, 2006) and are of great economic, nutritional, medicinal and ecological importance.
In Burkina Faso, peanuts are grown in all regions except the extreme northern part, which is very arid and unsuitable for this crop (Sankara, 1997). In this country, peanut is for farmers one of the cash crops after cotton, sesame and soya (Dgess, 2017) and contributes significantly to improving household income in rural areas (FAO, 2013).
However, biotic factors are the major constraints that severely handicap groundnut production. Among these actors, foliar diseases including early and late rust, rosette and Cercosporiosis are among the most important. The combined action of Cercosporiosis and rust can cause more than 70% of yield loss in case of serious attack. Faced with this situation, several control methods have been developed with the aim of optimizing yield, namely cultivation practices, biological control, chemical control, genetic control and integrated pest management. Among these methods, chemical control proved to be the most effective. But its negative impacts on the environment and on human health make its use strongly limited. To overcome this problem, thirty (30) genotypes were selected in Texas through the PMIL project (Peanut Micotoxin Innovation Laboratory) and sent to Burkina Faso for testing. The purpose of this study is therefore to evaluate the agronomic performance of these selected genotypes in Texas.
MATERIALS AND METHODS
Study area
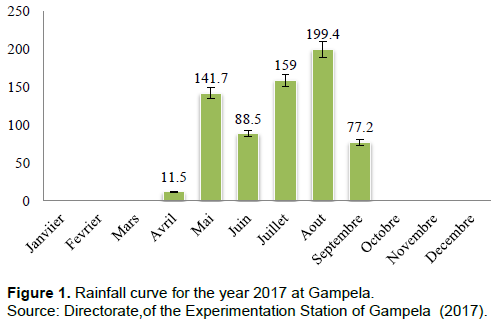
The study was carried out at the experimentation station at Gampèla in Burkina Faso, located eighteen kilometers east of Ouagadougou at 12° 22 west longitude and 12° 25 north latitude, on the main road Ouagadougou-Fada N'gourma. The climate is of the Sudano-Sahelian type with an average temperature ranging between 21.5 and 34.8°C (Sankara, 1997). During the 2017 agricultural campaign, the peroid of this work, the uneven rainfall was 677.3 millimeters (mm) according to the data collected at the station (Figure 1). The soils of Gampela are of tropical type more or less leached (Thiombiano and Kappmann, 2010) with a pH ranging from 5 to 6.3 (Sankara, 1997).
Plant material
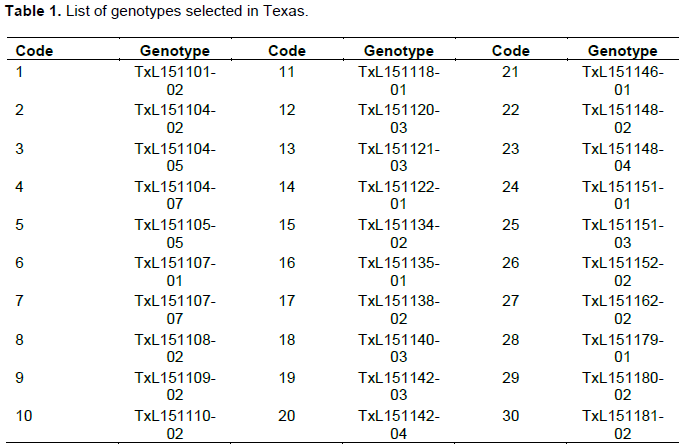
The plant material used in this study consists of thirty (30) genotypes from Texas (USA) (Table 1) and a sensitive reference genotype TS32-1. TS32-1 is a genotype selected by the INERA (Institute of the Environment and Agricultural Research) by crossing Te.3 with Spantex. The Spanish botanical type, the TS32-1 genotype has a short cycle (90 days) with a good yield and is popularized in Burkina Faso (Sankara, 1997). It is a genotype susceptible to Cercosporiosis, rosette, rust, and Aspergillus flavus. Its seeds are not dormant (Subrahmanyam et al., 1982). Table 1 lists the genotypes studied.
Experimental device
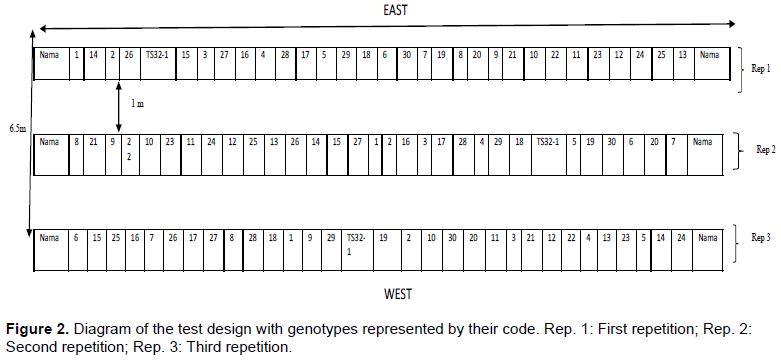
The experiment ssystem is a completely randomized Fischer block with three repetitions (Figure 2). Each repetition has thirty-one (31) genotypes with one line per variety and repetition. The spacing between two consecutive repetitions is 1 meter (m). The length of the lines is 1.5 m; the interval between the seed holes is 0.3 m at a rate of 6 per row and the interval between two lines is 0.5 m. Seedlings are on a flat surface at a rate of one seed per seed hole. Three (3) border lines were sown around the experiment field with the NAMA variety for protection. The orientation of the experiment surface is East-West and the experiment started from the Northern part with the code 2 genotype.
Method to evaluate growth percentage on the 15th DAS and the survival rate
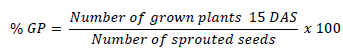
The growth percentage (% GP) was evaluated on the 15th DAS. The growth percentage per plot is the ratio between the number of plants that have grown and the number of seeds sown, reduced to 100 :
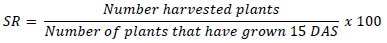
The survival rate (SR) of the plants of the different genotypes was evaluated at harvest. It corresponds to the ratio of the number of plants at harvest to the number of plants grown to 100.
Evaluation of Cercosporiosis diseases severity
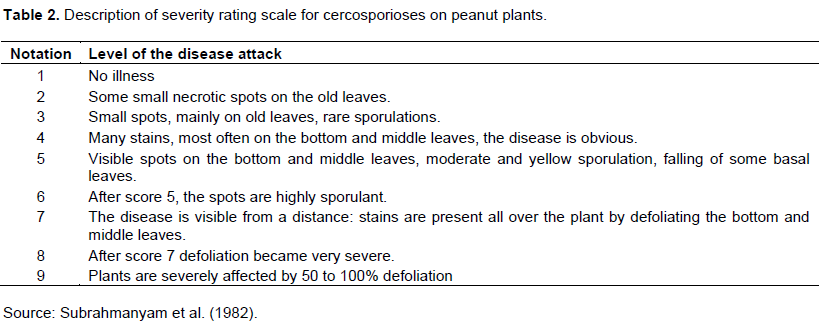
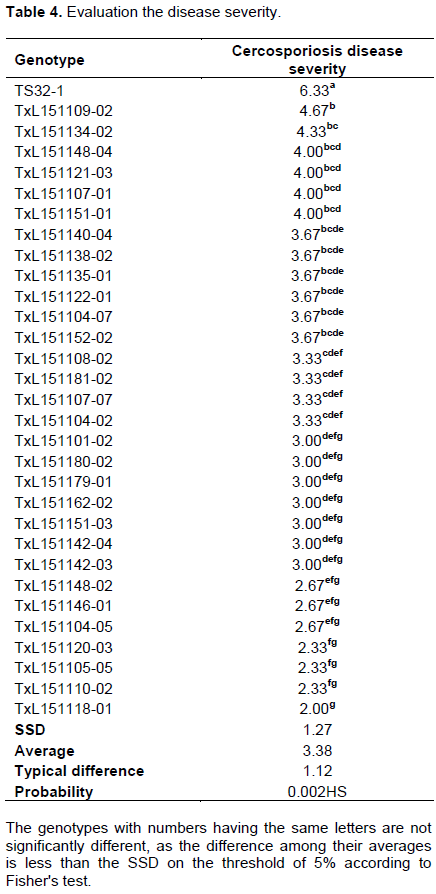
The scoring scale for Cercosporiosis disease used is that of ICRISAT proposed by Subrahmanyam et al. (1982) with 9 points. According to that scale, any genotype with a score between 1 and 3 is considered resistant, moderately resistant when the score is between 4 and 6 and sensitive for notes 7, 8 and 9 (Table 2).
Yield measure and yield components
For harvesting, the plants are manually uprooted plot after plot and then the pods are collected and dried in canvas bags for a month. The pods of each plot are then weighed using an electronic scale and the pod yields are evaluated in tonnes/ha (per plot).
Statistical analysis
The raw data was entered using the Excel 2010 software. The variance analysis uses the XLSTAT pro and Co-stat software. The averages are compared according to the FISHER test on the threshold of 5%.
Expression of results
The growth and survival rates were expressed in percentage (%) and the pod yield in tons per hectare (t/ha).
RESULTS
Growth and survival rate evaluation
The growth data on the 15th DAS and the survival rate at harvest are all shown in Table 3. The results show the best growth (77.77%) for the TS32-1 local genotype, followed by the genotypes TxL151108-02 and TxL151121-03 with respective percentages of 61.11 and 50%. The lowest growth (11.11%) was for genotype TxL151148-02. The averagee of all genotypes is 35.33%. The results of the variance analysis for this genotype showed a very highly significant difference among the genotypes.
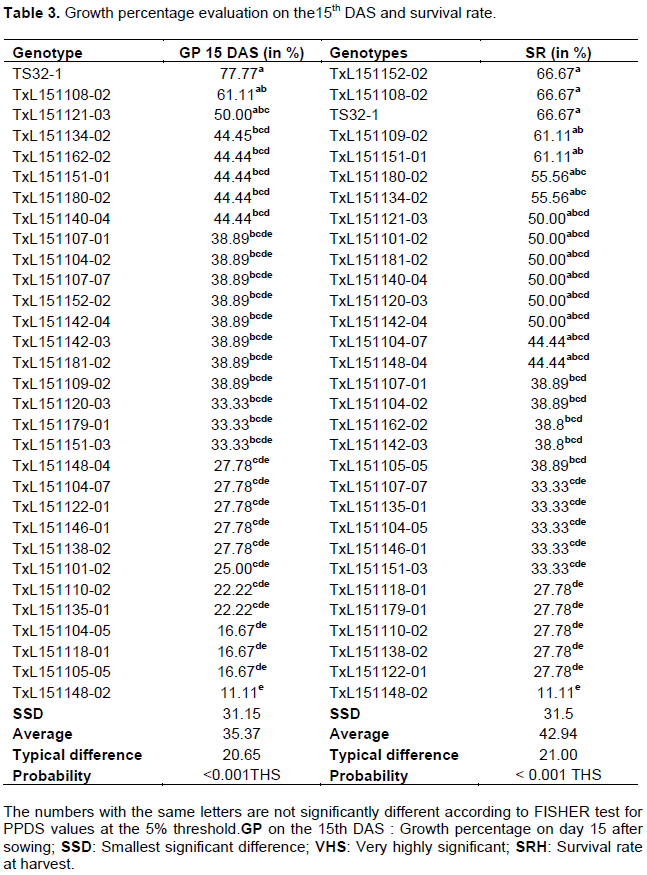
Regarding the number of plants at harvest, twelve (12) genotypes and the TS32-1 local genotype had survival rates greater than or equal to 50%. They are statistically equivalent with the letter '' a ''. As for the lowest survival rate, it was recorded by the genotype TxL151148-02 (11.11%). The average from the statistical analysis is 42.94%. This variance analysis for this genotype showed a very highly significant 5% difference among genotypes.
Assessment of Cercosporiosis severity
The data on Cercosporiosis severity are shown in Table 4. Cercosporiosis disease severity scores range from 2.00 to 6.33. The local genotype TS32-1 with the highest average (6.33 is followed by the genotypes TxL151109-02, TxL151134-02, TxL151148-04, TxL151121-03, TxL151107-01 and TxL151151-01 with notes between 4.67 and 4.0 and said to be moderately resistant. Except for these six genotypes, the remaining 24 others were found to be resistant to Cercosporiosis disease with scores averaging less or equal to 3.67. Variance analysis for this species revealed a highly significant difference among genotypes on the threshold of 5%. The evaluation of Cercosporiosis severity was based on the last rating. This scoring was based on the 9-point ICRISAT scale.
Yield evaluation
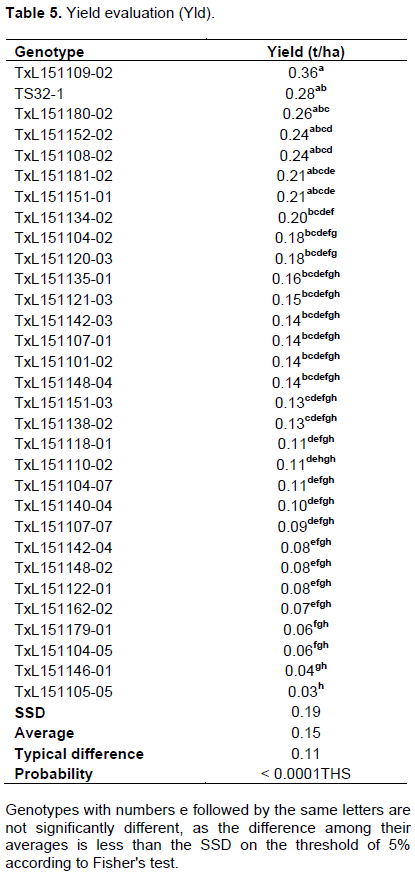
Table 5 shows yield data in t / ha. The yield in pods was on average 0.15 t/ha. Genotype TxL151109-02 showed the highest yield of 0.36 t/ha. However, it is statistically equivalent to the local genotype and to five (5) other genotypes, marked with the letter "a". Genotype TxL151105-05 had the lowest yield (0.03 t/ha). The variance analysis of average yields in tons/ha showed a very highly significant difference among genotypes on the threshold of 5%.
DISCUSSION
The seedling growth, density and survival rate were low with respective averages of 35.33%, 43.83 and 42.94%. These low rates would be due to low soil moisture as our seeds were sown after a light rain (11.8 mm) with a subsequent seven (7) day drought. Indeed, Nana (2015) stated that irregular rainfall could have a negative impact on seed germination. To this, it could be added the sowing depth parameter, which should not exceed five centimeters (5 cm) according to Gillier and Silvestre (1969). Under this conditions, it was difficult to control this depth as the sowing was manual. In addition, according to Subrahmanyam et al. (1982) these poor results could be explained by the biotic factors because some microorganisms such as Aspergillus niger, Aspergillus flavus, Macrophomina phaseolina, Sclerotium rolfsii, etc. could cause the seeds damping off.
The results of the 50% flowering date show that all genotypes have a grouped flowering (on average 1 to 6 days). These genotypes are interesting cases as they give a uniform pod maturation at harvest. In fact, the grouped-flowering genotypes would make it possible to avoid crop losses due either to the poor maturation of the nuts, or to the germination of some pods.
The impact of Cercosporiosis was relatively low with an average of 3.38. Of all genotypes, only the local geneotype TS32-1 scored above 6 and is said to be sensitive. Genotypes TxL151109-02, TxL151134-02, TxL151148-04, TxL151121-03, TxL151107-01 and TxL151151-01, on the other hand, were found to be moderately resistant with scores ranging from 4.67 to 4.00. Twenty-four (24) other genotypes were resistant to Cercosporiosis. The resistance of these genotypes could be explained by the presence of an additive gene that would control this resistance. In addition, Khedikar et al. (2010) reported that the genetic determinism of this resistance is polygenic and is probably controlled by several recessive genes. However other factors such as the low rainfall during the recent campaign in Gampela (677.3 mm and only 276.6 mm since the implementation of our tests) would be associated with this low impact of the disease (Directorate of the Experimention Station of Gampèla, 2017). In fact, the disease is favored by high humidity (around 95%) and temperatures from 25 to 30°C (Mc Donald et al., 1985). To this could be added the seedling density which was 30 cm between the seed holes contrary to 15 cm as adopted by Sawadogo (2017) which had a slightly higher average than that of this study which is 4.85 because Pande et al. (2002) reported that the severity of infection due to Cercosporiosis and peanut rust is favored by high plant densities.
The defoliation percentage averaged over 50%. Defoliation is a natural phenomenon related to leaf senescence and is worsened by factors such as Cercosporiosis attack and drought. In this case, defoliation would be on the one hand due to the sudden interruption of the rain in mid-September because Neya et al. (2013) who had experiemented a similar situation, pointed out that defoliation of peanut plants accelerates at the end of vegetation with drought situations. On the other hand, the defoliation of this study’s peanut plants would be related to the severity of Cercosporiosis. Indeed, the work by Abudulai et al. (2017) showed that there is a greater or lesser correlation between Cercosporiosis and groundnut defoliation. The yield was low with an average of 0.15 t/ha which is lower than those of Sawadogo (2017) and Sirima (2013) with satisfactory results in Gampèla with respectively 1.5 t/ha and 2.06 t/ha on average. This poor yield would be due to the poor rainfall during the experiment (276.6 mm), because according to Sankara (1997) peanut is a plant that needs to complete its cycle and have a rainfall included between 400 and 1200 mm. To this could be added the action of rodents such as squirrels, palm rats in the field and that of nocturnal rats during drying period. Barro (2017) made the same observation. Considering the thirty (30) peanut genotypes used, it can be said that the best yields were obtained by the genotypes TxL151109-02 (0.36 t/ha) and TS32 -1 (0.28 t/ha) which are respectively moderately resistant and susceptible to Cercosporiosis. This performance could be explained on the one hand by the intrinsic capacity of these genotypes susceptible to resist to the disease and on the other hand these genotypes might manage to complete their cycles before the disease occurs. Indeed, Zongo (2015) showed in his work that productivity is not correlated with genotypes resistance to Cercosporiosis but rather with the duration of their cycle.
CONCLUSION
This study has highlighted the adaptability of thirty (30) genotypes from Texas (U.S.A) compared with a local genotype in the Sudano-Sahelian conditions of Burkina Faso (Gampela). At the end of the study, several variables were determined, including the resistance of these genotypes to foliar diseases, namely Cercosporiosis, and their yield in tons/ha. In short it can be said that despite the environmental conditions, the 30 genotypes from Texas have performed well even if the yield was average due to lack of good rainfall. It would therefore be interesting to repeat these experimentts for at least two successive years before popularizing these peanut genotypes.
CONFLICT OF INTERESTS
The authors have not declared any conflict of interests.
ACKNOWLEDGMENTS
The authors sincerely thank the PMIL project (Peanut Micotoxin Innovation Laboratory) for all its research to improve groundnut production.
REFERENCES
|
Abudulai M, Naab J, Seini SS, Dzomeku I, Boote K, Brandenburg R, Jordan D (2017). Peanut (Arachis hypogaea L.) response to weed and disease management in northern Ghana, International Journal of Pest Management 64(3):204-209. |
|
|
Barro S (2017). Evaluation au Burkina Faso des Performances agronomiques de génotypes d'arachide en essai régional (Burkina-Ghana-Sénégal) Mémoires de fin d'étude, Université Ouaga 1 PJKZ, 03 BP. 7021 Ouagadougou 03, UFR/SVT 82 p. |
|
|
DGESS (2017). Rapport des résultats définitifs de la campagne agricole 2016/2017 et des perspectives de la situation alimentaire et nutritionnelle. Ministère de l'agriculture et des aménagements hydrauliques 03 BP: 7005 Ouagadougou 03, Burkina Faso. |
|
|
Food and Agriculture Organization (FAO) (2013). Analyse des incitations et pénalisations pour l'arachide au Burkina faso.37 p |
|
|
Fletcher S, Nadolnyak D (2006). Strategic Behavior and Trade in Agricultural Commodities B-Competition in World Peanut Markets. In: 2006 Annual Meeting, August 12-18, 2006, Queensland, Australia 15 p. |
|
|
Gillier P, Silvestre P (1969). L'arachide. G. P. Maisonneuve et Larose, Paris 292 p. |
|
|
Khedikar YP, Gowda MVC, Sarvamangala C, Patgar KV, Upadhyaya HD, Varshney RK (2010). A QTL study on late leaf spot and rust revealed one major QTL for molecular breeding for rust resistance in groundnut (Arachis hypogaea L.). Theoretical and Applied Genetics. 121:971Ŕ984. |
|
|
Mc Donald D, Subrahmanyam P, Gibbons RW, Smith DH (1985). Early and late leaf spots of groundnut, International Crops Research Institute for the Semi-Arid Tropics, ICRISAT Information Bulletin no. 21, 28 p. |
|
|
Nana TA (2015). Etude préliminaire pour une approche de lutte intégrée contre les maladies foliaires de l'arachide (Arachis hypogaea L.) au Burkina Faso. Mémoire de fin d'étude, UFR/SVT, Université de Ouagadougou BP 7021, 79 p. |
|
|
Neya FB, Koïta K, Zagré MB, Nana AT, Burow MD, Sankara P, Simpson C (2013). Evaluation au champ de la performance de quelques lignées d'arachide (Arachis hypogaea L.) à grosses graines pour la résistance aux cercosporioses de l'arachide dans la zone centre du Burkina Faso de 2010 à 2012. Annale de l'Université de Ouagadougou, R Série C, vol. 009. |
|
|
Pande S, Narayana RJ (2002). Effect of Plant Population Densities on the Severity of Late Leaf Spot and Rust of Groundnut, International Crops Research Institute for the Semi-Arid Tropics (ICRISAT), The Plant Pathology Journal Patancheru 502324, Andhra Pradesh, India 8 p. |
|
|
Sankara P (1997). Evaluation des performances agronomiques et de la résistance à la rouille de génotypes d'arachide pour la création d'un idéotype au Burkina Faso. Thèse d'Etat, FAST, Université de Ouagadougou, 03 BP 7021, 219 p. |
|
|
Sawadogo RB (2017). Evaluation des performances de génotypes d'arachide (Arachis hypogaea L.) issues de la collection de l'ICRISAT en Inde, Mémoire de Master, Université Ouaga1 PJK, 03 BP:7021 Ouagadougou 03, UFR/SVT 71 p. |
|
|
Sirima A (2013). Evaluation de génotypes d'arachide (Arachis hypogaea L.) d'origine américaine pour la résistance à la cercosporiose dans deux localités du Burkina Faso: Gampèla et Farako-Bá. Mémoires de fin d'étude, Université de Ouagadougou, 03 BP 7021 Ouagadougou, UFR-SVT 77 p. |
|
|
Subrahmanyam P, Mc Donald D, Gibbons RW, Nigam SN, Nevill DJ (1982). Resistance to rust and late leaf spot disease in some genotypes of Arachis hypogaea L. Peanut Science 9: 6-10. |
|
|
Thiombiano A, Kampmann D (2010). Atlas de la biodiversité de l'Afrique de l'Ouest, Tome II: Ouaga. Burkina Faso-Frankfurt/Main, ISBN978-3-9813933-0-9. 625 p. |
|
|
USDA (2018). World Agricultural Production. Circular Series WAP 07-17; 29 p |
|
|
Zongo A (2015). Analyse génétique et identification de marqueurs moléculaires SSR associés à la résistance à la cercosporiose précoce de l'arachide (Arachis hypogaea L.), Thèse de doctorat unique, Université de Ouagadougou, 03 BP 7021 Ouagadougou UFR/SVT 169 p. |
|
Copyright © 2024 Author(s) retain the copyright of this article.
This article is published under the terms of the Creative Commons Attribution License 4.0


