Full Length Research Paper

ABSTRACT
The Tax Cuts and Jobs Act (TCJA), effective on December 22, 2017, is the most comprehensive overhaul of the U.S. tax code in the last 30 years. Historically, when corporate tax rates are high, the interest deduction on debt is greater, thereby reducing firms’ taxable income. However, with the new reforms significantly reducing corporate tax rates, the deductibility of the interest is no longer as favorable. In this paper, the effect of the TCJA on corporate debt ratios is analyzed. The authors hypothesize that corporate debt ratios have decreased since the passage of the TCJA. The results of the paper support our hypothesis that the long-term debt ratio is significantly negatively related to the implementation of the TCJA.
Key words: Tax cuts and jobs act; corporate tax; debt ratio; short-term debt; long-term debt.
INTRODUCTION
The Tax Cuts and Jobs Act (TCJA), which went into effect on December 22, 2017, reduced the top corporate tax rate from 35 to 21%, the largest cut in 30 years. In the United States, interest expenses are deductible for corporate tax purposes, while dividends must be paid out of after-tax corporate income. Therefore, the tax system favors debt financing over equity financing. The passage of the TCJA reduces the advantages of using debt to reduce taxes by lowering the overall corporate tax rate.
Meanwhile, the large amount of corporate debt has raised the attention of top U.S. regulators. As Jay Clayton, chairman of the Securities and Exchange Commission (SEC), pointed out, “In the United States, outstanding corporate debt stands at almost $10 trillion, almost 50% of GDP.” “Those are numbers that should attract our attention” (Johnson, 2019). Therefore, it has become imperative to study how TCJA may affect the corporate debt policy.
Prior studies have discussed the question of whether taxes affect corporate financing decisions. Early papers such as Ang and Peterson (1986), Titman and Wessels (1988), and Fischer et al. (1989) all failed to find significant tax effects.
Later studies, such as Givoly et al. (1992) found a significant negative relation between leverage and corporate tax rate. Graham (1999) documented that firms with high tax rates have relatively high levels of debt. Gordon and Lee (2001) found that firms in the highest tax bracket have more debt than firms in the lowest tax bracket. However, none of the tax rates tested in prior studies was at the scales as regulated by TCJA.
LITERATURE REVIEW
Tax cuts and jobs act of 2017
The prototype of the U.S. corporate tax system debuted in 1894 (The Revenue Act of 1894). Various tax policies have had more or fewer amendments to the corporate tax laws since then. The current Code of Laws of the United States incorporates the corporate tax laws into Title 26, the Internal Revenue Code, formally the Internal Revenue Code of 1986, which is part of the Tax Reform Act of 1986 (TRA).
President George W. Bush made some changes to the Code's provisions in his Economic Growth and Tax Relief Reconciliation Act of 2001 and Jobs and Growth Tax Relief Reconciliation Act of 2003. Many provisions are related to individual taxes. For the corporate tax, only certain deductions were added or removed. Later, President Obama extended most of the Bush tax cuts in the 2010 Tax Relief Act and the American Taxpayer Relief Act of 2012. However, no major changes in the corporate tax rate have been made for nearly 30 years until the TCJA, which became effective, starting in 2018 (Tax Policy Center, 2022).
For individual taxes, TCJA only makes minor cuts, and the benefits will expire in 2025. However, for corporate taxes, the Act substantially decreases the top rate from 35 to 21%, and such change is made permanent.
Before the passing of the TCJA in December 2017, the U.S. has one of the highest corporate income tax rates among the Organization for Economic Co-operation and Development (OECD) economies (OECD, 2017). The model of Fehr et al. (2013) showed that capital favors low corporate tax countries. Therefore, in theory, TCJA should reduce incentives for businesses to move their tax base to low-tax jurisdictions and make the U.S. a more attractive location for foreign capital. The inflow of investment will also bring more job opportunities and households' income.
According to The White House (2019), TCJA has shown significant economic impacts, including an increase in GDP growth rate, higher business investment levels, increase in wage and salary income for households. Gale et al. (2018) summarized the five major consequences of TCJA: 1). Boost the economy in the short term but has little effect on long-term growth; 2). Reduce federal income; 3). Enlarge inequality in the distribution of after-tax income; 4). Simplify the tax filing process in some ways but generate new complexities in others; 5). Reduce coverage of health care and charitable donations.
Empirical studies on how TCJA affects each individual, and society as a whole found mixed results. Page et al. (2017) did a macroeconomic analysis of TCJA and found that the law will raise the US GDP by 0.8% in 2018 and have no impact on GDP in 2027 or 2037. The resulting rise in taxable income will minimize revenue loss resulting from the Act from 2018 to 2027 by $186 billion (around 13%).
In terms of the stock market reaction to the TCJA, Wagner et al. (2018) found that stocks' prices responded to the difference between the original and revised expectations. High-tax companies benefited substantially from the bill's introduction in the United States House of Representatives to the final passage (November 2 to December 22, 2017).
However, because of the one-time repatriation tax on profits in overseas subsidiaries required by the TCJA, multinationals suffered significantly. Overall, the stock price movements show that the market reacted positively to lower expected corporate taxes.
Rader (2020) evaluated the direct and indirect effect of TCJA on the U.S. real estate market and concluded that although TCJA has a negative impact on high tax states; it pushed asset markets to new highs, generating a demographic change that may have future political implications. The paper also discussed the creation of opportunity zones, which is part of the TCJA. The main finding is that the opportunity zones program has positive intentions but lacks sufficient accountability measurements.
Because TCJA drastically reduced the corporate income tax rate, it encouraged firms to increase their pension contributions in 2017, the year before TCJA became effective, to take advantage of tax deductions at a higher rate.
Gaertner et al. (2018) found that firms raised their defined benefit pension contributions by an average of 27% in 2017 relative to previous years. Firms with high deferred tax assets increased four times more than firms with low deferred tax asset levels. In addition, firms with more financial reporting pressure drive the result.
Besides reducing the corporate income tax rate, TCJA also limited interest deductibility for certain firms. Yu (2020) argue that this element of the reform will likely destroy horizontal equity and economic neutrality. This is because limiting the amount of interest expense that corporations can deduct while allowing the entire lease expense or cost of goods sold to be deducted would be unfair to firms financing themselves through debt than through leasing. If a corporation needs to acquire equipment, it should be indifferent between borrowing money to purchase the equipment or leasing it. Carrizosa et al. (2020) find that 257 U.S. firms are affected by the limited interest deductibility component of TCJA, and these firms decrease book leverage by 2.9% of total assets. To increase the generalizability of this paper, our paper focuses on the overall impact of the corporate income tax rate reduction of TCJA, including firms that are subject to interest deductibility limitations.
Debt ratios
A company's debt ratio shows whether it has loans and how its credit financing is compared to its assets. The basic form of debt ratio is calculated as dividing total debt by total assets. Higher debt ratios suggest higher degrees of debt financing and greater risk associated with firms' operations because debt ultimately needs to be repaid with interest.
Debt ratios are used to describe a company's financial health. However, there is no clear indicator of how much the debt ratio is good or bad. It depends on the company's industrial sector, size, and development stage.
Prior research regarding corporate debt ratios investigated what factors may affect debt ratios and how debt ratios further affect a company's operation.
Stiglitz (1972) used mathematical models to show that firms with a high possibility of bankruptcy may choose a low debt-equity ratio to avoid failures. In the paper, he also mentioned that some take-overs and mergers should be included in the same category as bankruptcy because those methods of disappearance have lower costs than actual bankruptcy.
Kim and Sorensen (1986) examined several determinants of debt ratios. They used long-term debt divided by total capitalization in book value as a measure of debt. They concluded that firms whose equity ownership is concentrated among insiders make more use of debt than firms that are owned by many shareholders. That is easy to understand because debt will not dilute insiders' control of the firm. They also documented several factors, such as growth rate and operating risk that may affect firms' debt usage.
McConnell and Servaes (1995) empirically investigated the relation between firms’ value and leverage. They used total debt divided by total assets to measure leverage and found that the relationship depends on growth levels. For high-growth firms, firm value is negatively correlated with leverage, whereas for low-growth firms, corporate value is positively correlated with leverage.
Aivazian et al. (2005) used information on Canadian publicly traded firms to analyze the effect of financial leverage on firms' investment decisions. Their measure of financial leverage is the book value of total liabilities divided by the book value of total assets. The result shows that leverage is negatively related to investment. For companies with low growth opportunities, this negative impact is significantly greater than for those with high growth penitential.
D'Mello et al. (2018) examined shareholders' views of corporate debt. They found that U.S. companies’ shareholders value an extra dollar in long-term debt to be-$0.28 on firms' value between 1980 and 2014. This indicates that American investors believe the cost of increasing debt exceeds the benefits and companies are overleveraged.
Firms' choices of debt ratios are affected by many factors. Although debt is considered to be the lowest cost source of capital, excessive borrowing can lead to bankruptcy risks.
Contribution to literature
To empirically test how TCJA affects firms' debt policies, this paper analyzes the data from WRDS firm-level Financial Ratios Suite and COMPUSTAT right before and after the passage of TCJA. A binary variable was created, "new_policy", coded with a value of 1 if the data are in 2018 and 0 if in 2017. The authors first run the univariate tests to check the correlations. The total debt ratio and the long-term debt ratios are negatively related to new_policy at the 5% level, supporting their hypotheses.
Multivariate analyses were then run by adding other factors that affect firms' borrowing into the regression models. The correlation between new_policy and long-term debt ratio is consistently negative. However, the authors did not find a negative relation between the new_policy dummy and the total debt ratio or the short-term debt ratio. Liabilities instead of debt were used to construct the dependent variables; the same results were found. This paper contributes to the literature in the following ways:
First, several debt ratios were examined. Besides the total ratio, which is extensively studied, the authors also investigated how firms' use of short- and long-term debts is affected by TCJA. This paper enriches the literature on how tax-cut effects shape short- vs. long-term debt ratios.
Second, the empirical literature on corporate debt choice has so far not been very successful in identifying the importance of the tax advantage of debt (Huizinga et al., 2008). This study examines the issue in the new policy context and shows that overall; the tax cut reduced firms' use of long-term debt.
Finally, our study adds to the debate about whether TCJA is good or bad for society. We show that companies, in general, react to the policy by reducing their debts for the tax-shield purpose, which may reduce firms' risk in the long run.
The remainder of the paper is organized as follows. Section 2 presents the study hypotheses. Section 3 describes the data and methodology; Section 4 discusses empirical results, and Section 5 concludes.
Hypothesis development
Companies generally have two ways to raise funds: one is to borrow money, and the other is to issue stocks. In the United States, debt has an advantage over equity capital because payments to debt holders are deductible for corporate tax purposes. In contrast, payments to shareholders, that is, dividends, have to be paid out of net-of-tax corporate income.
As mentioned earlier, the biggest tax cut before 2017 is the TRA of 1986, which reduced the top corporate tax rate from 46 to 34%. Givoly et al. (1992) examined the relationship between leverage and tax-related variables for a sample of U.S. firms in the years surrounding the passage of the TRA. Leverage is defined in the paper as the ratio of debt to the sum of debt and equity. Their major finding is that the corporate tax rate is negatively and significantly related to the leverage ratio.
In addition, before the enactment of the TCJA, the U.S. tax system used a tiered tax rate ranging from 15% to as high as 35%. Because of the difference in incorporate tax rates, Gordon and Lee (2001) found that the largest firms with a 35% tax rate have 8% more debt than smaller firms whose tax rate is only 15%. Graham et al. (1998) found a similar result that there is a positive relationship between debt levels and tax rates.
Studies in other countries also show a positive correlation between debt usage and taxes. For example, Shum (1996) tested the corporate debt policy in Canada from 1979 to1989 and found that the use of debt increases when the tax is higher. By examining firms in 39 developed and developing countries, Fan et al. (2012) found that firms tend to use more debt in countries where the corporate tax rates are higher. De and Nigro (2012) investigated the relation between debt and tax in a European context. Their results suggest that corporate income taxation is positively related to leverage. They defined leverage as the ratio of debt to the sum of debt and equity.
As can been seen, prior literature suggests that when tax rates are high, firms borrow money and pay interest on debts to reduce their taxable incomes. However, TCJA lowered the maximum corporate tax rate from 35 to 21%, and the tax deductibility of the interest is no longer as favorable. Therefore, we made our first hypothesis:
H1: Compared to 2017, there is a significant total debt ratio reduction in 2018 after implementing the TCJA
Debt maturity is an important part of a company's financial policy. For most companies, the question is not only how much debt, but also how long will the debt become due. In accounting, total debt is classified into long-term and short-term debt. Short-term debt is payable within one year, while long-term debt has a maturity longer than that.
Generally, short-term debt is used to make up temporary shortfalls in cash flow. Interest rates on short-term debt are lower than rates for long-term debt because lenders require a higher premium for taking more risks since payments are extended for several years. Firms are less likely to use short-term debt to avoid taxes because of the low interest rate and the primary purpose of temporarily alleviating the current cash flow problem. Thus, we have the following hypothesis:
H2: Compared to 2017, there is no significant short-term debt ratio reduction in 2018 after implementing the TCJA
On the other hand, firms pay a higher interest rate on the long-term debt, and they may use the long-term debt for things other than solving the short-term cash flow issue. This makes the long-term debt a perfect instrument to reduce taxes. Such usage may be discouraged because of TCJA. The argument leads to our last hypothesis:
H3: Compared to 2017, there is a significant long-term debt ratio reduction in 2018 after implementing the TCJA
DATA AND METHODOLOGY
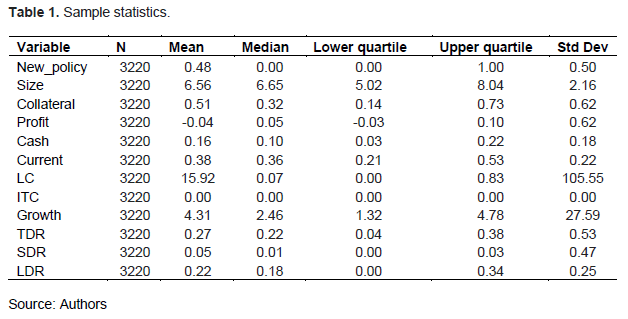
Debt ratios are extracted from WRDS firm-level Financial Ratios Suite. Some ratios were also calculated using the data from COMPUSTAT if they are not available in the Financial Ratios Suite. COMPUSTAT data contain companies from the NYSE, NYSE American, NASDAQ, and NYSE Arca exchanges. The authors deleted those firms, with debt ratios (total debt/total assets), larger than one because they have negative equity. To avoid results driven by outliers, all numerical data are trimmed at the 1% level. The final sample consists of 3,220 firm-year observations which include 1853 distinct firms from 55 industries classified by the two-digit SIC code. The large number of industry classifications included in this study suggests that the sample is a good representation of the population. The summary statistics of the sample is presented in Table 1.
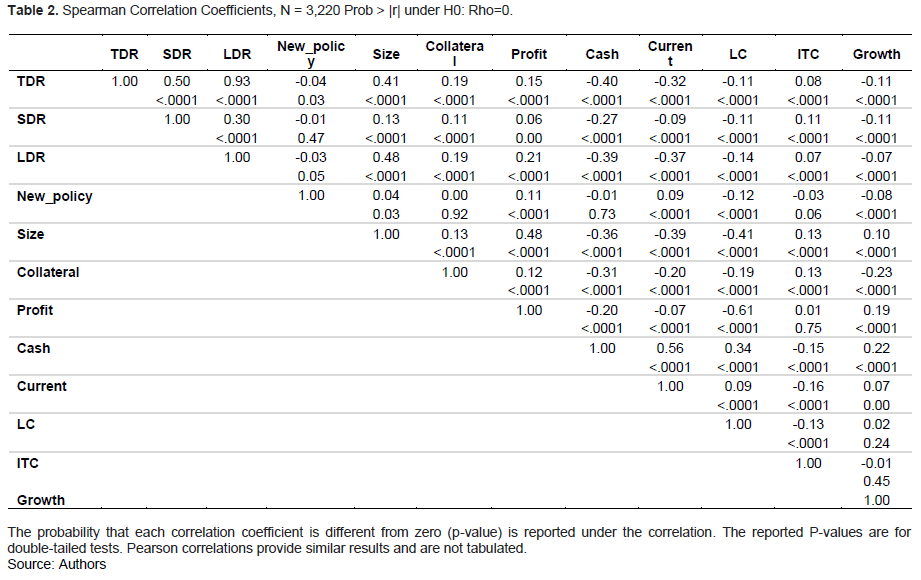
To investigate how corporate choices of debt ratios are affected by the TCJA, a binary variable, new_policy was created. It is coded with a value of 1 if the data are in the year 2018 and 0 if in 2017. We expect to see a negative correlation between new_policy and the debt ratio. Run univariate test was first used to check the correlations. The results are tabulated in Table 2.
Prior research documents several factors that affect a firm's debt policy. To control the impact of those variables, we then run multivariate regression models to test the relation between new_policy and debt ratios.
First, large firms have lower costs of financial distress and suffer lower information costs associated with borrowing (Graham, 1999). The natural logarithm of total assets was used as the proxy for firm size. Second, a firm with extensive collateral should use more lease financing and is more likely to borrow on favorable terms (Graham et al., 1998; Huizinga et al., 2008). In this paper, collateral is defined as the ratio of net property, plant, and equipment divided by total assets. Third, more profitable firms have better access to the credit market. Following Krämer (2015), we measure profitability as the ratio of earnings before interest and taxes to total assets. Fourth, Longstaff and Strebulaev (2014) documented that liquidity affects debt ratios. Illiquid firms face higher borrowing costs. Therefore, the cash and current ratios in the model were included. The cash ratio is the ratio of cash to total assets. The current ratio is the ratio of current assets to total assets, where current assets include cash, accounts receivable, and inventories. Fifth, MacKie-Mason (1988) used tax loss carry forward and investment tax credit to capture other tax effects on corporate financing decisions.
We also include these two variables in the study. Moreover, growth has been documented to affect debt ratio (McConnell and Servaes, 1995; Aivazian et al., 2005). As suggested in Rajan et al. (1995), Market-to-Book (MB) ratio was used to measure growth opportunities. Finally, to control the industry fixed effects, two-digit industry dummies are included in the model.
The following multiple regression model was used to observe the statistical significance of new_policy and other control variables on debt ratios.
TDR = α + β1 New_policy+ β2Size+ β3Collateral+ β4Profit+ β5Cash+ β6Current+ β7LC + β8ITC+ β9Growth + ∑βkIND + ε (1)
Where:
TDR = Total debt ratio, calculated as total debt divided by total assets (DLC+DLTT/AT); New_policy = 1 if the data are in the year 2018 and 0 if in 2017; Size = The natural logarithm of total assets (AT); Collateral= The ratio of net property, plant, and equipment divided by total assets (PPEGT/AT); Profit = The ratio of earnings before interest and taxes to total assets (EBIT/AT); Cash = The ratio of cash to total assets (CHE/AT); Current = The ratio of current assets to total assets, where current assets include cash, accounts receivable, and inventories (ACT/AT); LC = Tax loss carry forward divided by net sales (TLCF/ SALE); ITC = Investment tax credits divided by net sales (ITCB/SALE); Growth = Market value of equity to book value of equity (CEQ/PRCC_C*CSHO); IND = 2-digit industry dummies.
Under H1, we expect the sign of the coefficient on new_policy to be negative, indicating that overall, firms’ total debt ratios in 2018 were lower than that in 2017.
The authors repeat regression (1) using SDR and LDR each as the dependent variable. All the control variables remain the same.
Where:
SDR = Short-term debt ratio, calculated as short-term debt divided by total assets (DLC/AT); LDR = Long-term debt ratio, calculated as long-term debt divided by total assets (DLTT/AT). Compustat variable names are reported in parentheses.
If H2 and H3 hold true, we should see no significant coefficient on new_policy when SDR is used as the dependent variable, but a significant negative coefficient on new_policy when we use LDR as the dependent variable.
RESULTS AND DISCUSSION
Table 1 reports the summary statistics of data. There are 3,220 observations with non-missing values for both dependent and control variables. The mean of new_policy is 0.48, which means that 48% of observations are in 2018, after the enactment of TCJA. The average natural logarithm of firms' total assets is 6.56. The mean of Collateral shows that, on average, sample firms have 51% of their total assets to be net property, plant, and equipment. The mean profit of -0.04 indicates a loss. The average cash ratio is 0.16, while the average current ratio is 0.38. The sample firms have a positive book tax loss carry forward. However, they do not seem to have investment tax credits. The average MB ratio is 4.31. The sample firms have an average total debt ratio of 27%, consisting of a 5% short-term debt ratio and a 22% long-term debt ratio.
Table 2 shows the Spearman correlation coefficients. As predicted, new_policy is negatively correlated with TDR at 5% significance level (correlation coefficient =-0.04 and p-value =0.03), which indicates that the total debt ratio is reduced after the new policy was passed. The correlation coefficient between new_policy and SDR is -0.01. However, this relation is not significant (p-value =0.47). The correlation between the long-term debt ratio and new_policy is significant at 5% level (correlation coefficient=-0.03 and p-value= 0.05). The correlation coefficients support our hypothesis that compared to 2017, there is a significant total or long-term debt ratio reduction overall in 2018 after the implementation of TCJA (H1 and H3). For the short-term debt ratio, there is no significant reduction (H2).
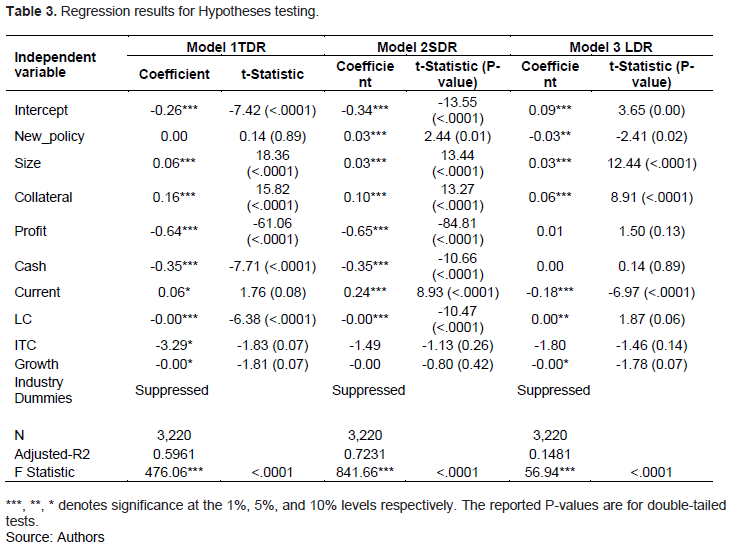
The results of the multivariate analysis are presented in Table 3. Model 1 through Model 3 provides regression results using TDR, SDR, and LDR as the dependent variable, respectively. For Model 1, when controlling for other variables that affect companies' debt policies, the coefficient on our primary variable of interest, new_policy, is no longer significant (coefficient =0.00 and p-value =0.89). Total debt can be divided into short-term and long-term debts. When we analyze the multivariate models of short-term and long-term debt ratios separately, it was found that there is a significant positive relation between new_policy and SDR. This result is contrary to expectations. However, when we look at the model for long-term debt ratio, we see a significant negative relation between LDR and new_policy (coefficient =-0.03 and p-value =0.02), which supports our H3.
Taken together, the insignificant result of the total debt ratio appears to be driven by the positive correlation of short-term debt. Short-term debt is increased if other factors that affect borrowing are controlled for. This result is not surprising given the fact that long-term debt decreased because the benefit of the interest tax deduction diminished after the TCJA. Instead, firms may choose short-term loans with lower interest rates to meet their cash needs. Table 3 also shows several significant control variable coefficients. Consistent with Graham (1999), size is positively related to debt ratios because larger firms easily borrow money. Collateral also has a positive sign. According to Huizinga et al. (2008), a firm with extensive collateral can borrow on favorable terms. Both Profit and Cash are negatively related to debt ratios, suggesting that profitable firms and firms with more cash in hand have fewer loans.
Firms with higher current ratios borrow more short-term debts but less long-term debts, which is consistent with the notion that firms attempt to match the maturities of their assets and liabilities (Myers, 1977). Loss carry forward deduction is negatively related to debt ratios, indicating that firms may use different tax deductions as a substitution.
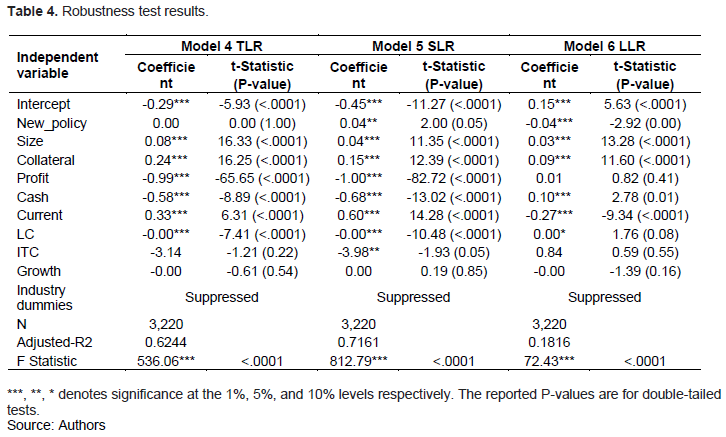
Besides using debt, many researchers have used liabilities as the numerator when calculating debt ratios (Aivazian et al., 2005; Longstaff and Strebulaev, 2014). To assess the robustness of the authors’ results, they also use a second measure of debt ratios. TLR, SLR, and LLR are used as the dependent variable to run regression (1).
Where:
TLR = Total liabilities divided by total assets (LT/AT); SLR = Short-term liabilities divided by total assets (LCT/AT); LLR = Long-term liabilities divided by total assets ((LT-LCT)/AT). Compustat variable names are reported in parentheses.
The results are reported in Table 4. New_policy is not significantly related to TLR at any significance level. But it is positively related to SLR at the 5% significance level and negatively related to LLR at the 1% significance level. This finding corroborates our earlier results in Table 3 where we find no significant coefficient for total debt ratio, but a positive and a negative coefficient for short-term debt ratio and long-term debt ratio, respectively. We verify that our reached results are not driven by the way debt ratios are calculated. The multivariate analysis supports H3, but not H1 and H2.
Additional analyses
The research objective in this study is to test whether TCJA’s corporate tax policy has positive effects on firms in general. All the hypotheses are supported. The next question we may ask is whether this new policy is effective at the individual firm level. To test how the changes in debt ratios for the same firms are affected by the TCJA, we calculate the two-year average debt ratio changes before and after the new policy and use the variables as the dependent variables in the regression analyses. The authors’ new sample period is from 2014 to 2019. They include the years 2014 and 2015 to calculate the changes in debt ratios before the TCJA.
Following Graham and Tucker (2006) and Platikanova (2017), a few more control variables in the regression models were included. Cashflow and ROA are used as proxies for liquidity risk which affects borrowers’ preference for short-term debt. Dividend distributions, capital expenditures, and R and D expenses are used to control firms’ investment opportunities which affect firms’ financing decisions. Firms' propensity to use debt and their potential to engage in tax evasion are likely to be influenced by foreign activities and intangible assets. We also control these two variables.
In addition, the presence of net operating losses before TCJA was used as a proxy for low marginal tax rates (MTRs). We then interact MTRs with New_policy. It was expected that the coefficient on the interaction would be opposite to the sign on New_policy because firms with low pre-TCJA MTRs were likely affected less by the corporate tax rate change since they already faced lower tax rates than companies with higher pre-TCJA MTRs.
There are two approaches for managers to lower companies’ debt ratios. The first way is to buy back their debt on the open market. Second, increasing retained earnings while maintaining the same level of debt can also reduce debt ratios.
Therefore, we included retained earnings as a control variable to test whether increased retained earnings can be a reason for the changes in debt ratios.
Since short-term debt ratios are typically influenced by net working capital needs, a matching of assets and liabilities was included in the working capital as a control variable in the short-term debt ratio model. On the other hand, long-term debt ratios are typically influenced by investments in long-term fixed assets. Investments in long-term fixed assets should be included as a control variable in the long-term debt ratio model. However, the proxy for collateral is calculated using the long-term fixed asset data and can serve the same purpose.
The following new multiple regression models were used to test the new policy’s effects at the individual firm level:
ΔTDR = α + β1 New_policy+ β2Size+ β3Collateral+β4WC + β5Profit+ β6Cash+ β7Current+ β8 Growth + β9DIV + β10ROA+ β11CASHFLOWS+ β12EXPENDITURE + β13FOREIGN+ β14INTANGIBLES+ β15RD + β16LMTR + β17New_policy*LMTR + β18RE+∑βkIND + ε (2)
ΔSDR = α + β1 New_policy+ β2Size+ β3WC+ β4Profit+ β5Cash+ β6Current+ β7 Growth + β8DIV + β9ROA+ β10 CASHFLOWS+ β11 EXPENDITURE + β12 FOREIGN+ β13INTANGIBLES+ β14 RD + β15LMTR + β16 New_policy*LMTR +β17RE+∑βkIND + ε (3)
ΔLDR = α + β1 New_policy+ β2Size+ β3Collateral+ β4Profit+ β5Cash+ β6Current+ β7 Growth + β8DIV + β9ROA+ β10 CASHFLOWS+ β11 EXPENDITURE + β12 FOREIGN+ β13INTANGIBLES+ β14 RD + β15LMTR + β16 New_policy*LMTR + β17RE +∑βkIND + ε (4)
Where:
ΔTDR = Two-year average total debt ratio changes before and after the new policy; ΔSDR = Two-year average short-term debt ratio changes before and after the new policy; ΔLDR = Two-year average long-term debt ratio changes before and after the new policy; WC = Working capital, calculated as current assets (ACT) minus current liabilities (LCT), scaled by total assets (AT); DIV = 1 if a firm pays dividends (DVC), and 0 otherwise; ROA = Earnings before interest, taxes, depreciation, and amortization (EBITDA) to total assets (AT); CASHFLOWS = Income before extraordinary items (IBADJ) plus depreciation (DP) to total assets (AT); EXPENDITURE = Capital expenditures (CAPX) to total assets (AT); FOREIGN = Foreign pre-tax income (PIFO) to total assets (AT); INTANGIBLES = Intangible assets (INTAN) to total assets (AT); RD = Research and development expenditures (XRD) to total assets (AT); LMTR = 1 if a firm has tax loss carryforward (TLCF) in 2017, and 0 otherwise; RE = Retained earnings (RE) to total assets (AT). Compustat variable names are reported in parentheses.
All other variables are defined the same as in regression (1). LC is dropped from the model because we use the same variable to define LMTR. ITC is also dropped because only a small number of exceptional credits provided by foreign jurisdictions or some old ITC carryovers are included within the sample period of this study.
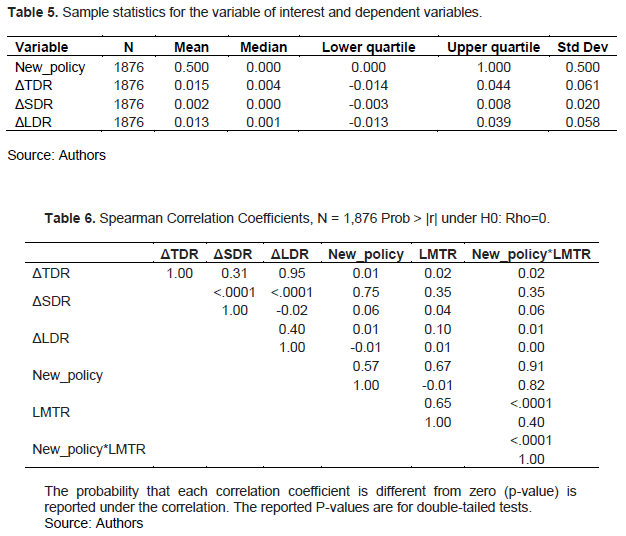
Table 5 reports the sample statistics for the variable of interest and dependent variables. The authors deleted any firm years with missing values of dependent and control variables. Our final sample consists of 1876 firm-year observations with 938 distinct firms. As we can see, the mean and median changes in debt ratios are all very tiny, compared to the absolute value of debt ratios in Table 1.
Spearman correlation coefficients are reported in Table 6. Pearson correlations provide similar results and are not tabulated. In terms of changes in debt ratios, New_policy is not significantly related to either the change in the total debt ratio or the change in the long-term debt ratio. However, the sign of the correlation coefficient on the change in the long-term debt ratio is negative as we expected. The insignificance may be because the changes, in contrast to absolute values, are very small numbers, making it challenging to detect a clear association. Same as the previous tests, new_policy is significantly and positively related to the change in the short-term debt ratio.
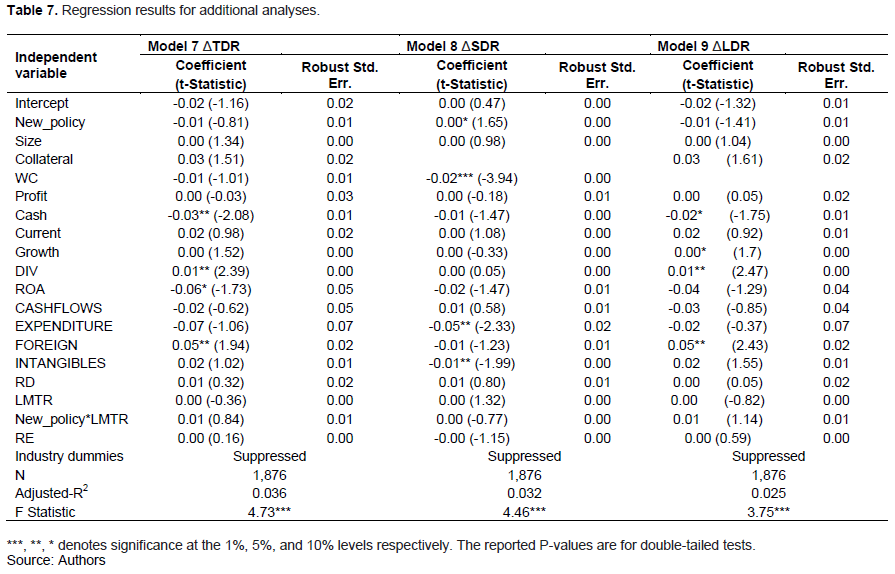
The results of the multivariate analysis for the changes in debt ratios are presented in Table 7. When we control the factors that may affect firms’ financing decisions, the coefficients on New_policy are negative as expected, but not significant for the change in total debt ratio (t-Statistic= -0.81) and the change in long-term debt ratio (t- Statistic= -1.41). A significant and positive coefficient on New_policy for the change in the short-term debt ratio is still seen.
In terms of the control variables, collateral, measured by using long-term fixed assets, has a positive effect on the change in the long-term debt ratio. However, this coefficient is not significant. On the other hand, the working capital variable (WC) has a significant and negative coefficient in the ΔSDR model, suggesting that a company's short-term debt ratio will decrease if it has a high level of working capital. LMTR and its interaction with New_policy do not give us any significant coefficients. Again, as can been seen in Table 5, the changes in debt ratios are trivial, which may be the reason why we cannot see any significant results here at the individual firm level.
CONCLUSION
No matter how much criticism it has received, the TCJA of 2017 is the largest reform of the U.S. corporate tax law in the past 30 years. The new law brought great benefits to U.S. companies, with the highest tax rate reduced from 35 to 21%.
Interest payments on debt have been documented as a tax shield, which firms frequently use to avoid taxes (Stiglitz, 1986; Desai and Dharmapala, 2009). The enormous reduction in the corporate tax rate makes the use of debt less desirable to lower taxes. Bank of America-Merrill Lynch asked more than 300 managers at major US companies what they would do with a corporate tax cut. The No.1 reply is to pay down debt (Long, 2019). In this paper, the empirical test was used to show that the executives did what they responded to in the survey.
Although many opponents believe that TCJA has not achieved the promised benefits, the research found that TCJA effectively reduces companies’ debt in general. The reduction of debt, especially the debt solely for tax purposes, is good for companies in the long run. According to Castanias (1983), when businesses do not have an incentive to increase debt because of tax benefits, they may choose a borrowing strategy that is more optimal in terms of increasing firms' overall value. A low debt ratio reduces both transaction costs and liquidation costs.
This paper has some implications for both regulators and investors. For policymakers, it was found that firms react to the tax cut by reducing their debts, which further reduces their risks. This may help build a healthier financing system as we know that the 2008 financial crisis is primarily due to excessive use of debt (Russo and Katzel, 2010). For investors, it was shown that reducing corporate risk-taking behavior will benefit them in the long run.
The limitation of the paper is that we can only use the data for two years surrounding the effective date of the TCJA due to the COVID pandemic. The effect may not be fully reflected because firms need time to adjust their policies and react to the new rule.
CONFLICT OF INTERESTS
The authors have not declared any conflicts of interests.
REFERENCES
|
Aivazian VA, Ge Y, Qiu J (2005). The impact of leverage on firm investment: Canadian Evidence. Journal of Corporate Finance 11(1-2):277-291. |
|
|
Ang JS, Peterson DR (1986). Optimal debt versus debt capacity: A disequilibrium model of corporate debt behavior. Research in Finance 6:51-72. |
|
|
Castanias R (1983). Bankruptcy risk and optimal Capital Structure. The Journal of Finance 38(5):1617-1635. |
|
|
Desai MA, Dharmapala D (2009). Corporate Tax Avoidance and Firm Value. The Review of Economics and Statistics 91(3):537-546. |
|
|
De SA, Nigro V (2012). Does Corporate Taxation Affect Cross-Country Firm Leverage? Bank of Italy Temi di Discussione (Working Paper) No, 889. |
|
|
D'Mello R, Gruskin M, Kulchania M (2018). Shareholders valuation of long-term debt and decline in firms' leverage ratio. Journal of Corporate Finance 48:352-374. |
|
|
Fan JP, Titman S, Twite G (2012). An international comparison of capital structure and debt maturity choices. Journal of Financial and Quantitative Analysis 47(1):23-56. |
|
|
Fehr H, Jokisch S, Kambhampati A, Kotlikoff LJ (2013). Simulating the Elimination of the U.S. Corporate Income Tax (No. w19757). National Bureau of Economic Research. |
|
|
Fischer EO, Heinkel R, Zechner J (1989). Dynamic Capital Structure Choice: Theory and Tests. The Journal of Finance 44(1):19-40. |
|
|
Gaertner FB, Lynch DP, Vernon ME (2018). The effects of the tax cuts & jobs act of 2017 on defined benefit pension contributions. Contemporary Accounting Research 37(4):1990-2019. |
|
|
Carrizosa R, Gaertner F, Lynch DP (2020). Debt and taxes? The effect of TCJA interest limitations on capital structure. |
|
|
Gale W, Gelfond H, Krupkin A, Mazur MJ, Toder E (2018). A Preliminary Assessment of the Tax Cuts and Jobs Act of 2017. National Tax Journal 71(4):589-611. |
|
|
Givoly D, Hayn C, Ofer AR, Sarig O (1992). Taxes and Capital Structure: Evidence from Firms' Response to the Tax Reform Act of 1986. The Review of Financial Studies 5(2):331-355. |
|
|
Gordon RH, Lee Y (2001). Do Taxes Affect Corporate Debt Policy? Evidence from U.S. Corporate Tax Return Data. Journal of Public Economics 82(2):195-224. |
|
|
Graham JR, Lemmon ML, Schallheim JS (1998). Debt, Leases, Taxes, and the Endogeneity of Corporate Tax Status. The Journal of Finance 53(1):131-162. |
|
|
Graham JR (1999). Do personal taxes affect corporate financing decisions?. Journal of Public Economics 73(2):147-185. |
|
|
Graham JR, Tucker AL (2006). Tax shelters and corporate debt policy. Journal of Financial Economics 81(3):563-594. |
|
|
Huizinga H, Laeven L, Nicodeme G (2008). Capital Structure and International Debt Shifting. Journal of Financial Economics 88(1):80-118. |
|
|
Johnson K (2019). Top U.S. regulator warns over corporate debt, market risks. Reuters, September 09, 2019, Available at: |
|
|
Krämer R (2015). Taxation and capital structure choice: The role of ownership. The Scandinavian Journal of Economics 117(3):957-982. |
|
|
Kim WS, Sorensen EH (1986). Evidence on the Impact of the Agency Costs of Debt on Corporate Debt Policy. Journal of Financial and Quantitative Analysis 21(2):131-144. |
|
|
Long H (2019). 'Why aren't the Other Hands up?' A top Trump Adviser's Startling Response to CEOs not doing what he'd Expect. Retrieved December 29, 2020. Available at: |
|
|
Longstaff FA, Strebulaev IA (2014). Corporate Taxes and Capital Structure: A Long-Term Historical Perspective (No. w20372). |
|
|
MacKie-Mason J (1988). Do Taxes Affect Corporate Financing Decisions? (No. w2632). National Bureau of Economic Research. |
|
|
McConnell JJ, Servaes H (1995). Equity Ownership and the two Faces of Debt. Journal of Financial Economics 39(1):131-157. |
|
|
Myers SC (1977). Determinants of Corporate Borrowing. Journal of Financial Economics 5(2):147-175. |
|
|
OECD (2017). Statutory Corporate Income Tax Rates, 2017. |
|
|
Page BR, Rosenberg J, Nunns JR, Rohaly J, Berger D (2017). Macroeconomic Analysis of the Tax Cuts and Jobs Act. Washington: Urban-Brookings Tax Policy Center. |
|
|
Platikanova P (2017). Debt maturity and tax avoidance. European Accounting Review 26(1):97-124. |
|
|
Rader M (2020). The Tax Cuts and Jobs Act of 2017: Implications for the U.S. Real Estate Market. Corporate Real Estate Journal 9(3):234-255. |
|
|
Rajan RG, Zingales L (1995). What do we Know about Capital Structure? Some Evidence from International Data. The Journal of Finance 50(5):1421-1460. |
|
|
Russo TA, Katzel AJ (2010). The 2008 financial crisis and its aftermath: Addressing the next debt challenge. |
|
|
Shum PM (1996). Taxes and Corporate Debt Policy in Canada: An Empirical Investigation. Canadian Journal of Economics 29(3):556-572. |
|
|
Stiglitz JE (1972). Some Aspects of the Pure Theory of Corporate Finance: Bankruptcies and Take-Overs. The Bell Journal of Economics and Management Science 3(2):458-482. |
|
|
Stiglitz JE (1986). The General Theory of Tax Avoidance (No. w1868). National Bureau of Economic Research. |
|
|
Tax Policy Center (2022). Corporate Top Tax Rate and Bracket, February 14, 2022. Available at: Crossref |
|
|
The White House (2019). CEA Report: The Growth Effects of Corporate Tax Reform and Implications for Wages. Available at: Crossref |
|
|
Titman S, Wessels R (1988). The Determinants of Capital Structure Choice. The Journal of Finance 43(1):1-19. |
|
|
Wagner AF, Zeckhauser RJ, Ziegler A (2018). Unequal Rewards to Firms: Stock Market Responses to the Trump Election and the 2017 Corporate Tax Reform. AEA Papers and Proceedings 108:590-596. |
|
|
Yu K (2020). Economic Partiality and Horizontal Inequity: The New TCJA Interest Expense Deduction Limit. Wash. UJL & Pol'y 62:249. |
|
Copyright © 2024 Author(s) retain the copyright of this article.
This article is published under the terms of the Creative Commons Attribution License 4.0


