ABSTRACT
The value added tax gap (VAT gap) is a notable indicator of tax evasion, tax avoidance and overall inefficiency within the tax system. As the VAT gap in Greece is one of the largest in the European Union (EU), an attempt to quantify and analyze it was made. In order to achieve that, social, economic, fiscal and tax factors were examined based on international literature, since there is very little relevant research in Greece. Particular emphasis was given to factors that revolve around tax administration, such as tax audits. Specifically, twelve factors were examined for a period of 21 years (between 1997 and 2018) using econometric models based on time series data. In addition, the VAT Gap was separated into two components; a gap arising from tax non-compliance (‘compliance gap’) and a gap arising from political decisions (‘policy gap’), for the purpose of properly analyzing the effects of the influential factors on the Greek VAT gap. The VAT revenue ratio (VRR) was used as the dependent variable in order to measure the Greek VAT Gap. The analysis revealed that five out of the total twelve explanatory variables examined greatly influence the Greek VAT Gap. Specifically, two of them, that is, the ratio of VAT to total taxes and the number of tax audits, have a negative correlation with the Greek VAT gap. The other three variables, namely the final government consumption expenditure, the difference between the standard and reduced VAT rates and the gross value added/gross domestic product ratio have a positive correlation with the Greek VAT gap. These findings can be potentially utilized by the authorities to limit VAT non-compliance and battle evasion.
Key words: Value added tax (VAT), VAT gap, VAT revenue ratio (VRR), tax administration, tax audits.
The Value Added Tax (VAT) was first introduced in Greece back in 1986 (Law 1642/1986) and since then has become the main indirect consumption tax applied in the Greek tax system. It was later codified by Law 2859/2000 (VAT Code) in order to incorporate all available rules and regulations up to that point. Today, there are four main types of VAT rates in Greece: the standard VAT rate at 24%, the reduced VAT rate at 13%, the ultra-reduced VAT rate at 6% and the null VAT rate at 0%. The VAT is also a Community Tax that all European Union (EU) member countries are obliged to apply due to the implementation of EU Directive 2006/112/EC and the Council Implementing Regulation No. 282/15.03.2011.
For Greece in particular, indirect taxes represent the largest part of government revenues. On an annual basis, of the total tax revenues from indirect taxes, a percentage of more than 50% is VAT revenues (source: Eurostat database). Furthermore, when examining the ratio of revenues from indirect taxes to the Greek Gross Domestic Product (GDP), one can observe that consumer taxes are the main source of government revenue, contrary to other developed economies where direct taxes contribute more to the state budget. Figure 1 shows the ratio of indirect to direct taxes (denoted as D2/D5) for Greece (vertical axis) compared to the corresponding average ratio of the EU countries, for the 1997-2018 period (horizontal axis). The comparison of the two ratios confirmed the importance of indirect taxes for the Greek economy and its importance compared to the rest of the EU.
The ratio of VAT Revenues (VR) to the Greek GDP was examined for the whole period under investigation (1997-2018) and was found to be particularly high, while in some years it even exceeded 8% of the Greek GDP. The lowest price of VAT revenues in Greece was 7.58 billion Euros in 1997 (source: Eurostat database) and since then a rapid and continuous increase in revenues has been observed; in some years the VAT revenues doubled the 1997 revenues. In Figure 2, the vertical axis presents the percentage ratio of VAT Revenues to GDP (VR/GDP) for Greece compared to the corresponding average ratio of the EU countries for the 1997-2018 period (horizontal axis). These data show that from the year 2005 onwards (except the year 2009), the VR/GDP percentage for Greece exceeded the corresponding EU average, with the difference constantly widening from 2013 to 2018.
Based on the above evidence, the significance of VAT revenues in the Greek economy becomes apparent. Any loss of VAT revenues may lead to public deficit in the short-run and greater public debt in the long-run. Also, low levels of VAT collection may cause less public and private investment, more unemployment and therefore lower economic growth. The loss of VAT revenues due to non-compliance, evasion, fraud and the ineffectiveness of policy-making choices- commonly referred to as a ‘VAT Gap’ - is a topic of great importance for all modern economies and a subject of research for many economists. Moreover, the VAT Gap can be divided into a ‘compliance gap’ which comes from tax non-compliance (this includes deliberate tax evasion, tax avoidance, errors in the calculation of taxes, low quality of tax administration services and the non-collection of taxes and fees) and a ‘policy gap’ which comes from policy choices (reduced VAT rates, exceptions).
Thus, the need to address the VAT Gap in Greece becomes obvious. To achieve this, an understanding of the structure of the Greek VAT Gap through a thorough analysis of factors that affect it is needed, including the analysis of the compliance and policy gaps. The objectives of this paper are to determine the VAT Gap in the Greek tax reality using a well-known analytical method for quantifying VAT gaps; the VAT Revenue Ratio (VRR), examine individual factors that affect it and provide relevant policy recommendations. In order to achieve more precise estimations a top-down approach and an econometric model that focuses on tax administration variables was used to address VAT compliance issues.
International literature on the subject of VAT gaps is well documented in recent years. Efforts have been made to address VAT Gaps both at the level of national economies by the appropriate administrative bodies and individual scholars, as well as on a global level by internationally renowned organizations such as the Organization for Economic Co-operation and Development (OECD), the International Monetary Fund (IMF), the Center for Social and Economic Research (CASE) and the EU’s Directorate-General department for Taxation and Customs Union (TAXUD). Contrary to this, Greek literature and research on VAT gaps are still insufficient, despite the fact that Greece has one of the largest VAT Gaps in the EU. For this reason, the investigation of factors that influence the Greek VAT gap and their relationship with the Greek tax reality may provide innovative ‘data’ in terms of the adoption of appropriate policies and procedures (best practices) for battling tax evasion. The case of Greece can be a ‘benchmark’ case study for other countries with a high VAT gap and similar socio-economic characteristics and tax systems.
The importance of tax administration in vat gap analysis
VAT Gap literature has so far being focused on economic and social factors which are directly or indirectly linked to government policy. However, there is little bibliography on the correlation between the actions/schemes of Tax Administration and the VAT Gap. Dealing with the VAT gap is a complex combination of public finance, tax law enforcement, tax authority’s organizational design, ethics and tax morale (Andreoni et al., 1998).
In this paper we incorporate the role of Tax Administration, in order to (a) understand its importance in relation to the Greek VAT gap and (b) ascertain its uses for policy-making. An indicator of the importance of Tax Administration in the Greek economy can be seen in its establishment as an autonomous entity known as the Independent Public Revenue Authority (hereafter AADE) in 2017, while up until 2016 all actions regarding tax policy and administration were exercised by the Ministry of Finance. AADE’s mission is to ensure public revenues, strengthen tax compliance, combat tax evasion and smuggling and at the same time provide high quality services to citizens and businesses (AADE Strategic Plan 2020-2024). Its activities, among others, consist of collecting established and due tax debts and leading the suppressive - control mechanism (tax audits). These activities and their relationship with the VAT gap are examined in this paper.
Key factors that influence the VAT gap
As seen above, there is little literature on VAT Gap analysis in Greece. For the purposes of this paper, prominent economic, fiscal and social factors were chosen from international literature, based on their strong influence over the VAT Gap. Furthermore, in order to address the Greek tax reality, several tax factors such as audits and fines were selected for investigation. A total of twelve influential factors were thus selected. In order to understand their significance and meaning a brief review of every factor is provided below.
Gross domestic product (GDP) growth
GDP has been studied extensively as a determinant of the VAT Gap in various forms, such as GDP per capita, GDP (size of economy) and GDP growth. The growth of GDP, in particular, has been used in the CASE reports (CASE, 2019, 2020) for the EU VAT gap quantification where it was observed that an increase in economic growth leads to a reduction of the VAT gap. When addressing the issue from a single-country perspective (instead of CASE’s panel data analysis of the EU 28 countries), as in Redo (2018), concerning the VAT gap in Poland, we observe that despite the increase in economic growth the VAT Gap continued to grow, for a specific number of years. For the purposes of our paper, we examine the year-by-year economic growth of the Greek economy in terms of percentage in order to determine its effect on the VAT gap.
Unemployment rate
In the 2018, 2019 and 2020 CASE reports (CASE 2018, 2019, 2020), we observe that the unemployment rate has a positive impact on the VAT Gap (the higher the unemployment rate the higher the level of the VAT Gap). Madzharova (2014) argues that unemployment as an explanatory variable not only denotes the general state of the economy, but also directly affects private consumption since VAT’s performance deteriorates as the number of the unemployed rises. In our case, we calculate the annual unemployment rate as the percentage of active population.
General government final consumption expenditure (as % of GDP)
According to Reckon (2009), the government’s final consumption expenditure is one of the main categories of relevant expenditure that gives rise to irrecoverable VAT Revenues. Ueda (2017) also debates the importance of government final consumption and reasons that this variable greatly affects the policy gap of the VAT Gap. Considering the above and that there is no tax evasion in government expenditures, we focus on General Government Final Consumption Expenditure to determine the relationship of final consumption with the VAT Gap. It is also important to note that VRR, by nature, overestimates the contribution of Government Consumption in the calculation of VAT Gap (Keen, 2013). Therefore, we expect this variable to be significant and to balance the above overestimation.
Difference between standard and reduced VAT rates
Another variable that has been used in previous literature to determine tax policy and the complexity of the VAT system is the difference between Standard and Reduced VAT Rates. Agha and Haughton (1996) highlight that the greater the number of VAT rates, the lower the degree of compliance as multiple-rate VAT systems offer more opportunities for evasion, as well as being harder to supervise. Their results point towards the necessity of a single moderate VAT rate on a broad tax base as multiple VAT rates lead to bigger compliance gaps due to increased costs in tax administration. Ebrill et al. (2001) also expected it to have a positive relationship with the VAT Gap. More recent studies such as the Institute for Fiscal Studies (2011) have yielded similar results. It is therefore understandable that in order to examine the relationship of this variable with the VAT Gap in Greece, we calculated the difference between the standard VAT rate and the weighted average of the reduced VAT rates, excluding the ultra-reduced rates in some Greek islands.
Tertiary education
According to Zidkova (2016), a more educated society (thus measuring the share of tertiary education in a country) would be less inclined to commit tax evasion and more able to comply with difficult VAT rules, hence a high level of education is expected to decrease the VAT Gap. In Greece, tertiary education is increasingly high in recent years; therefore we consider it crucial for our paper and we specifically examined the percentage of higher education graduates between the ages of 25 and 64.
Gini Index
Bird et al. (2004) reasons that unequal distributions of income and wealth are likely to enhance tax avoidance and tax evasion. Christie and Holzner (2006) also agree that income inequality, as measured by the Gini coefficient, hints at the fact that tax evasion may be influenced by poverty. Kozuharov (2015) showed that the impact of the VAT on income inequality is relatively high, that is, there is a possible bond between the tax revenues derived from VAT and the income inequality measured with the Gini index in his country.
VAT as a percentage (%) of total taxes in an economy
The significance of VAT in the tax structure of an economy can influence the size of the VAT Gap, since VAT revenues are a significant source of state budget (Zidkova, 2016). In Greece, VAT is the most important indirect consumption tax and is a major source of government revenues. By incorporating this variable into our model we intend to not only show its significance for reducing the Greek VAT gap but also reducing the Compliance gap and simultaneously increasing VAT Revenues.
Gross Value Added/ Gross Domestic Product (GVA/GDP)
The variable of the added value of the Greek Economy in relation to its GDP is examined by the author as it reflects the “new wealth” created in an economy minus taxes (for instance VAT) and adding subsidies on products. For this reason, the value added of specific sectors in GDP such as catering, agriculture and construction has not been examined as has been the case in past research. There are a lot of influences that affect the evolution of VRR, or VAT gap, or any other phenomenon for that matter that no model can ever hope to cover conclusively. We usually examine some specific factors that theory, practice, common sense or even intuition dictate us and make models that help us understand a given question. GVA as a percentage of GDP plays that role in this case. If GVA/GDP increases, for example, it means that the proportion of taxes corresponding to the created value added decreased. This variable taken within the context of a model represents everything that we do not explicitly examine, so we expect it to prove significant and have a negative effect on VRR.
Established and collected fines
AADE collects data for two categories of fines; established fines (the number of fines which have been charged and certified) and collected fines (the part of the established fines that have been collected). For each of the two categories of fines we examined the sums of three types of penalties: (a) the imposed fines and surcharges for VAT, (b) the fines imposed for violations of the Greek Code for Accounting Books and Records (later on replaced by the Greek tax code of tax transactions (KFAS)) and (c) the fines imposed by the Customs for smuggling and simple customs violations. The last two penalties were considered by the author given their relevance with the VAT fines. Previous studies included the collection rate of fines and taxes associated with auditing activities and showed that the collection of fines stimulated tax compliance in general (Tagkalakis, 2014). In this paper the correlation between Established and Collected Fines with the VAT Gap was investigated, using top-down estimations.
Suppressive mechanism–Tax audits
Previous research on tax audits as factors that may influence the VAT Gap only included bottom-up techniques (Lešnik, 2018), whereas in this paper a top-down approach was attempted. Regarding the suppressive mechanism of the Greek tax administration, it must be noted that tax audits are broken down into “from-the-office” audits, full-on-site audits and partial-on-site (pre-emptive) audits in accordance with article 23 of the Code of Tax Procedure (KFD) under Law 4174/2013. Of these, only the number of pre-emptive audits carried out on an annual basis was examined, given that they are a dominant form of audit in Greece. Data from “from-the-office” and “full-on-site” audits were not examined. The “from-the-office” form of audit was first established in 2013 and there are insufficient data for the entire range of the examined time series. As for the latter, we also lack available data for the full range of our time series in order to incorporate them into our model.
Number of violations
In relation to the previous factor we also examined the number of violations found by the pre-emptive audits.
International literature -both theoretical and empirical- that addresses the issue of VAT Gaps is ever-growing in recent years. The methodologies used by different organizations and scholars to analyze VAT efficiency and quantify the VAT Gap are diverse and often fitted specifically to the country or countries under investigation, depending on the availability of data, particularities of the tax system, type of fraud or evasion, administrative capacity and main objectives of the research in question. Therefore, when attempting an analysis on VAT Gaps, there are two fundamental issues that must be taken into account by the researcher. The first issue concerns the different estimation approaches that must be employed for the collection of the necessary data. The second issue concerns the different ‘instruments’ for analyzing the data, depending on the desired objective (VAT compliance, VAT Gap measurement, VAT liability, VAT revenues, etc).
VAT gap estimation approaches
There are three major approaches for the estimation of VAT Gaps (Hutton, 2017). The first one is the top-down approach, aiming to provide a comprehensive assessment of all tax losses by measuring the gap as the difference between estimated potential revenue and actual revenues. The estimates for potential revenue are typically produced using statistical data. The second is the bottom-up approach where ‘bottom-up techniques’, such as random sampling of taxpayers for audit or compliance risk analysis, are used to estimate the impact of specific behaviors. The final estimation approach revolves around econometric techniques, such as frontier analysis and time series analysis which provide estimates of efficiency or revenue losses. In all cases, the preferred methodology and the quality of data used will affect the robustness of the results. The estimation approach that was most appropriate for the objectives of this paper, based on the available raw data for the Greek economy, was the top-down approach.
VAT gap analytical instruments
Based on the different estimation approaches mentioned above, there are several analytical instruments used for quantifying VAT revenues, VAT non-compliance and VAT Gaps.
C-efficiency ratio
The C-Efficiency Ratio measures the ratio of the actual VAT revenue to the theoretical revenue derived from the product of aggregate final consumption and the VAT standard rate and is widely used by the IMF as a broad indicator of the overall efficiency and effectiveness of the VAT system. According to Keen (2013), this indicator shows the impact on government VAT revenues of both the policy gap (due to different VAT rates and exemptions) and the non-compliance gap (due to incomplete application of the tax).
VAT revenue ratio (VRR)
VAT Revenue Ratio (VRR) is an indicator developed by the OECD and measures (top down) the difference between the VAT revenue actually collected and what would theoretically be raised if VAT was applied at the standard rate to the entire potential tax base. Essentially, it is a successor of the C-Efficiency Index, which measures VAT effectiveness by dividing VAT collections with the standard rate of VAT as a percentage of GDP (Ebrill et al., 2001). The VRR offers three important advantages. First and foremost, it is simple to calculate from readily accessible data (from National Accounts and respective authorities). Secondly, it provides a uniform VAT imposed on all final consumption, which policy makers can use as a benchmark tax for decreasing the VAT Gap. Thirdly, the gap between ‘actual’ and ‘potential’ revenues measured by the VRR may be decomposed in a number of useful ways for assessing VAT compliance and administrative effort (Keen, 2013).
Revenue administration gap analysis program (RA-GAP)
According to RA-GAP methodology, as developed by the IMF, the tax gap (for any type of tax including VAT) is the difference between potential revenue of the underlying economic tax base and actual revenue. Again, the tax gap is decomposed into two main components: the impact of non-compliance, and the impact of policy choices (Hutton, 2017).
VAT tax liability according to the law (VTTL)
The Center for Social and Economic Research (CASE) has carried out several studies on behalf of the European Union regarding VAT gaps. The key (top-down) method used in this report is the VAT tax liability according to the law (VTTL). The VTTL is an estimated amount of VAT that is theoretically collectible based on the VAT legislation and ancillary regulations. The VAT gap is defined as the difference between the amount of VAT actually collected and the VAT Total Tax Liability (VTTL), in absolute or percentage terms (CASE, 2013, 2014, 2015).
Her Majesty's Revenue and Customs (HMRC), United Kingdom (UK)
In the UK, the Tax Authority (HMRC) developed a practice of tax gap estimations for all main taxes. In the HMRC's definition (HMRC, 2020), the ‘tax gap’ is the difference between the amount of tax that should, in theory, be collected by HMRC, against what is actually collected. In the United Kingdom, the VAT gap is estimated by both a top-down methodology and a bottom-up methodology. The calculations are prepared in-house by the Tax Authority (HMRC). From the analytical tools mentioned above, the VRR was chosen as the most appropriate indicator for quantifying the Greek VAT Gap, based on the availability of statistical data and its functionality for the researcher’s purposes.
Quantification of VRR
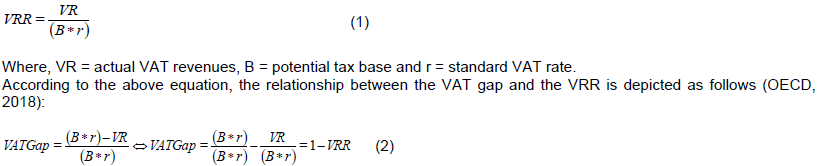
The VAT Revenue Ratio (VRR) provides an indicator that combines the effect of loss of revenues due to VAT exemptions and reduced rates, tax planning as well as VAT fraud and/or evasion. Its aim is to interpret a country’s ability to effectively secure the whole of its potential tax base and support policymakers in assessing their VAT revenue performance (OECD, 2014, 2015, 2016). It measures the difference between the actually-collected-VAT-revenues and the revenues that would theoretically be collected if VAT were applied at the standard rate to the whole potential tax base, otherwise known as a “pure” VAT regime (OECD, 2018). According to the OECD (2018), the VRR is measured as follows:
Here, the standard VAT rate refers to the default rate applicable to the potential tax base (without taking into account exemptions, reduced rates or other schemes advised by tax administrations). The closest statistic for potential tax base is final consumption expenditure as measured in the national accounts. In the Eurostat database, final consumption expenditure (denoted as item P3) is calculated according to the standard international norm known as the System of National Accounts (denoted as SNA-2008) and consists of the following components (European Commission et al., 2009):
(i) P31-S14: Private final consumption expenditure of households.
(ii) P31-s15: final consumption expenditure of Non-Profit Organizations Serving Households (NPSH).
(iii) P3 -S13: Final consumption expenditure of general government, including: P31-S13: Individual consumption expenditure of general government and P32-S13: Collective consumption expenditure of general government.
In the VRR calculation formula as presented in equation (1), the potential tax base (B) is measured by the final consumption expenditure under Item P3 in the national accounts. However, since the SNA measures consumption expenditures at market prices including VAT, revenues from VAT should be deducted from the amount under P3. The theoretical basis for taxation should not include the tax itself (OECD, 2018), so the potential tax base equals the Final Consumption Expenditure (FCE) minus the actual VAT revenues (VR). According to the OECD (2018) the VRR can then be rewritten as:
From Equation 3 above, it is easy to interpret the VRR depending on how close a country’s VAT system is to a “pure” VAT regime. If the VRR is equal to 1 we would have a “pure” VAT regime, whereas if the VRR is below 1 (VRR < 1) we can see the effect of reduced VAT rates, exemptions or/and a failure to collect all VAT due. On the other hand, a VRR that is above 1 (VRR > 1) would mean a VAT system where almost all the tax base is covered by the standard VAT rate and any exemptions applied to the system would ultimately lead to additional revenue due to the cascading effect of the exemption (OECD, 2015).
Decomposition of the VRR - Policy gap and compliance gap
The VRR is affected both by policy-making choices and tax compliance. Furthermore, the VRR also depends on the interaction between them. For example, a high standard VAT rate may create an incentive for evasion while multiple lower rates may lead to revenue loss due to misclassifications. Also, exemption of certain sectors of activity may create distortions and incentives for avoidance, which require additional administrative capacities that cannot be used for the efficient collection of VAT.
Inefficient tax administration, burdensome administrative requirements and complex VAT mechanisms may reduce the degree of compliance of taxpayers. These factors can be divided in two main categories (Keen, 2013); those resulting from policy decisions, mainly affecting the tax base or the coverage of the standard rate and those related to the efficiency of the tax collection and compliance levels. Measuring only the impact of policy decisions on a country’s VAT revenue, sometimes called the “Policy Efficiency Ratio”, can be achieved by comparing the theoretical VAT revenue under the actual tax base and rates (assuming perfect compliance) with that under a uniform tax on all consumption:
Policy Efficiency Ratio = (VAT theoretical revenue from actual tax law)/(final consumption Standard VAT rate)
On the other hand, a measure of compliance, sometimes called the “Compliance Efficiency Ratio” compares actual revenue with the theoretical VAT revenue under the legislated tax base and rates:
Compliance Efficiency Ratio = (VAT revenue)/ (theoretical VAT revenue from actual tax law).
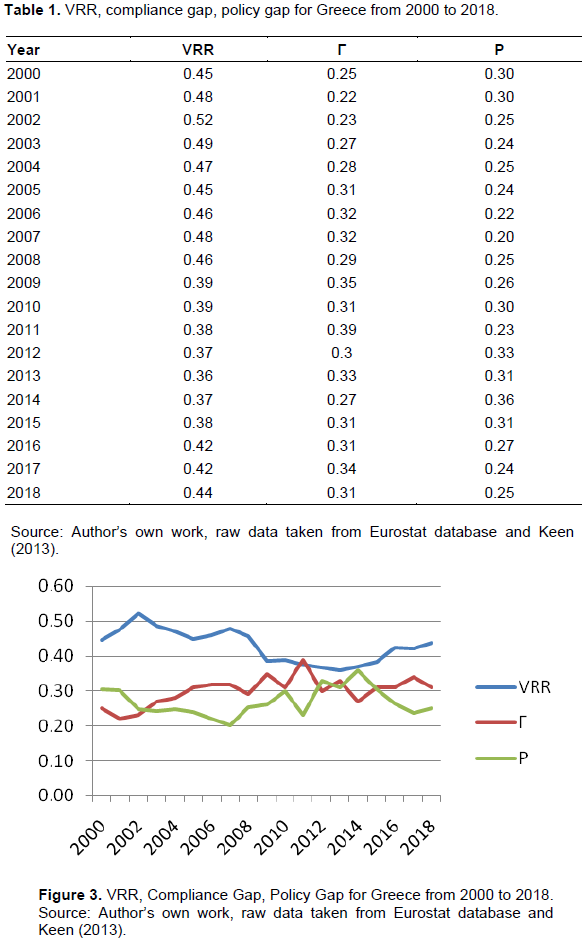
The VRR is a combination of the “Policy Efficiency Ratio” and the “Compliance Efficiency Ratio”. Different methods were developed to produce breakdowns of the composition of the VRR. Keen (2013) presented an estimate for the decomposition of the VRR based on a combination of the VAT gap estimates that were carried out for the EU Commission in 2006 and the VRR estimates from the OECD. Following the methodology of Keen (2013), we decomposed the VRR for Greece by taking the VTTL from the TAXUD reports, which essentially measures the compliance gap (Γ) and we then calculated the policy gap (P) as a residue (P = 1 – VRR – Γ). VAT Revenues (VR) were found in the Eurostat database under ‘Main National Accounts Tax Aggregates’ (denoted as gov_10a_taxag) under Item D211: Value added type taxes (VAT). The standard VAT rates were taken from the European Commission’s “VAT rates applied in the Member States of the European Union” (European Commission, 2020). In the years that included a rate change a weighted mean was taken. Table 1 presents the decomposition of the Greek VRR into the Policy and Compliance gaps from 2000 to 2018. No data regarding the VTTL exist before the year 2000, thus we were unable to present the decomposition of the VRR for the full period under investigation. Nevertheless, this fact does not affect the econometric model which was used in this paper, since data for the calculation of the VRR was available for the full period under investigation (1997-2018). Figure 3 gives a better visual understanding of the Greek VRR, the Greek compliance gap (Γ) and the Greek policy gap (P) in the vertical axis over the period from 2000 to 2018 (horizontal axis).
Model specification
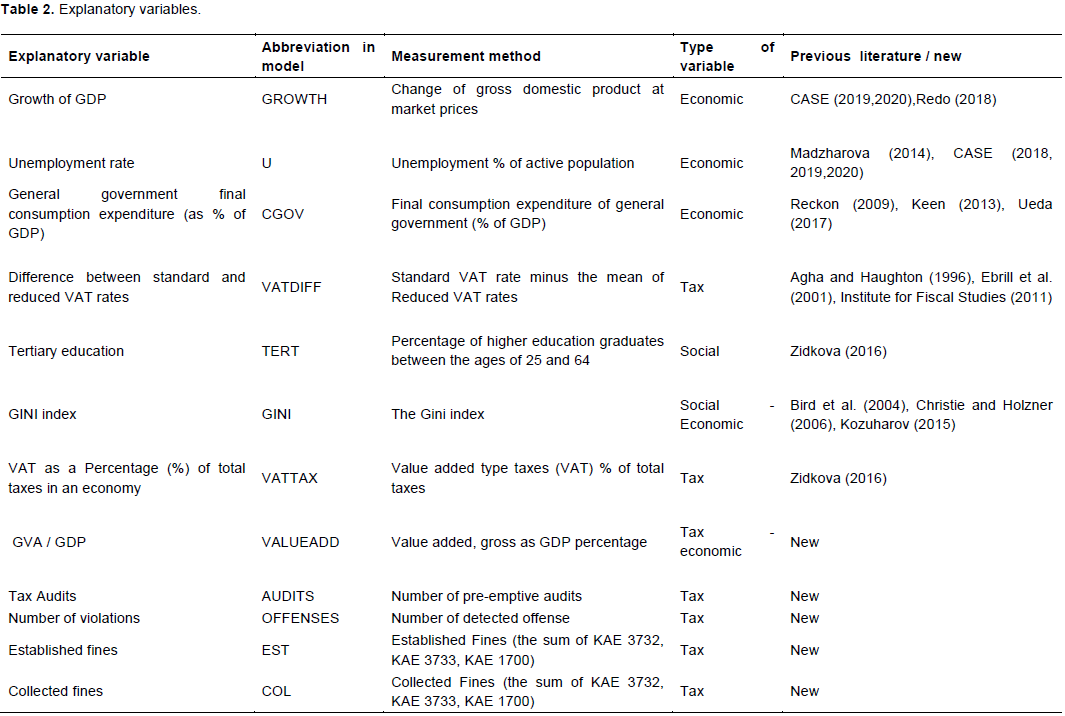
In the econometric model utilized in this paper the dependent variable that is used for the VAT Gap is expressed by the VRR. There are twelve 12 explanatory variables. These are presented in Table 2. A first algebraic approach to a model would be in the form of a multiple linear regression, given by Equation 4, where Xt is the explanatory variables seen in Table 2.
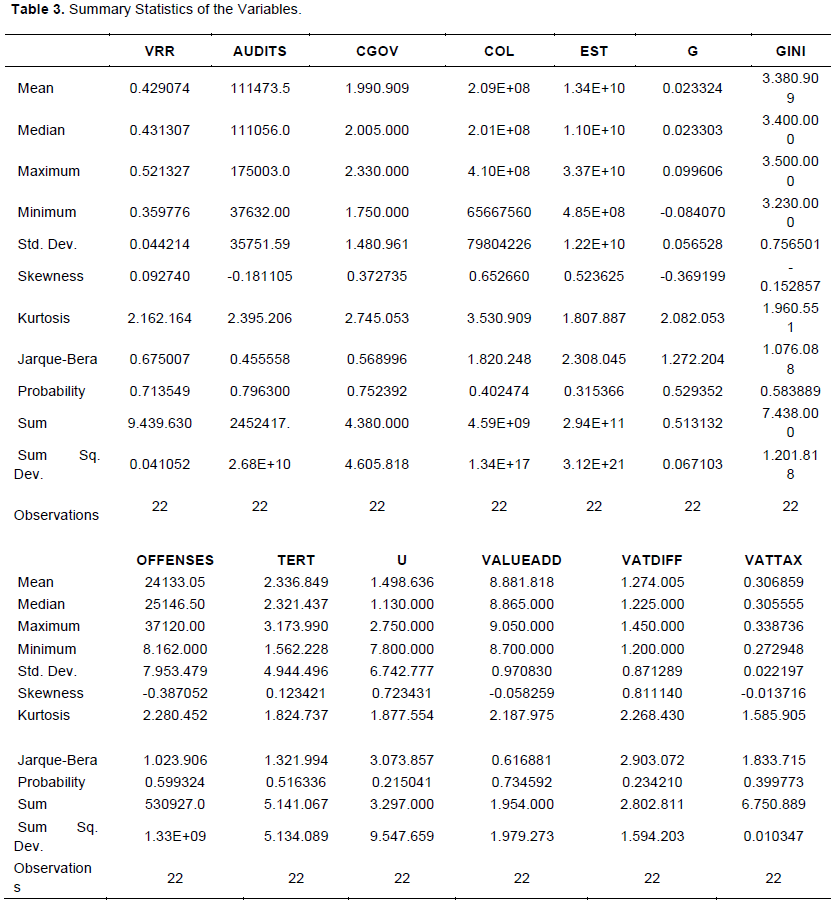
That model would be acceptable provided that the Gauss-Markov assumptions are met. The available data cover a time period of 22 years and so a Generalized Least Squares (GLS) regression will have no advantage over an Ordinary Least Squares (OLS) regression as a method of estimation (Baltagi, 2008). Table 3 presents the summary statistics of the explanatory variables of the model. The data-set is complete except for the Gini Index that has a missing value for the year 2002. It was interpolated using Catmull-Rom Spline.
Data availability
For the variables Growth of GDP, Unemployment, Final consumption expenditure of general government (% GDP), Difference of standard from reduced VAT rates, Gini-Coefficient, Value added type taxes (VAT) % of total taxes, and GVA/GDP the annual data from 1997 to 2018 were obtained from Eurostat’s general government surveys (data accessed on August 04, 2020). Data regarding the level of tertiary education in Greece were collected from the OECD database due to the fact that the same category of data in the Eurostat database was not available for the full time period (data accessed on August 04, 2020).
Data concerning the pre-emptive audits as well as the number of VAT violations were obtained from the annual reports of the Greek Tax authorities, while data regarding the established and collected fines were obtained from the annual state accounts of the Greek Ministry of Finance. More specifically, they were acquired according to the Codes of Expenditures (KAE): 1700 - “Increases, fines and monetary penalties for indirect taxes”, 3732 - “Fines imposed by the financial supervisors for violations of Greek Code for Accounting Books and Records” and 3733 - “Fines, multiple and additional fees imposed by the Customs for simple customs offenses, smuggling and violations of Law 2637/53, as in force”.
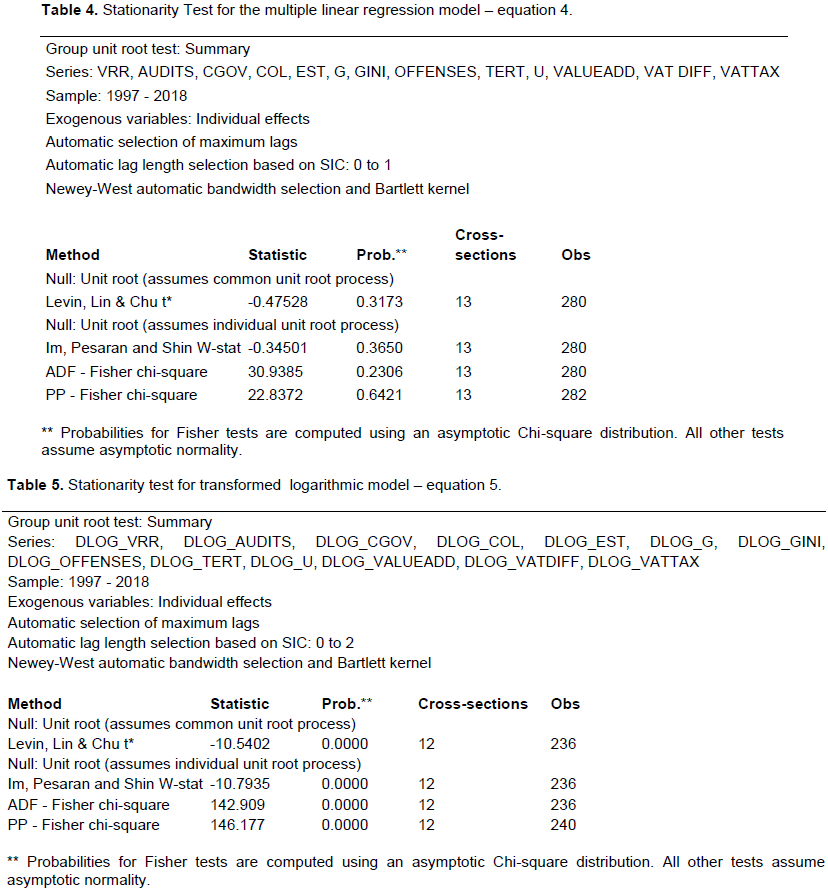
Before the results of the model are presented, several diagnostic tests were conducted. Table 4 shows a test for stationarity. The output of the unit root test in Table 4 indicates that the explanatory variables are not stationary and that could result in spurious regression. To solve this problem the differences of the logarithms of the variables were examined. This transformed the model from equation (4) into the following:
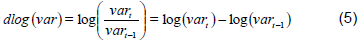
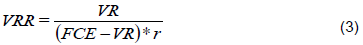
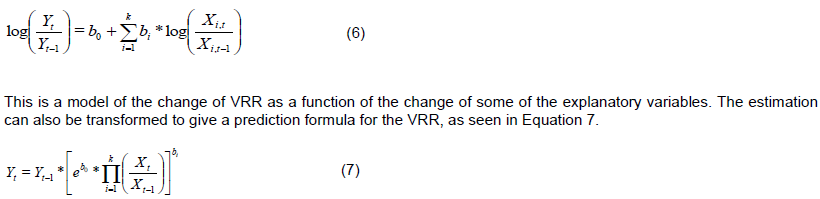
A stationarity test is conducted again for the transformed (logarithmic) model. The following output (Table 5) shows that the stationarity problem has been addressed. Another advantage of the transformation of the variables to differences of logarithms, that are equivalent to percentage change, is the evening of the units of measure involved. All the variables are now expressed as dimensionless numbers. The model that was actually estimated is described in equation (6).
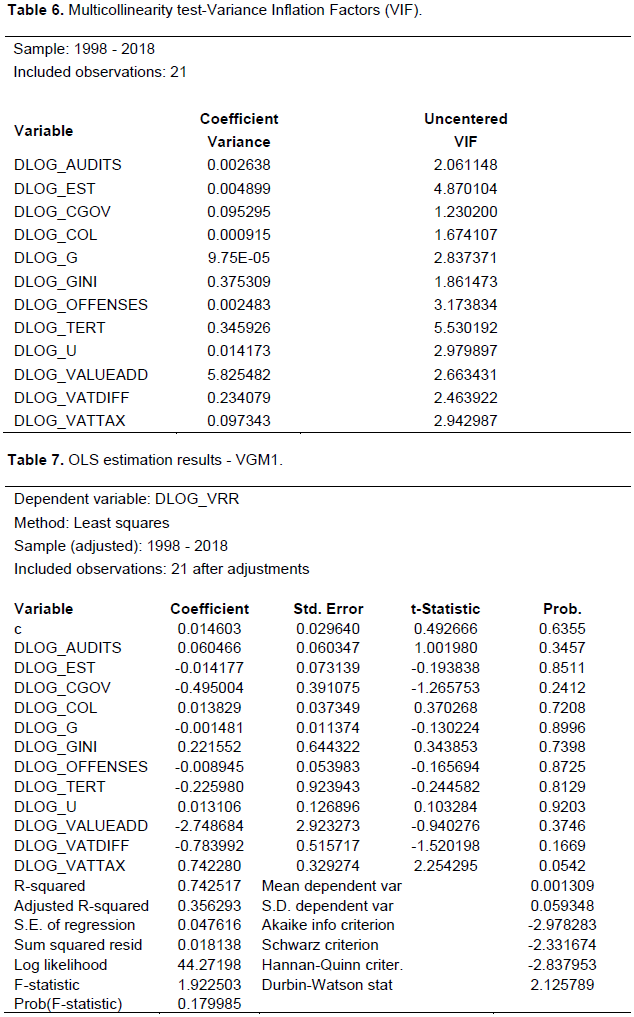
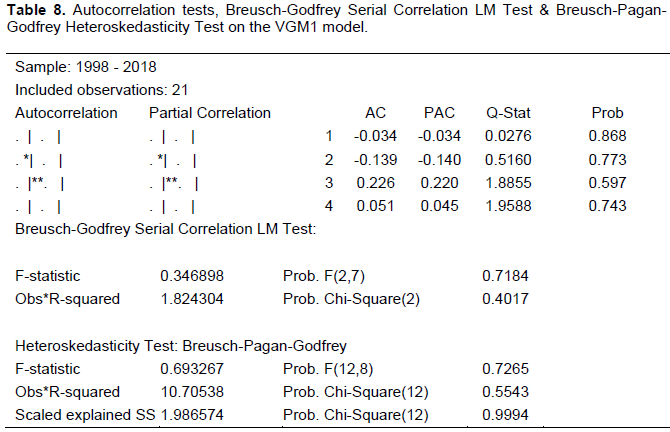
Tests for multicollinearity (Table 6) were taken using the Variance Inflation Factor (VIF). A VIF value that exceeds 10 would indicate a problematic amount of collinearity (Gareth et al., 2014). The results of Table 6 rule out high multicollinearity so the estimation method that was chosen was OLS. The results are given in Table 7. This is the first estimated Model denoted as VAT Gap Model 1 (VGM1). Before we proceed to the elimination of the less significant variables we should run some tests for autocorrelation to make sure that the requirements for the use of OLS are met. These are given in Table 8.
The output indicates that there is no autocorrelation in the residuals. The Breusch-Pagan-Godfrey test output shows no heteroskedasticity. The Jarque-Bera test is a test for normality of the residuals and it shows that they are normally distributed. The results are Jarque-Bera=1.397960 with Probability= 0.497092. Since the tests imply neither autocorrelation nor heteroskedasticity between normally distributed residuals we can continue using OLS estimation. We also take into consideration that the sample size is small and so OLS is preferred over GLS (Rao and Griliches, 1969).
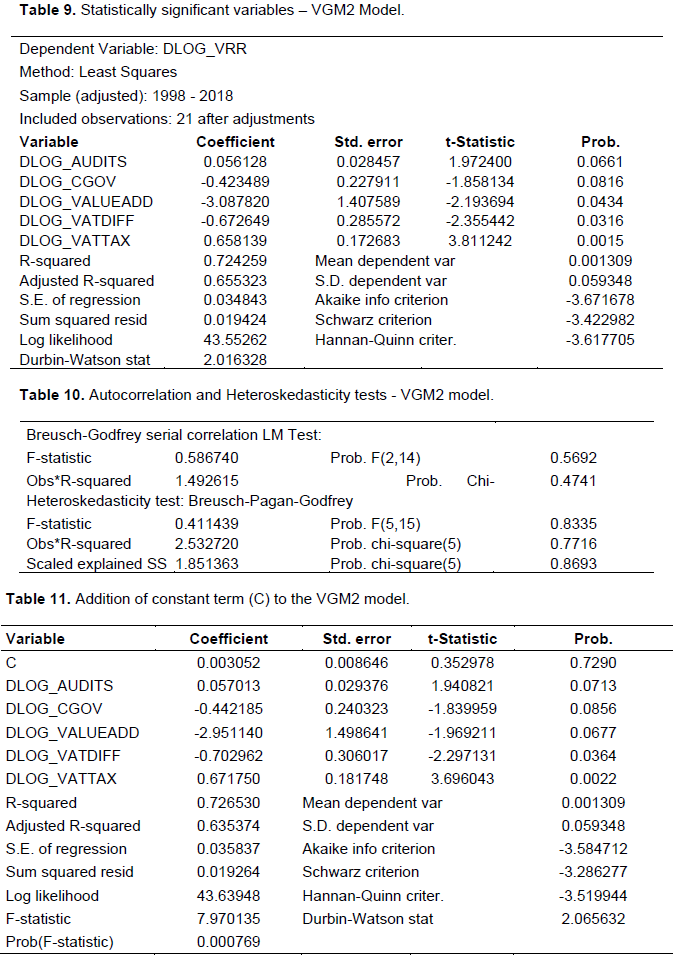
Backward elimination of the less significant variables of the previous OLS estimation (VGM1 model) was done. This is the result of a series of eliminations of the variables of the first estimation (VGM1) model. In each step the less significant variable is left out until the remaining are all significant. The following statistically significant variables are obtained (Table 9). This is now the new model denoted as VAT Gap Model 2 (VGM2). We repeat the tests for autocorrelation and heteroskedasticity to make sure that the residuals are still normally distributed (Table 10).
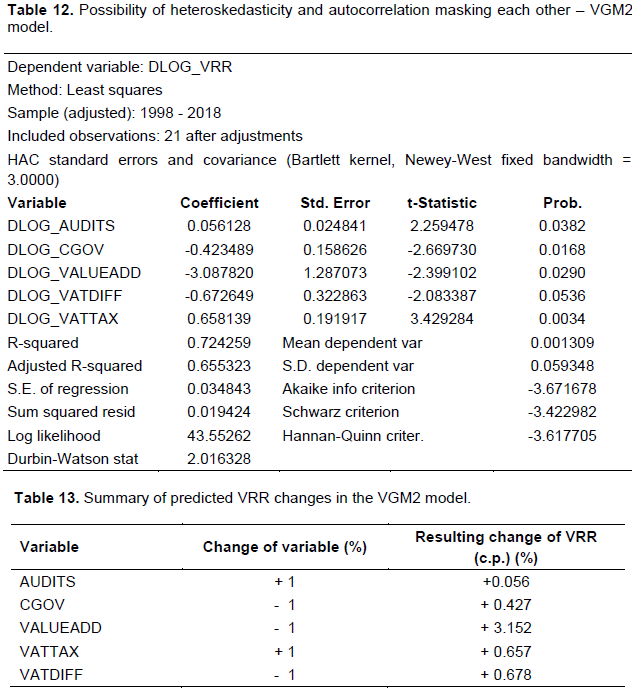
The results show that our model is reasonable (Jarque-Bera = 1.933667 with Probability = 0.380285). It could however, be argued that a constant term (denoted C) should be included to account for various factors that were not examined in the first place. In that case the other coefficients would not be affected much (Table 11). The constant term (C) is obviously very close to zero to make any difference and also the influences that were not specifically examined by the model are already represented in it by the variable VALUEADD that makes the constant term redundant. We can repeat the procedure with Newey-West Heteroskedasticity and Autocorrelation Consistent (HAC) estimators, to address the possibility of heteroskedasticity and autocorrelation masking each other (Table 12). The tests results are similar to the previous ones. The standard errors are different, as expected, but the specification of the model is the same; so there is no advantage in using HAC estimators in our case (Newey and West, 1987). The formulation of the VGM2 model according to equation (5) will be:
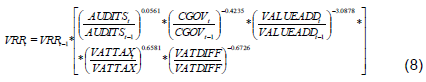
DLOG_VRR = 0.056127779855*DLOG_AUDITS - 0.423489000891*DLOG_CGOV - 3.0878203597*DLOG_VALUEADD - 0.672648668947*DLOG_VATDIFF + 0.658138564963*DLOG_VATTAX And if we transform it according to equation (7) we get:
The final formulation of the VGM2 model can serve two purposes. It can inform us about which variables stand out and have a significant influence on VRR as well as the magnitude and direction of their influence. It can also serve as a predictive tool that can be used to make policy suggestions. For example, we see that an increase of 1% in the VAT to total taxes ratio will increase (ceteris paribus) the VRR by 0.657%. We can summarize these predicted results in Table 13.
Of course we can only expect these results from relatively small changes of the variables. If we double CGOV for example we cannot expect the model to hold because the structure of the economy will be different. We also cannot drastically change the VAT rates and expect to make an accurate prediction of the outcome without considering the effects that the final prices change will have on the consumption. But even with its limitations the model can give us some very useful insights.
CONCLUSION AND RECOMMENDATIONS
Out of the twelve explanatory variables examined in our model, five were found to be statistically significant. Two of them, specifically the ratio of VAT to total taxes (VAT as a Percentage of total taxes in an economy) and the number of tax audits, have a positive correlation with the VRR and a negative correlation with the VAT gap. The other three variables, final government consumption expenditure, the difference between the standard and reduced VAT rates and the GVA/GDP ratio have a positive correlation with the Greek VAT gap.
Regarding the first of the two variables with a negative relationship with the VAT gap, the ratio of VAT to total taxes confirms the prominent position of the VAT in the Greek tax system and that its effective and robust collection contributes decisively to the increase of government revenues. The detection of unpaid VAT through the control mechanism and the appropriate control procedures, as well as the collection of VAT confirmed through the implementation of the stipulated procedures should therefore be key priorities of the Greek Tax Administration.
In the same direction, the second variable with a negative relationship with the VAT gap is the number of tax audits. The need to strengthen tax audits is demonstrated not only by the statistical importance of this variable but is also tied to the aforementioned variable. Pre-emptive audits are characterized by particular features such as holisticity and the element of surprise as they are unanticipated. As a consequence, the revelation of tax evasion takes place at the moment it is in progress and not after its completion; therefore there is a greater deterrent effect. The aforementioned characteristics give pre-emptive audits an important position in the field of tax audits, making them crucial in preventing tax evasion and reducing the VAT gap. When carrying out a pre-emptive audit, given that its scope covers the entire activity of a tax entity, comprehensive knowledge of taxable entities is required and therefore it is necessary for Tax Administration personnel to have adequate training and education regarding tax entities and their activities, as well as tax laws and regulations. This is a prerequisite for attaining the pursued results from tax audits. Of course this ‘knowledge’ must be combined with impartiality and objectivity as the tax control mechanism must remain corruption-free and independent from political interference. The responsibility of the Greek Tax Administration at this point is enormous as it must take the appropriate measures and ensure the smooth conduct of audits, seriously affecting tax evasion and reducing the VAT gap. In this context, the establishment and operation of AADE from 01.01.2017 can only be characterized as a positive step towards this direction.
In addition to the aforementioned variables, three others were found to be important, nonetheless, having a positive correlation with the VAT gap. First of all, the correlation between the VAT gap and the explanatory variable of the Gross Value Added of the Greek Economy (GVA) in relation to GDP is positive. Considering both subsidies and production/consumption as non-changing (ceteris paribus), then if the change in GVA is greater than the change in GDP that means that the taxes collected have been reduced which confirms the existence of a positive relationship between the variable and the VAT gap. That means that the increase of the numerator (GVA) of the examined variable is accompanied by the collection of less taxes and therefore leads to a larger VAT gap whether this is due to tax evasion or non-performance of the relevant political decisions. In this case, if the policy gap has not increased then the increase is due to tax evasion, which is addressed by the tax administration. Conversely, if, by keeping subsidies and production / consumption constant, we have a reduction in the GVA. This means that the taxes collected have increased and therefore we have a reduction in the VAT gap.
Likewise, the relationship between the VAT gap and the difference between the standard VAT rate and the reduced rates is also positive. Reduced VAT rates as well as zero VAT rates are enforced based on government policy decisions to protect or promote certain goods and services, which are considered essential for basic survival (such as foodstuff) that corresponds to a large part of poor households. These goods are closer to the true social optimum and may be seen as having intrinsic social or cultural value (Institute for Fiscal Studies-IFS, TAXUD, 2011), as is the intention on the part of governments to achieve a fairer fiscal and social policy through income redistribution. However, the application of zero and reduced rates should be done with special care so that their effect on the VAT gap is not decisive. The promotion - protection of specific products of sectors or geographical areas should be considered in the context of the broader tax system taking into account not only VAT taxation but also other forms of taxation such as income taxation, without omitting the consideration of other alternative policies such as systems’ benefits-subsidies for specific goods or geographical areas and social security.
Policy makers must take into account both the potential tax evasion and the loss of tax revenues due to the implementation of reduced or zero VAT rates. Following the findings of our analysis, we conclude that the use of a significantly-lower-than-the-standard reduced VAT rate is not recommended, since increasing the difference between the normal rate and reduced rates and the existence of zero rates would increase the VAT gap.
Finally, our model shows that final government consumption expenditure on GDP, although not related to tax evasion, has a positive correlation with the Greek VAT gap. The lack of VAT revenues from transactions regarding government expenditure (not due to evasion but due to reduced or zero rates) positively affects the policy gap, thus increasing the VAT gap. This paper comes to two primary conclusions. The first is that both the policy and compliance components of VAT gap are relatively high in the Greek economy. The second is that the Greek VAT gap is positively affected by final government consumption expenditure, the difference between the standard and reduced VAT rates and the GVA/GDP ratio, and negatively affected by the ratio of VAT to total taxes (VAT as a Percentage (%) of total taxes in an economy) and the number of tax audits. Policymakers, in their effort to reduce the VAT gap, should take into account the findings of this study, not only for the Greek economy but also for other countries with similar socio-economic characteristics and tax systems. Finally, in the future, a more detailed, sectoral (on the primary, secondary and tertiary sectors of the Greek economy) study on the Greek VAT Gap would be more effective in addressing the factors that affect the vat gap and would yield even better results regarding policy making.
The authors have not declared any conflict of interests.
The authors express their appreciation towards all the responders and all anonymous reviewers for their comments.
REFERENCES
|
Code of Tax Procedure (KFD) L.4174/2013 (article 23).
View
|
|
|
|
Council Directive 2006/112/EC of 28 November 2006 on the common system of value added tax.
View
|
|
|
|
|
Council Implementing Regulation (EU) No 282/2011 of 15 March 2011 laying down implementing measures for Directive 2006/112/EC on the common system of value added tax.
View
|
|
|
|
|
Greek Code for Accounting Books and Records - presidential decree 186/1992 (Government Gazette A'84/26-5-1992).
|
|
|
|
|
Greek tax code of tax transactions (KFAS) - L.4093/2012 (Government Gazette Α'222/12-11-2012).
View
|
|
|
|
|
Law 1642/1986 (Government Gazette A'125/21-8-1986).
View
|
|
|
|
|
Law 2859/2000 (Government Gazette A'248/07-11-2000).
View
|
|
|
|
|
Andreoni J, Erard B, Feinstein J (1998). Tax compliance. Journal of Economic Literature 36(2):618-680.
|
|
|
|
|
Agha A, Haughton J (1996). Designing Vat Systems: Some Efficiency Considerations. The Review of Economics and Statistics 78(2):303-308.
Crossref
|
|
|
|
|
Baltagi B (2008). Econometrics (4th ed.). Springer - Verlag Berlin Heidelberg.
View
|
|
|
|
|
Bird R, Martinez-Vazquez J, Torgler B (2004). Societal Institutions and Tax Effort in Developing Countries. Georgia State University -Andrew Young School of Policy Studies - International Studies Program, Working Paper 04-06.
View
|
|
|
|
|
Center for Social and Economic research - CASE and CPB Netherlands Bureau for Economic Policy Analysis (2013). Study to quantify and analyse the VAT Gap in the EU-27 Member States Final Report. Report for European Commission and TAXUD, TAXUD/2012/DE/316 FWC No. TAXUD/2010/CC/104.
View
|
|
|
|
|
Center for Social and Economic research - CASE and CPB Netherlands Bureau for Economic Policy Analysis (2014). 2012 Update report to the study to quantify and analyse the VAT Gap in the EU-27 Member States". Report for European Commission and TAXUD, TAXUD/2013/DE/321 FWC No. TAXUD/2010/CC/104.
View
|
|
|
|
|
Center for Social and Economic research - CASE and CPB Netherlands Bureau for Economic Policy Analysis (2015). Study to quantify and analyse the VAT Gap in the EU Member States. Report for European Commission and TAXUD, TAXUD/2013/DE/321 FWC No. TAXUD/2010/CC/104.
View
|
|
|
|
|
Center for Social and Economic research - CASE and Institute for Advanced Studies (2018). Study and Reports on the VAT Gap in the EU-28 Member States: 2018 Final Report. Report for Directorate General Taxation and Customs Union, TAXUD/2015/CC/131.
View
|
|
|
|
|
Center for Social and Economic research - CASE and Institute for Advanced Studies (2019). Study and Reports on the VAT Gap in the EU-28 Member States: 2019 Final Report. Report for Directorate General Taxation and Customs Union, TAXUD/ 2015/CC/131.
View
|
|
|
|
|
Center for Social and Economic research - CASE and Economisti Association (2020). Study and Reports on the VAT Gap in the EU-28 Member States: 2020 Final Report. Report for European Commission, DG TAXUD, TAXUD/ 2019/AO-14. available at:
View
|
|
|
|
|
Christie E, Holzner M. (2006). What Explains Tax Evasion? An Empirical Assessment based on European Data. Wiiw Working Papers 40.
View
|
|
|
|
|
Ebrill L, Keen M, Bodin JP, Summers V (2001). The modern VAT. International Monetary Fund - Publication Services - Washington.
Crossref
|
|
|
|
|
European Commission (2020). VAT Rates Applied in the Member States of the European Union.
View
|
|
|
|
|
European Commission, IMF, OECD, United Nations, World Bank (2009). System of National Accounts 2008 (2008 SNA).
View
|
|
|
|
|
Eurostat database.
View (accessed 4 August 2020).
|
|
|
|
|
Gareth J, Witten D, Hastie T, Tibshirani R (2014). An Introduction to Statistical Learning: With Applications. Springer Publishing Company.
|
|
|
|
|
Her Majesty's Revenue and Customs - HMRC (2020). Measuring tax gaps 2020 edition - Tax gap estimates for 2018 to 2019.
View
|
|
|
|
|
Hutton E (2017). The Revenue Administration - Gap Analysis program: Model and Methodology for Value-Added Tax Gap Estimation. IMF Fiscal Affairs Department.
View
Crossref
|
|
|
|
|
Independent Public Revenue Authority (AADE) Strategic Plan 2020 - 2024.
View
|
|
|
|
|
Institute for Fiscal Studies (2011). A retrospective evaluation of elements of the EU VAT system final report. Report for European Commission and TAXUD, TAXUD/2010/DE/328 FWC No. TAXUD/2010/CC/104. Available at:
View
|
|
|
|
|
Keen M (2013). The Anatomy of the VAT. IMF Working Paper, WP/13/111.
View
Crossref
|
|
|
|
|
Kozuharov S, Petkovski V, Ristovska N (2015). The impact of taxes measured by gini index. Journal of Economics 6(1):41-52.
|
|
|
|
|
Lešnik T, JagriÄ T, JagriÄ V (2018). VAT Gap Dependence and Fiscal Administration Measures. Naše gospodarstvo/Our economy 64(2):43-45.
Crossref
|
|
|
|
|
Madzharova B† (2014). The impact of cash and card transactions on VAT Collection efficiency.
View
|
|
|
|
|
Newey WK, West KD (1987). A simple, positive semi-definite, heteroskedasticity and autocorrelation consistent covariance matrix. Econometrica 55(3):703-708.
Crossref
|
|
|
|
|
OECD (2014). Consumption Tax Trends 2014 - VAT/GST and Excise Rates, Trends and Policy Issues.
View
|
|
|
|
|
OECD (2015). Tax Administration - Comparative Information on OECD and Other Advanced and Emerging Economies.
View
|
|
|
|
|
OECD (2016).Consumption Tax Trends 2016 - VAT/GST and Excise Rates, Trends and Policy Issues.
View
|
|
|
|
|
OECD (2018). Consumption Tax Trends 2018 - VAT/GST and Excise Rates, Trends and Policy Issues.
View
|
|
|
|
|
OECD database. https://stats.oecd.org/ (accessed 4 August 2020).
|
|
|
|
|
Rao P, Griliches Z (1969). Small-sample properties of several two-stage regression methods in the context of autocorrelated errors. Journal of American Statistical Association 64:253-272.
Crossref
|
|
|
|
|
Reckon LLP (2009). Study to quantify and analyse the VAT GAP in the EU-25 member states. Report for DG Taxation and Customs Union.
View
|
|
|
|
|
Redo M (2018). The issue of VAT gap in Poland in contrast to the European Union member states as a threat to financial security of the state.
View
|
|
|
|
|
Ueda J (2017). The Evolution of Potential VAT Revenues and C-Efficiency in Advanced Economies. IMF Working Paper, WP/17/158.
View
Crossref
|
|
|
|
|
Tagkalakis A (2014). The direct and indirect effects of audits on the tax revenue in Greece. Economics Bulletin, AccessEcon 34(2):984-1001.
|
|
|
|
|
Zidkova H, Pavel J (2016). What causes the VAT gap? Journal of Economics 64:811-826.
|
|