ABSTRACT
The main objective of this study was to examine the influence of board size on the financial performance of listed companies within the East African Community (EAC) and make recommendations on the board size that can enhance company financial performance within the EAC. The research adopted a positivist paradigm in a quantitative analysis using non-probability sampling to select forty-two listed companies listed on the EACs stock markets between 2008 and 2014. We developed our hypothesis based on secondary data from databases, company’s published annual reports, and websites. We used Microsoft excel and SPSS to generate, manage and analyses data used in the descriptive statistics, correlation, and regression outputs. Results from our regression analysis were inconclusive and hence we were unable to generalize the relationship between board size and company performance moderated by total assets and market capitalization. The descriptive statistics result suggests that the optimal board size in EAC lies between nine and ten members. We thus recommend to EAC-listed companies to adopt board size of nine directors to avoid the drawback of large boards such as limited members’ participation, lack cohesion and consensus due to widespread opinions which may deter the board from carrying out its advisory and monitoring functions.
Key words: Board size, East African Community (EAC) stock markets, financial performance.
Board size is defined as total number of directors (both outside and executive directors) at a specified time (Lipton and Lorsch, 1992; Yermack, 1996). The board of directors plays two broad functions: Company monitoring and advisory services to the management (Nguyen et al., 2016). According to Dalton et al. (1999), large boards often offers wide and rich levels of monitoring and advisory than a small board especially where the board is not well diversified. Goodstein et al. (1994) posit that board size reflects the company’s ability to attract resources from its environment, this is consistent with the resource dependency theory which states that companies always aim to attract a diversity of directors as a means of attracting resources (human capital, network, and financial) to the company (Johnson et al., 1996). So what is the optimal board size? According to Lipton and Lorsch (1992), an optimal board size is composed of eight to nine directors while Jensen (1993) suggested an optimal board to be comprised by seven to eight directors. At any point when number goes above or below an optimal size, the board’s insufficiencies outweigh its benefits and hence poor company performance (Jensen, 1993; Lipton and Lorsch, 1992). It is believed that both big or small board sizes have some merits and demerits, for instance a large and complex company will require a large board to provide a wide range advice and monitoring than small ones (Coles et al., 2008). Board size depends on company characteristics; Small and Medium Enterprises (SMEs) or family businesses tend to have fewer directors than multinational organizations (Gabrielsson, 2007). However, Jensen (1993) suggests that both large and small board sizes have some risks and benefits, hence companies should aim at having an optimal board that minimizes the risks while maximizing the benefits associated with the board size. According to Bonn et al. (2004), a large board is often more skeptical when making strategic decisions than an optimal one, which will inhibit the company’s value maximization. This makes large boards more symbolic in nature but less competent in facilitating good management practices (Hermalin and Weisbach, 1991). The establishment of the EAC- Common Market in 2010 led to the regional harmonization of trade, taxation regimes, accounting systems, and security market listings rules within the region (Yabara, 2012). The EAC has four securities exchange markets (SEM’s) domiciled within the four EAC member states each with different codes of governance and good practices that regulate their listed companies and issuers of bond instruments. These codes provide codes of conduct addressing the minimum board size, roles and responsibilities of the CEO, board committees, shareholders’ rights to mention but a few. These codes are neither compulsory nor legally binding to listed companies (CMA, 2002). The codes simply provide guidance to stock market participants on corporate ethical practices and self-regulation protocols (CMA, 2002). One of the fundamental changes brought about by the operationalization of the EAC- Common Market in 2010 was the free movement of capital and labor among the member states which would affect the firm characteristics such as the most optimal board size for EAC listed companies. This study thus examined the board size in 2008/2009 before the operationalization of the EAC common market in 2010 and 2013/2014. This was three years after the operationalization of the EAC common market.
The main objective of this study was thus to examine the influence of board size on the financial performance of listed companies within the East African Community (EAC) and make recommendations on the board size that can enhance company financial performance within the EAC. According to Dalton et al. (1999), unlike small boards, bigger boards tend to lack cohesion which limits their ability to connect with all directors. This makes it difficult for the board to reach a consensus due to the wide ranging differences in opinions (Lipton and Lorsch 1992). Muth and Donaldson (1998) posits that a large board makes it extremely hard for an organization to take quick decisions, because it takes the executive management more time and effort to achieve a consensus decision. This can exacerbate by poor coordination, which is typical of larger boards (Cheng 2008). According to Cheng (2008) a large number of directors increases the agency cost. Lipton and Lorsch (1992) identified dysfunctional behavioral norms and higher monitoring costs associated with a large board. Goodstein et al. (1994) acquiesced that a big board often face problems of poor group cohesion and higher levels of internal power struggles and bickering, which may hinder the board in carrying out its advisory and monitoring functions (Nguyen et al.,2016). On the other hand, Mwanzia Mulili (2014) identified the large board to be associated with many benefits; a larger board brings to the company wider knowledge, skills, experience and economic networks of the individual directors, which can be used to create synergy between the board of directors and management, thereby increasing company financial performance.
We adopted the agency theory to explain the relationship between board size on company performance as commonly used in accounting and finance research (Alagha, 2016; Heenetigala, 2011; Tshipa, 2015).
Agency theory
The need to separate organizational ownership and control creates an agency relationship, whereby principals (shareholders) contract agents (managers) to run their company on their behalf (Bhaduri and Selarka, 2016; Fama, 1980). An agency relationship is established because of an organization’s need to ensure independence of organizational control from ownership. Jensen and Meckling (1976) distinguish a company as a nexus between different types of stakeholders, with the principal at one end and an agent on the other with diverse rights and responsibilities, which theoretically should complement each other for the good of the company. However, due to management’s lack of altruism, they tend to focus more on their personal gains when making strategic decisions, which create the principal–agent conflicts (Fama, 1980). The agency theory hence seeks to resolve such conflicts through strict monitoring and controls to restrain the management prejudices in decision-making. The principal–agent conflict is further worsened by information asymmetry where an agent tends to have more information than the principal, thus creating a moral dilemma that motivates an agent to pursue personal interests at the expense of the principal (Bhaduri and Selarka, 2016). Consequently, the principal is forced to incur agency costs (such as audit fees) to make the agents responsible for any wrong decisions while mitigating any risks associated with the agent’s extravagances (Jensen and Meckling,,1976). We adopted the agency theory to explain the importance of board size in reducing the agent’s extravagances; an optimal board size improves its ability to monitor and control management decisions thereby reducing agency costs (Bhaduri and Selarka 2016; Fama, 1980).
Company performance
According to Shleifer and Vishny (1997), company performance depends on its governance; a company with poor governance such as incongruous board size is less likely to invest in profitable projects that can generate superior cash flows for the benefit of the shareholders and vice versa. Performance is measured in different ways using varying performance matrices. The commonly used matrix include Return on Assets (ROA), Return on Equity (ROE), Tobin’s Q ratio (TBQ) and Price Earnings ratio (PER). These are commonly used in finance and accounting research to evaluate the extent to which a company has achieved its overall objective (Richard et al., 2009). Performance measurements thus help managers to assess the effectiveness of company strategies and identify opportunities for strategic changes to achieve the targeted performance objectives (Porter, 2008). There are two broad categories of performance measurements; market-based (measuring performance using marketing information) and accounting based (measuring performance using accounting information). The accounting-based measures have been criticized for using historical information as a measure of company’s present performance (Hall and Brummer, 1999); while market-based performance measurements are faulted for being too simplistic due to their inherent assumptions like the efficient market hypothesis (EMH) used in determining share prices as a measure of company performance (Tobin, 1984). To avoid the weaknesses of accounting or market-based performance measurements, we adopted a mix of accounting (ROE and ROA) and market-based (TBQ and PER) as our measures of performance.
We adopted return on assets, Tobin’s q ratio, return on equity, and price earnings ratio as our performance measurement as commonly used in business, finance, accounting and corporate governance research (Alagha, 2016; Heenetigala, 2011; Tshipa, 2015)
Return on assets (ROA)
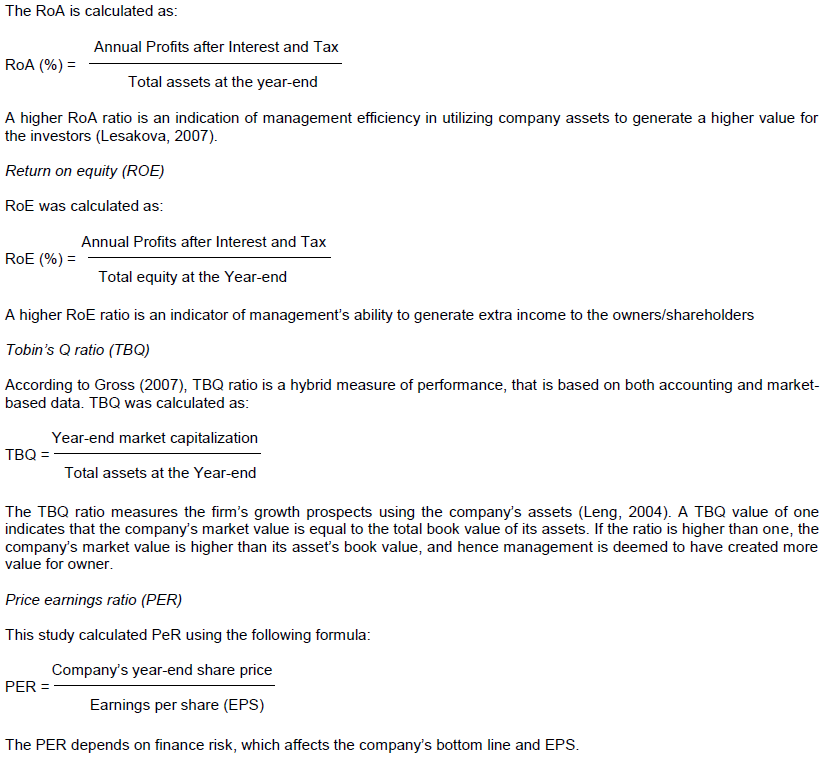
The RoA ratio is a measure of company efficiency in generating income from its total assets (Lesakova, 2007). It is one of the commonly used accounting measure of performance when evaluating companies’ economic health and the proficiency of investment portfolios (Lesakova, 2007). According to Ingram and Albright (2006), the RoA ratio provides a links between company's annual operations and investment activities. The RoA ratio hence measures the efficiency management in using company assets (Lesakova, 2007).
Control variables
This study adopted total assets and market capitalization as the control variables as often used in accounting and finance research (Lins, 2003). According to Bowerman et al. (2003), a control variable is a variable which is held constant during the course of an experiment, in order to assess or clarify changes in other independent variables. The use of control variables in regression models helps to determine their explanatory power exclusive of the independent variables (Tabachnick and Fidell, 2006). Total assets in this study are represented by book value of all company assets at the year-end. Prior studies in accounting, corporate governance, finance, and company performance have used total assets as the control variable (Alagha, 2016; Heenetigala, 2011). We computed Market Capitalization by multiplying the year-end market price per share by the total number of outstanding shares at the financial year-end (Heenetigala, 2011). Market capitalization represents the value of a company based on its perceived future economic prospects, and it has commonly been used in many corporate performance studies as a control variable (Alagha 2016 and Heenetigala, 2011).
The EAC stock markets
The EAC has four securities exchange markets (SEM’s) domiciled in the four EAC member states. These are the Nairobi Securities Exchange (NSE) in Kenya, the Dares Salaam Stock Exchange (DSE) in Tanzania, Uganda Securities Exchange (USE) in Uganda, and the Rwanda Stock Exchange (RSE) in Rwanda. Burundi and South Sudan do not have operational stock exchange markets. The stock markets are a major source of information and capital to listed companies, which helps them to better their financial performance. According to Yartey and Adjasi (2007), stock markets exist to facilitate low-cost information flow between international and domestic market players, thus enhancing the company’s return on investment. Hence, a country without a stock market is more likely to lag behind economically (Baier et al., 2004). Stock market hitherto promotes the adoption of international financial reporting standards which promotes transparency between management and investors hence improved financial performance (Ilmolelian 2005). In the mid-1990s, EAC member countries formed Capital Market Authorities to regulate the activities of the East African Community Security Markets and in 1997, a joint regulatory body known as the East African Securities Regulatory Authorities (EASRA) was formed and mandated with regulating the EAC Security Markets’ activities, fast-tracking the EAC Security Markets’ integration, harmonizing the legal frameworks and market infrastructure as well as developing policy guidelines for the capital markets’ growth incentives within the EAC (Yabara 2012).
Meanwhile, in 2005, the EAC’s economic integration had changed from a free trade zone to the East African Community Customs Union, which later became the East African Common Market (EAC- Common Market) in 2010. This transformation led to the advent of corporate governance in the early 2000s among all the EAC countries. Kenya was the first country to introduce a code of corporate governance in 2002 followed by Uganda and Tanzania in 2003 (CMA, 2002). Rwanda introduced their code of corporate governance in 2010 (RSE, 2015).
The EAC code of governance does not recommend any specific number of directors for the listed companies’ boards. However, it advises companies to have an optimal board (that are neither too small nor too large) for the benefit of the company shareholders (CMA, 2002). We adopted an optimal board definition from Lipton and Lorsch (1992) where an optimal board is seen to have between eight and nine board members, making any board membership over nine or below eight classified as big and small respectively. Based on the above arguments, we hypothesized as follows:
H1: There is a significant relationship between board size and company performance.
We adopted a quantitative research design and positivist paradigm approach using a deductive technique to examine the relationship between board size and company performance (Veal 2005). Our study adopted a multiple regression in the ordinary least squares (OLS) method to examine the relationship between board size and company performance. A paradigm is defined as “a shared framework of assumptions held within a discipline, sub discipline or school of thought within a discipline” This has an influence on researcher’s choice of methodology to achieve specific research objectives (Veal, 2005, p. 24). There are two types of research paradigms in social science, namely the positivist and the critical or interpretive paradigms. Under the critical paradigm, a researcher is perceived to be independent from a research study, and behavior of the person (s) or group(s) used in the study is explained using only facts and observations (Veal, 2005). The positivist paradigm depends on three principal assumptions, namely: that the cause and effect must be identified to explain phenomena or test a theory, that knowledge is based on what can be tested by observing tangible evidence; and that a researcher must use a scientific method that emphasizes control, standardization and objectivity (Veal, 2005). We adopted these assumptions to clarify the research structure using quantitative statistical data analysis tools. We used the positivist paradigm which is usually applicable in quantitative research where theories and hypotheses are developed prior to the empirical study (Veal, 2005).
Sample selection and Data collection
We adopted non-probability sampling to select the forty-two listed companies used in this study. Initially, we intended to use as a population all the listed companies on the EAC Security Markets in 2008/2009 and 2013/2014. A total of 108 companies were listed on the EAC Security Markets as at 31st June 2016. Regrettably, not all the listed companies qualified to be included in the sample because they were either not listed on the EAC stock market for the full financial years 2008/2009 and 2013/2014, and their annual reports were not available from DataStream, Eikon and Mint Global Bureau Van Dijk databases. We used secondary data from company annual reports and databases, which are consistent with other accounting, finance, and corporate governance research studies where it was justified by the fact that secondary data sources save time and money for data collection (Heenetigala, 2011; Okiro, 2014). Secondary data was obtained from journal articles, e-books, websites and press releases. We also obtained financial data from databases (Orbis Bureau Van Dijk, DataStream, Eikon and Mint Global Bureau Van Dijk). Additional data was obtained from published companies’ annual reports on their websites. Microsoft Excel and Statistical Package for the Social Science (SPSS) version 23 was used for data analysis. We used SPSS to carry out the preliminary diagnostic tests, descriptive statistics, correlation, and regression analyses and Microsoft excel was used to manage and format data before exporting it into SPSS for statistical analysis.
Independent and dependent variable
This study seeks to examine the influence of board size on company financial performance in the EAC listed companies. We thus adopted board size as the study’s independent variable. Company board size influences its performance (Jensen, 1993; Lipton and Lorsch, 1992; Yermack, 1996). Coles et al. (2008) submit that larger boards are more effective in driving company performance because they bring together a pool of expertise from diverse directors, which helps the company to improve its monitoring capacity and enhance its financial performance. The wider knowledge of a larger board can also be utilised by the company in making some strategic decisions, which can drive company performance (Dalton et al., 1999). However, some schools of thought view larger boards as less effective in enhancing company performance. They hence conclude that board size is negatively associated with company performance (Cheng, 2008; Yermack, 1996). It is believed that a bigger board faces problems of social loafing and high coordination costs that affect company value (Jensen, 1993; Lipton and Lorsch, 1992; Yermack, 1996). Moreover, Cheng (2008) suggests that larger boards reduce company value and are not necessary for all categories of companies and industries. On the other hand, we used company performance (represented by return on assets, Tobin’s q ratio, return on equity, and price earnings ratio) as our dependent variable. This is consistently used measure of performance measurement commonly used in business, finance, and accounting research (Alagha, 2016; Heenetigala, 2011; Tshipa, 2015).
Ordinary least squares (OLS) regression
We adopted OLS regression which is considered a straightforward method of statistical analysis (Bryman and Bell, 2015). We adopted our model using the following equation:
Yi = βo + β1 X+? (1)
Where: Yi = the dependent variable, X = the independent variable, β0 = intercept, β1 = slope and ? = error term. The above equation was used to derive equation 2 and the subsequent 4 equations that were used in this study.
Yt = βo + β1BS + β2TA + β3MC +?t (2)
Where: β0 = intercept, βi = slope, Yt represents dependent variable (PER, TBQ, ROE or ROA) at time‘t’, BS = Board size, TA = total assets MC = market capitalization, and ?t represents the margin of error due to other factors outside the model that may influence Yt. We thus derived four model equations used to test the study hypotheses in SPSS.
ROAt = βo + β1BS+ β2TA + β3MC +?t (3)
ROEt = βo + β1BS+ β2TA + β3MC +?t (4)
TBQt = βo + β1BS+ β2TA + β3MC +?t (5)
PERt = βo + β1BS+ β2TA + β3MC +?t (6)
We used the above equations to test the hypotheses for the study period. Data analyses were carried out using the SPSS version 23 and the macro on HCSE estimators developed by Hayes and Cai (2007) which is known to provide heteroscedasticity-consistent regression results (Hayes and Cai, 2007).
OLS’s diagnostic tests
We carried out diagnostic statistics tests to ensure our data conforms to OLS regression assumptions of normality distribution, multicollinearity and homoscedasticity. Shapiro-Wilk test was used to test normality distribution. According to Baty et al. (2015), Shapiro-Wilk test is the best statistical means for detecting any deviations from normality distribution due to skewness or kurtosis. Using Shapiro-Wilk test, the null hypothesis states that there is no difference between the observed distribution of surveyed scores and a normally distributed sample error. Hence, if the critical alpha is larger than the obtained p-value, the null-hypothesis is rejected (Shapiro and Wilk, 1965). We also tested our data for multicollinearity using the variance inflation factor (VIF) in which multicollinearity problem is assumed to be present when the predictor variables have a VIF above 10.0 (Field, 2009). Our test revealed no multicollinearity problem with VIF less than 10.0. Finally, we tested our study data for homoscedasticity. According to Hayes and Cai (2007), the absence of homoscedasticity undermines statistical significance tests by making the estimator of the regression factor inconsistent and biased. We tested the presence of homoscedasticity using the Koenke tests in the SPSS macro developed by Watson and Teelucksingh (2002) posits that Koenker test is simple to comprehend and can be done on a small data sample like the case with this study. The null hypothesis of the heteroscedasticity test implies that there is no conditional heteroscedasticity and thus the individual-specific or time-specific variance error components are equal to zero (Park, 2011). The homoscedasticity assumption was met and hence we adopted the retrogression analysis to test the study’s hypothesis.
This study revealed the following statistical results on OLS diagnostic test, descriptive statistics (mean, median, standard deviation, maximum and minimum), correlation and regression results obtaining from testing the impact of board size on company financial performance.
OLS Assumption’s diagnostics test results
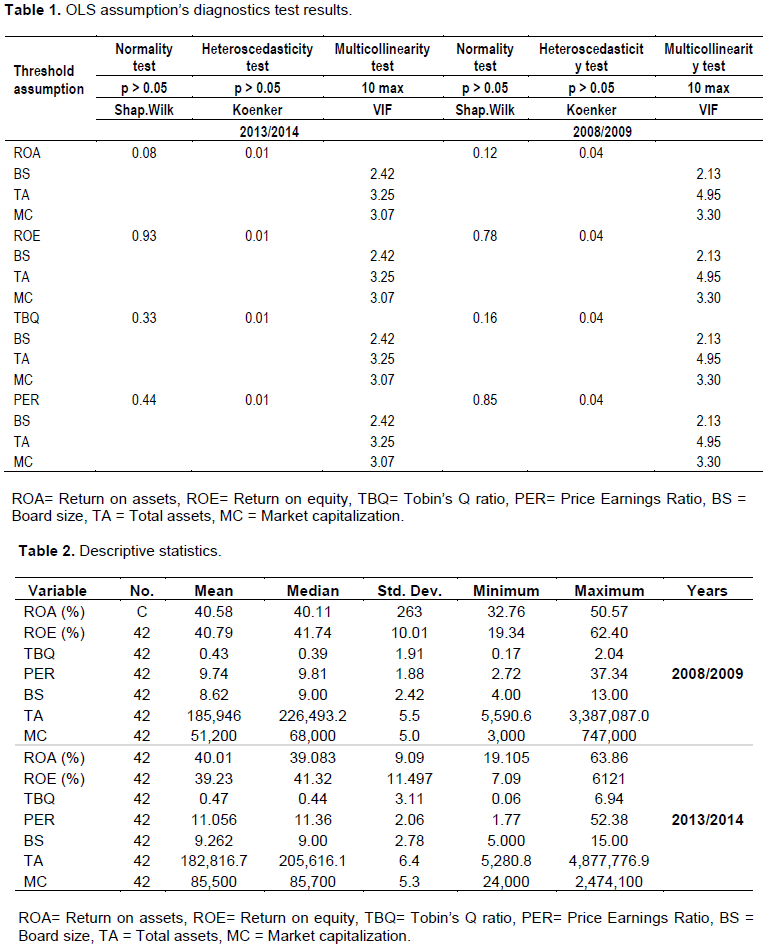
Table 1 presents the test results of the normality, heteroscedasticity, and multicollinearity. As indicated in Table 1, the p values for the Shapiro-Wilk tests for 2008/2009 were as follows: ROA =0.12, ROE = 0.780 TBQ = 0.16, and PER = 0.85, while in 2013/2014 ROA = 0.08, ROE = 0.930, TBQ = 0.33 and PER = 0.44. All these values are higher than 0.05 (the significance value) which confirms the presence of normality distribution of data (Shapiro and Wilk, 1965). Additionally, we tested multicollinearity using the Variance Inflation Factors (VIF). Using Field (2009) maximum VIF threshold value of 10.0, we discovered no multicollinearity problem since the VIF for the predictor variables in 2008/2009 and 2013/2014 were below the recommended VIF threshold of 10 (Field 2009). Also, as indicated in Table 1, we used Koenker tests to certify existence of homoscedasticity The results show that the p values of the Koenker tests results for 2013/2014 was 0.01 while in 2008/2009 it was 0.04 which are below homoscedastic threshold (p<0.05) which implies that the data used in this study was not homoscedastic (p<0.05).
Descriptive statistics
We used the mean, median, maximum, minimum and standard deviation to identify the statistical characteristics of the study’s dependent (PER TBQ, ROA, ROE) and independent variable (Board size). Table 2 presents the descriptive statistics.
Return on assets (ROA)
The descriptive statistics analysis in Table 2 indicated positive mean value in both periods, which indicates that the EAC-listed companies on averagely generated a similar positive return of about 40% on assets for their shareholders in 2008/2009 and 2013/2014. The degree of volatility in ROA increased by more than 50% in 2008/2009, as compared to 2013/2014. Comparatively, ROA was less volatile before the operationalization of the EAC Common market in 2010 (Table 2).
Return on Equity (ROE)
We calculated ROE as a percent of profits after interest and tax, divided by the company’s total shareholder equity. Analysis of 2008/2009 descriptive statistics on ROE in Table 2 indicated a mean of 40.79%, median of 41.74%, standard deviation of 10.01, minimum of 19.34%, and the maximum of 63.40%. The ROE mean and median values for both 2008/2009 and 2013/2014 indicate that the EAC-listed companies in this study generated a similar average positive return of about 40% for their shareholders before (2008/2009) and after (2013/2014) the establishment of the EAC-Common Market.
Tobin’s q ratio (TBQ)
The TBQ was calculated as a company’s market capitalization at the year-end, divided by its total assets. The TBQ descriptive statistics results in Table 2 show that for 2008/2009, TBQ had a mean of 0.4251, median of 0.390, standard deviation 1.913, minimum of 0.165, and maximum of 2.038. For 2013/2014, the TBQ descriptive statistic results included a mean of -0.466, median of 0.441, standard deviation of 3.107, minimum of 0.056 and maximum of 6.936. The descriptive statistics indicates that TBQ experienced higher volatility in 2013/2014, with an increased by 62% in 2013/2014 as compared to 2008/2009 (Table 2).
Price earnings ratio (PER)
The PER ratio in Table 2, was calculated as the year-end market price per share, divided by earnings per share (EPS), where market price per share is the year-end share price i.e. the price at which shares were bought or sold, based on the forces of demand and supply. The descriptive statistics results for 2008/2009 indicate an PER mean of 9.743, median of 9.812, standard deviation of 1.884, minimum of 2.719, and maximum of 37.341. On the other hand, in 2013/2014, the descriptive statistic results showed a mean of 11.056, median of 11.364, standard deviation of 2.058, minimum of 1.766, and maximum 52.375. There were no significant differences between the mean and median in PER for 2008/2009 and 2013/2014. The PER’s positive means and medians for both 2008/2009 and 2013/2014 are an indication that the EAC-listed companies continued to create value for their shareholders after the operationalization of the EAC–Common Market in 2010.
Board size (BS)
We measured BS as the total number of directors on the board of a company. The descriptive statistics (Table 2) demonstrate that in 2008/2009, the mean and median board size was 8.62 and 9.0 respectively, the standard deviation was 2.42, the minimum was 4.0 and the maximum was 13.0. In 2013/2014, the mean board size was 9.26, the median was 9.00, the standard deviation was 2.78, the minimum was 5.0 and the maximum was 15.0. Overall, after the operationalization of the EAC–Common market, the mean, minimum and maximum board sizes increased by 7, 25 and 15% respectively. Available data also indicates that the listed companies in the EAC had an average board size of 9 directors, which is consistent with the optimal board size recommended by Lipton and Lorsch (1992).
Total assets (TA) as a control variable
We used total assets and market capitalization as control variables, the company’s total assets were measured the total book value of all assets at the year-end. The descriptive statistics (Table 2) for 2008/2009 show mean total assets of US$ 185, 944, median of US$ 226, 493, and standard deviation of 5.5. The minimum was US$ 5, 591 with a maximum of US$ 3, 387, 087. In 2013/2014, the mean total assets were US$ 182, 817, the median of US$ 205, 616, the standard deviation was 6, the minimum was US$ 5, 281 and the maximum was US$ 4, 877,777. Table 2 shows a reduction in mean, median and minimum values by 0.1, 0.8 and 0.7% respectively. There was also a 2.4% increase in the maximum after the operationalization of the EAC Common Market.
Market capitalization (MC)
Market capitalization was calculated as the company’s total number of outstanding shares, multiplied by the market price per share (Yermack, 1996). The descriptive statistics results in Table 2 demonstrate the following statistics for 2008/2009: a mean market capitalization of US$ 51,200, a median of US$ 68,000, a standard deviation of 1.54, a minimum of US$ 3,000 and a maximum of US$ 747,000. Similarly, in 2014, the mean market capitalization was US$ 85,500 and the median was US$ 85,700, while the standard deviation, minimum, and maximum values were 1.68, US$ 2,400, and US$ 2,47100 respectively. Overall, between 2008/2009 and 2013/2014, the mean increased by 13%, the median by 5.5% and the maximum values of the market capitalization was 18.1%. However, the minimum value of the market capitalization fell by 5.6% after the operationalization of the EAC Common Market in 2010.
Pearson's correlation results
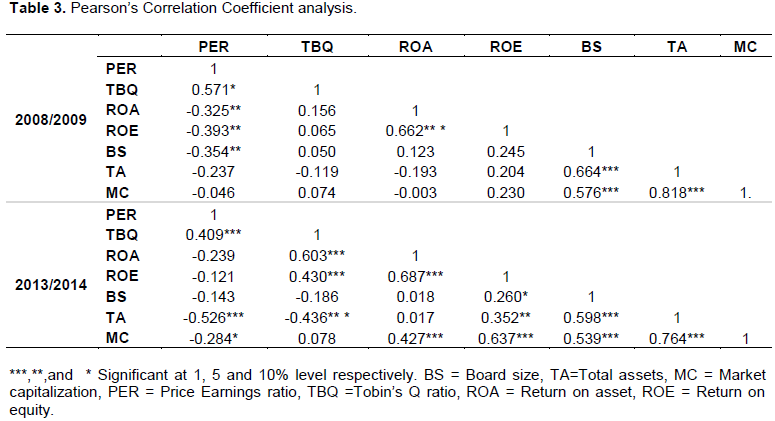
Table 3 shows the results of Spearman's correlation analysis which was used to examine the relationship between the board size control variables (TA and MC) and company financial performance variables (ROE, ROA, TBQ and PER)
According to the correlation results in Table 3 the following pair of variables exhibited significant correlation at 1% significance in 2008/2009, ROA and ROE with a coefficient of 0.66, PER and TBQ with correlation coefficient of 0.57, board size and total assets with correlation coefficient of 0.66, board size and total assets with correlation coefficient of 0.58. The pair of variables that displayed significant correlation at 5% significance were PER and ROA with correlation coefficient of -0.33, PER and ROE with correlation coefficient of -0.39, PER and board size with correlation coefficient of -0.35, and total assets and market capitalization with correlation coefficient of 0 82. From the results for 2013/2014 in Table 3, the following variables exhibited significant correlation at 1% significance: PER and TBQ with correlation coefficient of 0.41, PER and total assets with correlation coefficient of -0.53, PER and total assets with correlation coefficient of -0.28, TBQ and ROA with correlation coefficient of 0.60, TBQ and ROE with correlation coefficient of -0.43, TBQ and total assets with correlation coefficient of -0.44, ROA and ROE with correlation coefficient of 0.69, ROA and market capitalization with correlation coefficient of 0.43, ROE and board size with correlation coefficient of 0.26, ROE and total assets with correlation coefficient of 0.35, ROE and market capitalization with correlation coefficient of 0.64, board size and total assets with correlation coefficient of 0.60, board size and market capitalization with correlation coefficient of 0.54, and total assets and market capitalization with correlation coefficient of 0.76. The above correlation figures indicate lower correlations between the dependent and independent variables and some lacked significant correlations.
Regression results
This study adopted OLS regression analysis which is considered a straightforward method of statistical analysis (Bryman and Bell, 2015). The OLS regression analysis results are discussed below.
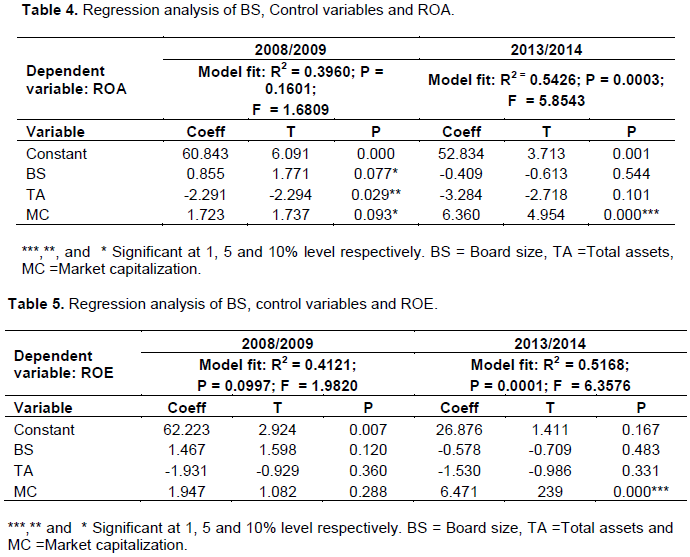
Board size, control variables and ROA
Table 4 presents a summary of the regression results on the relationship between ROA, Board size and control variables in 2008/2009 and 2013/2014. The 2008/2009 results showed an adjusted R-squared value of 0.40, which indicates that about 40% of the total variability in ROA can be explained by board size, total assets and market capitalization. Board size had a statistically significant positive influence on ROA (p=0.08<0.10), hence an increase in board size by one member would results in an increase in the ROA by 86%, holding all other factors constant. The F test result indicates that all variables in aggregate are not statistically significant in influencing ROA (F = 1.68, p = 0.16>0.10). On the other hand, the 2013/2014 results (Table 4), show an adjusted R-squared value of 0.54, which indicates a better model fit than in 2008/2009. This means that, about 54% of the total variability in ROA is explained by Board size, total assets and market capitalization. The F test result for the regression model in 2013/2014 indicates that all variables in aggregate have a statistically significant influence on ROA (F= 5.85, p = 0.00<0.01). This suggests that board size together with the control variables is more relevant to ROA in 2013/2014 than in 2008/2009. The OLS regression results (Table 4.) indicates that board size had a statistically significant positive influence on ROA in 2008/2009 but no statistically significant influence in 2013/2014. The estimated coefficient for board size in 2008/2009 suggests that an additional director on the board contributes 86% to ROA, holding other variables constant. On the contrary, the contribution from an additional director on the board in 2013/2014 diminishes ROA by 41%, although this impact was not statistically significant.
Board size, control variables and ROE
Table 5 presents a summary of regression results on the relationship between ROE, as the dependent variable, board size and control variables in 2008/2009 and 2013/2014. As shown in Table 5 in 2008/2009, the OLS regression results showed an adjusted R-squared value of 0.41, which suggests that about 41% of the total variability in ROE is explained by Board size, total assets and market capitalization. The F test result indicated that all variables jointly influence ROE (F = 1.98, p = 0.09<0.10). Board independence had a statistically significant negative influence on ROE (p=0.05<0.10), hence, an increase in Board size by one percent would result in a decrease in the ROE of 25%, holding other independent and control variables constant. On the other hand, the results for 2013/2014 (Table 5) presented an adjusted R-squared value of 0.52, which shows a better model fit than 2008/2009. The adjusted R-squared results indicate that during 2013/2014, about 52% of the total variability in ROE could be attributed to Board size, total assets and market capitalization. The F test result also indicated that all variables jointly influenced ROE (F= 6.34, p = 0.00<0.01). Although the market capitalization (a control variable) is the only variable that had a statistically significant positive influence on ROE (p=0.00<0.01) in 2013/2014, the adjusted R-squared suggests that the board size, together with the control variables, have more relevance in explaining ROE in 2013/2014 than in 2008/2009.
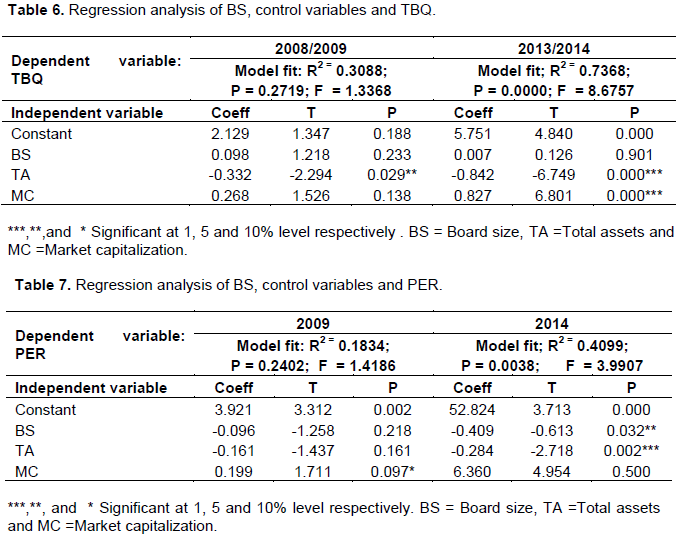
Board size, control variables and TBQ
Table 6 presents a summary of regression results on TBQ, Board size, total assets and market capitalization in 2008/2009 and 2013/2014. According to the OLS regression results in Table 6 the adjusted R-squared value in 2008/2009 was 0.31, which suggests that about 31% of the total variability in TBQ can be explained by Board size, total assets and market capitalization. The F test result indicated that all variables in aggregate do not have a statistically significant influence on TBQ in 2008/2009 (F = 1.34, p = 0.27>0.10). The 2013/2014 results, shows an adjusted R-squared value of 0.74, which demonstrates a better model fit, than 2008/2009. In other words, in 2013/2014 about 74% of the total variability in TBQ can be explained by Board size, total assets and market capitalization. The F test result also indicated that all variables in aggregate have a statistically significant influence on TBQ (F= 8.68, p = 0.00<0.01). This improvement in the model fit and model significance suggests that Board size, total assets and market capitalization have more relevance in explaining TBQ in 2013/2014 than in 2008/2009.
Board size, control variables and PER
Table 7 presents a summary of regression results on the relationship between PER as the dependent variable, board size and control variables in 2008/2009 and 2013/2014. The 2008/2009 results (Table 7.) show an adjusted R-squared value of 0.18, which means that during 2008/2009, about 18% of the total variability in PER is explained by board size, total assets and market capitalization. The F test result indicates that all variables in aggregate do not have a statistically significant influence on PER (F= 1.42, p = 0.24>0.10). According to the 2013/2014 results, the adjusted R-squared value was 0.41, which indicates a better model fit than 2008/2009. This shows that about 41% of the total variability in PER in 2013/2014 can be explained by Board size, total assets and market capitalization. The F test results also indicates that all variables in aggregate have a statistically significant influence on PER (F= 3.99, p = 0.00). Board size had a statistically significant negative influence on PER (p=0.03<0.05) suggesting that an increase in board size by one member would result in a decrease in PER by 40.9%, holding other independent and control variables constant. The composite of PER (price per share and earning per share) offers two possible explanations for this negative relationship between PER and board size; either earning per share increases as board size increases, or price per share deceases as board size increases. This implies that the EAC markets in 2013/2014 tended to react positively to smaller board size and negatively to larger board size.
Control variables
As mentioned above, we used total assets and market capitalization as control variables in the regression models to statistically adjust their effects on company financial performance and thereby estimate the effects of board size on the study variables. We observed some significant relationships between the control variables and companies’ financial performance indicators. For example, in 2008/2009 (Table 4.), the total assets had a statistically significant negative influence on ROA (p=0.03<0.05) while the market capitalization had a statistically significant positive influence on ROA (p=0.09<0.10). However, in 2013/2014 (Table 4), only the market capitalization had a statistically significant positive influence on ROA (p=0.00<0.01). Furthermore, no control variable significantly influenced ROE in 2008/2009. However, in 2013/2014 (Table 5), the market capitalization had a statistically significant positive influence on ROE (p=0.00<0.01). In 2008/2009 (Table 6), the total assets had a statistically significant negative influence on TBQ (p=0.03<0.05). However, in 2013/2014 (Table 6), the market capitalization had a statistically significant positive influence on TBQ (p=0.00<0.01) while the total assets had a statistically significant negative influence on TBQ (p=0.00<0.01). Furthermore, according to the results in Table 7 the market capitalization had a statistically significant positive influence on PER (p=0.09<0.10). The total assets also had a statistically significant negative influence on PER (p=0.00<0.01).
The main objective of this study was to examine the influence of board size on the financial performance of listed companies within the EAC and make recommendations on the board size that can enhance company financial performance within the EAC. Results from the regression analysis (Tables 4 to 7) indicated some significant relationships between board size and ROA, and board size and PER in 2013/2014 but no significant relationship between board size and ROE and TBQ in 2008/2009 and 2013/2014. The estimated coefficients in the series of regression models (Tables 4 to 7) appear to indicate that company financial performance deteriorated in 2013/2014 when the average board size increased to 9.2 directors. The regression results (Tables 4 to 7) suggest that larger board size has a negative impact on company financial performance. The descriptive statistics (Table 2) appear to suggest that the optimal board size in EAC-listed companies is no more than nine members. This thus supports the recommendation by Firstenberg and Malkiel (1994), who suggests an optimal board size of 9 members to encourage board participation, focus, interaction and effective debate. Furthermore, Dalton et al. (1999) posits that an optimal board is often cohesion, which creates a good working relationship between directors. This makes is less difficult for the directors to reach a consensus (Lipton and Lorsch, 1992). Moreover, an optimal board makes it easy to make quick decisions due to shorter time required achieve board agreement (Muth and Donaldson, 1998). Lipton and Lorsch (1992) identified dysfunctional behavioral norms and higher monitoring costs associated with a large board, while Goodstein et al. (1994) submitted that a big board faces problems of internal power struggle and bickering that hinders board business about advisory and monitoring functions (Nguyen et al., 2016). Our findings are also consistent with Lipton and Lorsch (1992) who recommended optimum board size of eight to nine directors and Jensen (1993) recommended optimum board size of seven or eight directors.
A number of limitations were identified in this study. Firstly, we used a sample of forty-two listed companies from the EAC stock markets during the study period. Nevertheless, most companies in Tanzania, Rwanda, and Uganda were never listed on their respective stock market until after 2010 and hence were left out of this sample. Again, the current study used financial data from only listed companies, we excluded private companies and other small and medium enterprises which are also effected by board size. Moreover, the financial data used in this study was extracted from private databases (DataStream and Eikon) hence most companies whose data was missing out from these databases were left out of this study. Finally, the study used some accounting- based and market-based performance measures. The selection of these measures was based on previous research. Using different performance measures could possibly result in different results. We thus recommend that future studies consider using data from un-listed companies, SME’s, or adopt different financial and non- financial performance indicators to test the influence of board size on company performance. The findings from this study will help in improving the existing codes of governance and to enhance the firm’s financial performance in Africa in general and the EAC in particular. However, the study’s findings revealed a lack of consistently significant relationships between the dependent and independent variables, which can be attributed to the fact that some EAC countries had not adequately adapted to the EAC common market at the time of the study, hence their respective listed companies were not in a position to align their organizational structure and enhance their financial performance. Nevertheless, this study provides new knowledge about board size in the EAC countries before and after the operationalization of the EAC common market in 2010.
The authors have not declared any conflict of interest.
REFERENCES
|
Alagha HS (2016). Corporate governance practices and firm performance of listed companies including Islamic financial institutions in the United Arab Emirates. Doctoral dissertation, Victoria University.
|
|
|
|
Baier SL, Dwyer Jr GP, Tamura R (2004). Does opening a stock exchange increase economic growth? Journal of International Money and Finance 23(3):311-331.
Crossref
|
|
|
|
|
Baty F, Ritz C, Charles S, Brutsche M, Flandrois JP, Delignette-Muller ML (2015). A Toolbox for Nonlinear Regression in R: The Package nlstools. Journal of Statistical Software 66(5):1-21.
Crossref
|
|
|
|
|
Bhaduri SN, Selarka E (2016). Corporate Governance: An Overview. In: Corporate Governance and Corporate Social Responsibility of Indian Companies (pp. 1-10). Springer, Singapore.
Crossref
|
|
|
|
|
Bonn I, Yoshikawa T, Phan PH (2004). Effects of board structure on firm performance: A comparison between Japan and Australia. Asian Business and Management 3(1):105-125.
Crossref
|
|
|
|
|
Bowerman BL, O'Connell RT, Orris JB (2003). Business statistics in practice. McGraw-Hill/Irwin.
|
|
|
|
|
Bryman A, Bell E (2015). Business research methods, Oxford University Press, USA.
|
|
|
|
|
Cheng S (2008). Board size and the variability of corporate performance. Journal of Financial Economics 87(1):157-176.
Crossref
|
|
|
|
|
CMA K (2002). Guidelines on Corporate Governance in public listed Companies in Kenya. Kenya Gazette Notice No. 369, 122, vol. 128.
|
|
|
|
|
Coles JL, Daniel ND, Naveen L (2008). 'Boards: Does one size fit all?' Journal of Financial Economics 87(2):329-356.
Crossref
|
|
|
|
|
Dalton DR, Daily CM, Johnson JL, Ellstrand AE (1999). Number of directors and financial performance: A meta-analysis. Academy of Management Journal 42(6):674-686.
Crossref
|
|
|
|
|
Fama EF (1980). Agency Problems and the Theory of the Firm. Journal of Political Economy 88(2):288-307.
Crossref
|
|
|
|
|
Field A (2009). Discovering statistics using SPSS, Sage publications.
|
|
|
|
|
Firstenberg PB, Malkiel BG (1994). The twenty-first century boardroom: who will be in charge? Sloan Management Review 36(1):27.
|
|
|
|
|
Gabrielsson J (2007). Boards of directors and entrepreneurial posture in medium-size companies - Putting the board demography approach to a test. International Small Business Journal 25(5):511-537.
Crossref
|
|
|
|
|
Goodstein J, Gautam K, Boeker W (1994). The Effects of Board Size and Diversity on Strategic Change. Strategic Management Journal 15(3):241-250.
Crossref
|
|
|
|
|
Gross K (2007). Equity ownership and performance: An empirical study of German traded companies. Springer Science and Business Media.
|
|
|
|
|
Hall JH, Brummer L (1999). The relationship between the market value of a company and internal performance measurements.
Crossref
|
|
|
|
|
Hayes AF, Cai L (2007). Using heteroskedasticity-consistent standard error estimators in OLS regression: An introduction and software implementation. Behavior Research Methods 39(4):709-722.
Crossref
|
|
|
|
|
Heenetigala K (2011). Corporate governance practices and firm performance of listed companies in Sri Lanka. Doctoral dissertation, Victoria University.
|
|
|
|
|
Hermalin BE, Weisbach MS (1991). The Effects of Board Composition and Direct Incentives on Firm Performance. Financial Management 20(4):101-112.
Crossref
|
|
|
|
|
Ilmolelian P (2005). The determinants of the Harare Stock Exchange (HSE) market capitalization. Available at:
View
|
|
|
|
|
Ingram RW, Albright TL (2006). Financial Accounting: Information for Decisions: Information for Decisions. Cengage Learning.
|
|
|
|
|
Jensen MC (1993). The Modern Industrial-Revolution, Exit, and the Failure of Internal Control-Systems. Journal of Finance 48(3):831-880.
Crossref
|
|
|
|
|
Jensen MC, Meckling WJ (1976). Theory of the firm: Managerial behavior, agency costs and ownership structure. Journal of Financial Economics 3(4):305-360.
Crossref
|
|
|
|
|
Johnson JL, Daily CM, Ellstrand AE (1996). Boards of directors: A review and research agenda. Journal of Management 22(3):409-438.
Crossref
|
|
|
|
|
Leng ACA (2004). The impact of corporate governance practices on firms' financial performance: Evidence from Malaysian companies. ASEAN Economic Bulletin 21(3):308-318.
Crossref
|
|
|
|
|
Lesakova L (2007). Uses and limitations of profitability ratio analysis in managerial practice. In International Conference on Management, Enterprise and Benchmarking, pp. 1-2.
|
|
|
|
|
Lins KV (2003). Equity ownership and firm value in emerging markets. Journal of Financial and Quantitative Analysis 38(1):159-184.
Crossref
|
|
|
|
|
Lipton M, Lorsch JW (1992). A Modest Proposal for Improved Corporate Governance. Business Lawyer 48(1):59-77.
|
|
|
|
|
Muth M, Donaldson L (1998). Stewardship theory and board structure: A contingency approach. Corporate Governance: An International Review 6(1):5-28.
Crossref
|
|
|
|
|
Mwanzia Mulili B (2014). Corporate governance in Kenya's public universities. Journal of Applied Research in Higher Education 6(2):342-357.
Crossref
|
|
|
|
|
Nguyen P, Rahman N, Tong A, Zhao R (2016). Board size and firm value: evidence from Australia. Journal of Management and Governance 20(4):851-873.
Crossref
|
|
|
|
|
Okiro K (2014). Corporate governance, capital structure, regulatory compliance and performance of firms listed at the East African community securities exchange. Doctoral dissertation, University of Nairobi, Kenya.
|
|
|
|
|
Porter ME (2008). Competitive advantage: Creating and sustaining superior performance. Simon and Schuster.
|
|
|
|
|
Richard PJ, Devinney TM, Yip GS, Johnson G (2009). Measuring organizational performance: Towards methodological best practice. Journal of Management 35(3):718-804.
Crossref
|
|
|
|
|
RSE (2015). Background: Rwanda stock exchange (RSE) Available at:
View
|
|
|
|
|
Shapiro SS, Wilk MB (1965). An analysis of variance test for normality (complete samples). Biometrika 52(3/4):591-611.
Crossref
|
|
|
|
|
Shleifer A, Vishny RW (1997). A survey of corporate governance. Journal of Finance 52(2):737-783.
Crossref
|
|
|
|
|
Tabachnick BG, Fidell LS (2006). Using multivariate statistics, 5 edn, Pearson.
|
|
|
|
|
Tobin J (1984). A mean-variance approach to fundamental valuations. The Journal of Portfolio Management 11(1):26-32.
Crossref
|
|
|
|
|
Tshipa J (2015). The South African code of corporate governance. The relationship between compliance and financial performance: Evidence from South African publicly listed firms. Corporate Ownership and Control 12(2):149-169.
Crossref
|
|
|
|
|
Veal AJ (2005). Business research methods: A managerial approach. Pearson Education Australia/Addison Wesley.
|
|
|
|
|
Watson PK, Teelucksingh SS (2002). A practical introduction to econometric methods: Classical and modern. University of West Indies Press.
|
|
|
|
|
Yabara M (2012). Capital market integration: progress ahead of the East African community monetary union, IMF Working Paper, no. 12/18.
Crossref
|
|
|
|
|
|
|
Yartey CA, Adjasi CK (2007). Stock market development in Sub-Saharan Africa: Critical issues and challenges. International Monetary Fund.
Crossref
|
|
|
|
|
Yermack D (1996). Higher market valuation of companies with a small board of directors. Journal of Financial Economics 40(2):185-211.
Crossref
|
|