ABSTRACT
This study was designed to demonstrate the relationship between 25-hydroxy vitamin D (25(OH)D) levels and insulin resistance (IR) in normal pregnancy and in gestational diabetes mellitus (GDM). The study included 103 pregnant women classified into two main groups: normal pregnant (n= 48) and GDM (n= 55). Further classification for each group was carried out based on 25(OH)D status (deficient, insufficient and sufficient). Serum were used for determination of fasting blood glucose (FBG), fasting insulin (FI), C-peptide, cholesterol, triacylglycerol (TAG), total Ca, 25(OH)D and parathyroid hormone (PTH). IR markers were calculated including glucose/insulin ratio (G/I), fasting insulin resistance index (FIRI), and homeostasis model assessment of insulin resistance (HOMA-IR), Log HOMA-IR, HOMAA1-% B, and HOMA β cell. Results indicated significantly increased FBG, FI, C-peptide, FIRI, HOMA-IR, Log HOMA-IR and HOMA β cell, cholesterol and TAG in GDM compared to control group. Mean values of 25(OH)D did not show significant variations between the two groups. In control group, no significant correlations were obtained between 25(OH)D and any tested parameters, however, in GDM 25(OH)D showed significant correlations with FBG and Log HOMA-IR. Results also revealed increased prevalence of 25(OH)D deficiency among healthy pregnancy and GDM (~69 and 67%, respectively) groups. Furthermore, deficient GDM had significantly higher FBG, IR markers, cholesterol and TAG compared to matched deficient normal pregnancy. Improving 25(OH)D status had significantly normalizes IR and lipid parameters, indicating that 25(OH)D may be associated with elevated IR that accompany GDM.
Key words: Gestational diabetes mellitus, vitamin D, insulin resistance, calcium homeostasis.
Vitamin D has various physiological roles, beside its calcitropic effects. It appears to be important in endocrine, autocrine and paracrine functions. The role of vitamin D in innate immunity is well documented, where deficiency can lead to autoimmune conditions, as type I diabetes mellitus (Taskiran et al., 2017; Mathieu et al., 2005). 25-Hydroxy vitamin D [25(OH)D] is one of the major markers for identifying vitamin D status (Hollis, 1996).
The primary source of vitamin D is the sun, which is synthesized endogenously in skin to produce cholicalciferol (vitamin D3), although a small part of vitamin D is obtained from the diet in the form of vitamin D2 (ergocalciferol) and vitamin D3 (Holick, 2006).
Most tissues have receptors for both vitamin D and its active metabolite; 1, 25-dihydroxy vitamin D [1, 25 (OH)2 D]; indicating other functions for vitamin D beside its role in bone metabolism and calcium hemostasis (Holick, 2002; Chiu et al., 2004). Significant improvement in insulin sensitivity is noticed when serum levels of vitamin D increased up to 75 nmol/L (Inzucchi et al., 1998). Furthermore, low levels of vitamin D are detected in type II diabetes mellitus patients (Baynes et al., 1997) and in general is associated with obesity and insulin resistance (IR); therefore, it may have a role in the pathogenesis of type 2 diabetes mellitus (T2DM) (Hahn et al., 2006; Lima-Martínez et al., 2017).
Gestational diabetes mellitus (GDM) is a carbohydrate intolerance of variable degrees of severity, which start or first recognize during pregnancy (American Diabetes Association, 2004). The prevalence ranges of GDM from 1 to 14% of all pregnancies, depending on the diagnostic tests and the population studied and criteria employed (Wittamer et al., 2003). In Saudi Arabia, the prevalence of GDM ranges from 3.8 to 12.5% according to the American Diabetes Association and World Health Organization criteria, respectively (Al-Rowaily and Abolfotouh, 2010). The pathogenesis of gestational diabetes mellitus, as in T2DM, involves the combination of relative insulin deficiency and insulin resistance (Kuhl 1991).
Although plenty of sunlight are available in our area, however, traditional clothes, dietary preferences and decreased physical activity might contribute to low levels of vitamin D, which is common among Saudi populations. The aim of the current study was to investigate the relationship between vitamin D levels and markers of insulin resistance in normal pregnancy and pregnant women complicated with GDM.
Subjects
This study was approved by Directorate of Health Affairs, Jeddah, Saudi Arabia. Blood samples were obtained from Maternity and Children's Hospital, Al-Mesadiah. All pregnant women complicated with GDM were requested to perform oral glucose tolerance test (OGTT) using 100 g% glucose solution. Gestational diabetes mellitus was diagnosed according to World Health Organization (WHO, 1999). Participants were provided with a questionnaire included: name, age, weight, height, blood pressure, maternal and gestational ages, number of pregnancies and miscarriage. Body mass index (BMI) was calculated at sampling time (BMI= weight/height2, kg/m2). The exclusion criteria were: presence of urinary tract infection, preeclampsia, hypertension, fever (>37.5°C), fetal/placental abnormalities, alcohol intake, and previous medical and gynecological maternal history. Almost all GDM women included in the study were treated with nutrition therapy except 7 cases were treated with insulin therapy.
Study design
One hundred and three pregnant women (48 normal pregnant women and 55 pregnant women with GDM) were randomly selected with no history of diabetes; type 1 or type 2. Classifications of all participants were based on pregnancy status. All pregnant women included were categorized into two main groups. The normal pregnant group, this group included 48 women with normal pregnancy. Their ages ranged from 18 to 41 years and gestation age ranged from 17 to 40 weeks. The pregnant women complicated with GDM, this group included 55 pregnant women with GDM. Their ages ranged from 21 to 45 years and gestation age ranged from 18 to 39 weeks. Further classification of each group was carried out based on 25(OH)D status. Pregnant women either with normal pregnancy or with GDM were classified according to their 25(OH)D status into three subgroups as follows: Deficient 25(OH)D subgroup, this group included pregnant women either with normal pregnancy or pregnancy complicated with GDM with serum 25(OH)D level < 30 nmol/L; Insufficient 25(OH)D subgroup, this group included pregnant women either with normal pregnancy or pregnancy complicated with GDM with serum 25(OH)D level range from 30 to <50 nmol/L; Sufficient 25(OH)D subgroup, this group included pregnant women either with normal pregnancy or pregnancy complicated with GDM with serum 25(OH)D level range from 50 to 80 nmol/L.
Methods
After overnight fasting, whole blood was collected from each patient. Blood sample was divided into two parts. First part for blood glucose measurement and the second part for serum collection. Sera were divided into aliquots and kept at -20°C pending assay to avoid freezing and thawing. Sera were used for determination of fasting insulin, C-peptide, lipid profile parameters, calcium and calcium homeostasis.
Biochemical assays
Blood glucose (BG)
Blood glucose (BG) was determined using kit provided by Siemens Healthcare Diagnostic Limited, UK (Catalog Number k1039).
Markers of insulin resistance
All markers were quantified and calculated according to Singh and Saxena (2010).
Serum Insulin: Fasting insulin (FI) levels were determined using electrochemiluminescence immunoassay technique employing a kit purchased from Cobas (Catalog Number 12017547 122). The lower detection limit of the employed kit was 0.2 µl/ml (1.39 pmol/L).
Serum C-peptide: C-peptide levels were determined using electrochemiluminescence immunoassay technique employing a kit purchased from Cobas (Catalog Number 03184897 190). The lower detection limit of the employed kit was 0.003 nmol/L (0.010 ng/ml).
Glucose/Insulin ratio:The glucose/insulin (G/I) ratio was calculated by dividing results obtained from FG (mmol/L)/FI (μU/mL).
HOMA-IR: HOMA-IR was calculated using the following equation:
HOMA-IR= (Glucose mmol/L × Insulin µU/L) / 22.5
The constant of 22.5 is a normalizing factor; that is, the product of normal fasting insulin of 5 μU/mL, and the normal fasting glucose of 4.5 mmol/L typical of a "normal" healthy individual = 22.5.
Log (HOMA-IR): Log (HOMA-IR) transforms the skewed distribution of fasting insulin values to determine a much stronger linear correlation with glucose clamp estimates of insulin sensitivity when extensive ranges of insulin sensitivity / resistance are being studied (Duncan et al., 1995).
Fasting insulin resistance index (FIRI): FIRI was formulated by Duncan et al. (1995) for estimation of insulin resistance. This was calculated by the equation:
FIRI = (fasting glucose mmol× fasting insulin μU/mL) / 25.
Lipid profile: Markers of lipid profile were determined using specific kit for each. Determination of serum cholesterol using kit provided by Siemens Healthcare Diagnostic Limited, UK (Catalog Number k1027). Serum of triglycerides using kit supplied provided by Siemens Healthcare Diagnostic Limited, UK (Catalog Number k2069).
Markers Calcium Homeostasis: Markers calcium homeostasis included determination of serum total calcium (Ca) using kit provided by Siemens Healthcare Diagnostic Limited, UK (Catalog Number k1023). Serum parathyroid hormone (PTH) using electrochemiluminescence immunoassay technique employing a kit purchased from Cobas (Catalog Number 11972103122). The lower detection limit of the employed kit was 1.20 pg/ml (0.127 pmol/L) and serum vitamin D using electrochemiluminescence immunoassay technique employing a kit purchased from Cobas (Catalog Number 05894913 190). The lower detection limit of the employed kit was 3 ng/ml (7.50 nmol/L).
Statistical analysis
Statistical analysis was performed using SPSS 22.0 for windows (SPSS Inc, USA). Descriptive statistics are shown as mean ± standard error (SE) of the mean. Pearson's correlation was used to measure how vitamin D related with GA, FBG, FI, C-Peptide, G/I, FIRI, HOMA-IR, Log HOMA-IR, HOMAA1-%B, HOMA β cell, Ca and PTH in all groups. Independent-Samples T Test "t" was performed for comparing means for two groups. Independent-Samples’ Mann-Whitney (U) test was used to compare the medians of two groups of ordinal, non-parametric data to determine if they are statistically different. P value less than 0.05 was considered statistically significant.
Results obtained from classification based on pregnancy status
Subjects' characteristics
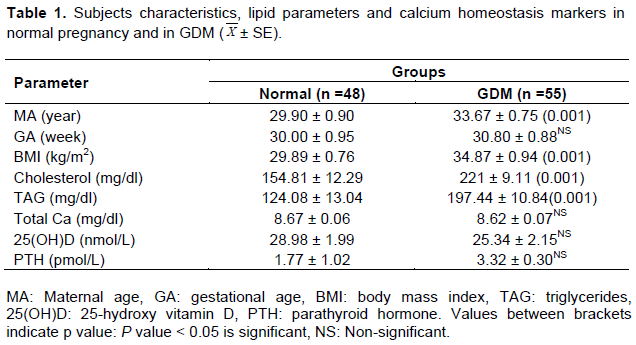
Results revealed that pregnancies complicated with GDM had significantly higher maternal age and were presented with increased BMI compared to matched normal pregnancy group; however, both groups were matched for gestational age (Table 1).
Lipid parameters and calcium homeostasis markers
Data obtained from this study revealed significantly higher means for cholesterol and TAG in pregnancy complicated with gestational diabetes mellitus compared to normoglycemic group. On the other hand, the mean values of total serum calcium, 25 hydroxyvitamin D and parathyroid hormone were matched between the two studied groups (Table 1).
Fasting blood glucose and markers of insulin resistance
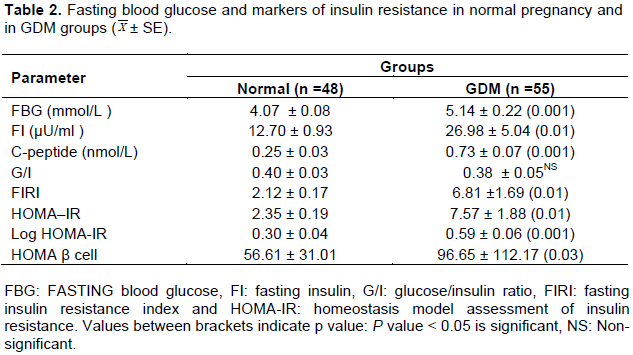
Compared to normal pregnancy, pregnant group with GDM had elevated fasting blood glucose and markers of insulin resistance (fasting insulin, C-peptide, fasting insulin resistance index, Homeostasis model assessment markers including HOMA-IR, Log HOMA-IR and HOMA β cell) (Table 2).
Person's correlations
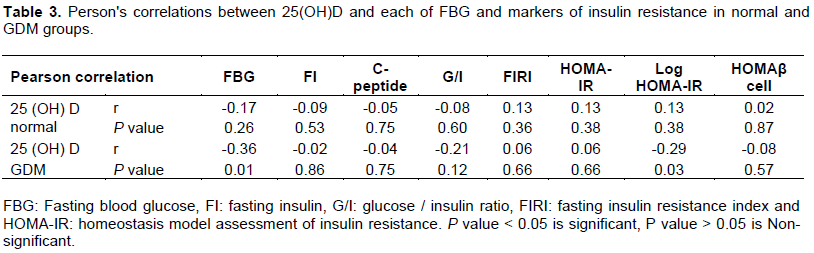
Between 25(OH)D and markers of IR: In normal pregnancy, 25(OH)D3 was not correlated with any of the tested markers. On the other hand, in pregnancies complicated with GDM, 25(OH) D was significantly correlated with FBG (P = 0.01) and Log HOMA-IR (P = 0.03) (Table 3).
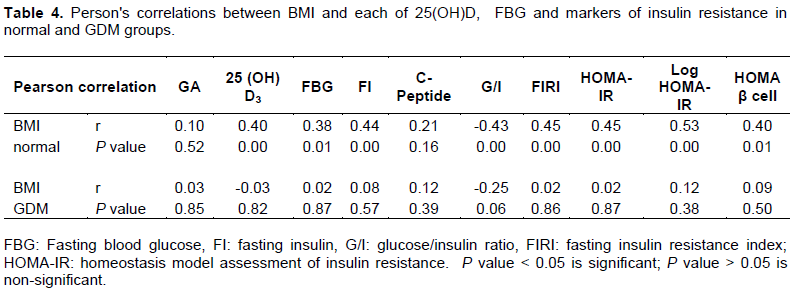
Between BMI and each of 25(OH)D and markers of IR: BMI was significantly correlated with FBG, FI, G/I, FIRI, HOMA-IR and 25(OH)D in normal pregnancy, however, pregnancy complicated with GDM showed no significant correlations between BMI and other variables (Table 4).
Results obtained from classifications based on 25(OH) D status
According to vitamin D levels, both normal and GDM volunteers were classified into three groups (deficient, insufficient and sufficient groups).
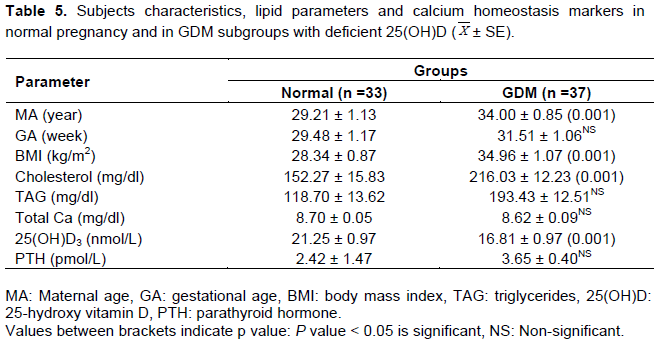
Deficient group [25 (OH)D > 30 nmol/L]
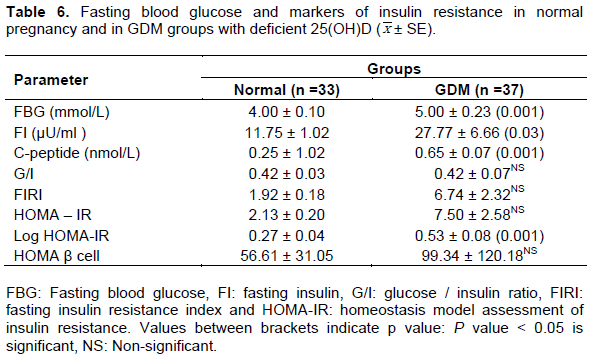
Significant elevations in the mean values of MA and BMI were noted in deficient GDM subjects compared to control (Table 5). Results also revealed that in GDM subjects with deficient vitamin D, the mean values of cholesterol and TAG were significantly higher than control subjects, while 25(OH)D showed significantly reduced mean value compared to normoglycemic pregnancy. Total serum Ca and PTH mean values showed non-significant variation between deficient GDM and matched control groups (Table 5). Significant increase in the mean values of FBG, FI, C-peptide and log HOMA-IR were detected in deficient GDM relative to normal pregnancy with deficient vitamin D group, while other insulin resistance markers did not show variations (Table 6).
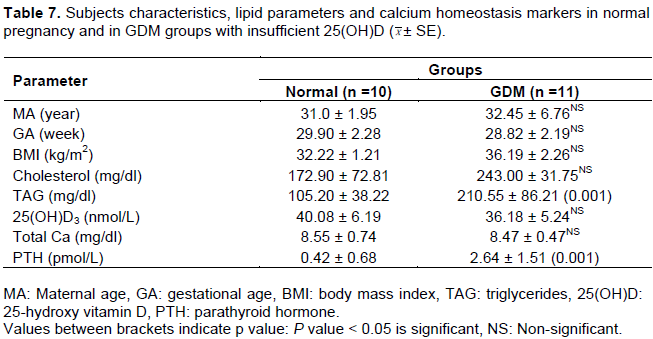
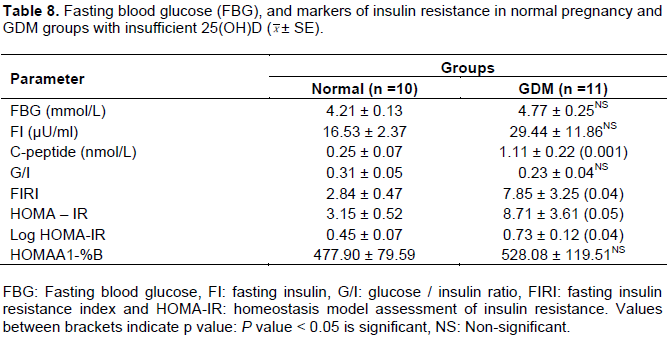
Insufficient groups
All patients' characteristics were matched between insufficient GDM and matched normal pregnancy groups (Table 7). Moreover, in GDM, the mean values of TAG and PTH were higher than control values while no significant difference in cholesterol, total calcium and 25(OH)D mean values were noted between the two groups (Table 7). Results indicated that insufficient GDM group was presented with significantly higher mean of C-peptide, FIRI and Log HOMA-IR compared to matched control, however, no variations in FBG and other IR markers were noted (Table 8).
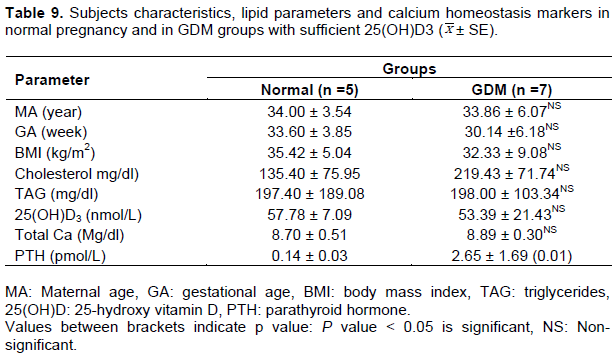
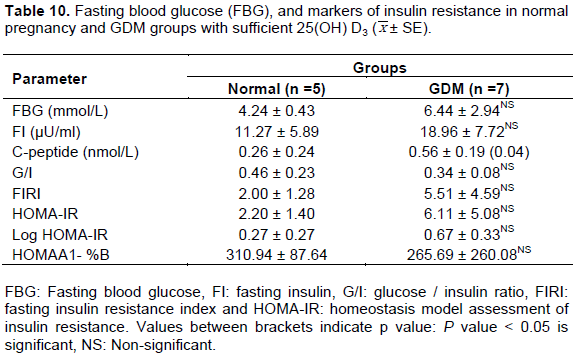
Sufficient groups
Comparing the mean values of all parameters between normoglycemic control with sufficient vitamin D and sufficient 25(OH)D GDM subjects revealed only significant elevation in C-peptide (Table 10) and PTH (Table 9), however, other parameters in GDM were comparable to normal group.
Gestational diabetes mellitus (GDM) is a common complication of pregnancy, characterized by increased insulin resistance (IR), mainly in 2nd and 3rd trimesters of pregnancy (Barbour et al., 2007). The imbalance between IR and insulin secretion led to maternal hyperglycemia. The present study, demonstrated significantly higher FBG and serum C-peptide in GDM subjects compared to normoglycemic group. Pronounced elevated IR was apparent in GDM group as manifested by elevated fasting insulin level, basal fasting insulin resistance index and homeostasis model assessment including HOMA-IR, log HOMA-IR and HOMAA1-%B. Obesity was suggested to be one of the factors that might contributed to the increased IR (Warnick et al., 1982). In this study, both normoglycemic and GDM groups were matched for gestational age; however, pregnant women complicated with GDM were presented with significantly higher mean value for BMI. Moreover, in normal pregnancy, BMI was significantly correlated with FBG and most markers of IR including FI, G/I, FIRI, HOMA-IR, log HOMA-IR, HOMA β cell. On the other hand, BMI in GDM did not show associations with FBG or insulin resistance markers. In addition, there was a lack of correlations between 25(OH)D and BMI in GDM subjects suggesting that BMI is unlikely to be a confounder. This finding supported previous reports by Talaei et al. (2013).
Another factor that might be implicated in maintaining normal IR during pregnancy is 25(OH)D. Circulating 25(OH)D is considered the most variable indicator of individual’s vitamin D status (Barrett and McElduff, 2010). In the present study, we failed to obtain significant differences in 25(OH)D mean values between GDM and normoglycemic control group. PleskaÄová et al. (2015) recently supported this observation. The authors observed no statistical difference in 25(OH)D levels between GDM and normal pregnancy. However, other contradictory studies indicated that 25(OH)D deficiency in pregnancy was related to the incidence of GDM, and serum 25(OH)D was significantly lower in women with GDM than in those with normal glucose tolerance (Soheilykhah et al., 2010; Burris et al., 2012; Alzaim and Wood, 2013). In the current study, it is worth to point out to the existence of significant negative correlations between 25(OH) D and each of FBG and log HOMA-IR in GDM group but not in normal pregnancy. This finding supported the association between 25 (OH) D and IR in GDM. The previous finding was supported by others (Maghbooli et al., 2008; Talaei et al., 2013), although another study (Kramer et al., 2014) indicated that vitamin D status in GDM was not associated with insulin sensitivity, β-cell function or gestational glucose tolerance.
25(OH)D may have two effects on insulin sensitivity; its role in the regulation of insulin receptor gene expression may modulate insulin resistance and its role in mediating calcium metabolism may be essential in the action of insulin. Calcium has an important function in mediating increased glucose transport activity induced by muscle contraction (Wright et al., 2004). The role of 25(OH) D in insulin resistance may be mediated by inflammation. Elevated TNF-α among GDM subjects, both at 2nd and 3rd trimesters, were reported by many studies (Gao et al., 2008; Ategbo et al., 2006; Noureldeen et al., 2014). Increased secretion of TNF-α was found to exert an inhibitory effect on insulin regulated glucose uptake in gestational diabetes mellitus, contributing to hypoglycemia sustainability (Festa et al., 1999). Furthermore, TNF-α has been shown to be a significantly independent predictor of IR in GDM (Kirwan et al., 2002).
The impact 25(OH)D status on IR markers in normal pregnancy and in GDM was another target in the present study. Further classifications of normal and GDM groups were carried out based on 25(OH)D statuses (deficient, insufficient and sufficient). In this study, higher prevalence of 25(OH)D deficiency and insufficiency were noted among normal (~69 and~ 21%, respectively) and GDM (~ 67% deficiency and ~20% insufficient) subjects. These results were recently reported (PleskaÄová et al., 2015), where 93.1% of normoglycemic control and 95.7% of GDM were 25(OH)D deficient. In another study, (Dovnik et al., 2014), about 50% of pregnant women were 25(OH)D deficient in September, while this value was elevated ~)82%) in December. Holmes et al. (2009) reported that 25(OH)D deficiency in Irish women occurred in 95% of pregnant women in the 12th week of pregnancy, 90% in 20th week and 66% in 35th week. A more recent study (Talaei et al., 2013) observed lower prevalence for 25(OH)D deficiency; ~40% in GDM subjects. Other authors (Maghbooli et al., 2008) reported higher prevalence of sever 25 (OH)D deficiency (≤ 12.5 ml/l) in GDM and in normal pregnancy among Iranian women. Several authors (Lau et al., 2011; Zuhur et al., 2013) reported same results of decreased 25(OH)D levels in GDM. Therefore, the variations in the incidence rate of 25(OH)D deficiency in pregnancy, either normal or GDM, could be due to gestational age, seasonal, geographical and ethnic variations. In the present investigation, both normal pregnancy and GDM groups were matched for gestational age, furthermore, the impact of seasonal variations on 25(OH)D levels between the two groups could be ruled out, since in our area, the sun is available most of the day time and all participants wear similar (traditional) clothes.
In the current work, it was demonstrated that in deficient GDM group, elevated FBG, IR markers, cholesterol and TAG were worsen compared to matched deficient normal pregnancy. In this group, 25(OH)D showed significantly lower mean value than normoglycemic control (P < 0.001). On the other hand, insufficient GDM group had comparable vitamin D mean value to normoglycemic control. Same trend was noted for mean values of FBG, most IR markers and cholesterol. Meanwhile, improving 25(OH)D levels (sufficient group) in pregnancy complicated with GDM normalizes FBG, IR makers, cholesterol and TAG (mean values became comparable to the control mean values). In general, improvement was noticed in IR parameters in GDM compared to control by improving 25(OH)D status. The present data are supported by other report indicating that the effect of 25(OH)D supplementation on improving IR was only significant when the concentration of vitamin D was 100 to 150 ml/l, and at lower dose it has no effect on IR (Talaei et al., 2013).
One limitation from the present study was decreased and unequal sample size after classification based on 25(OH)D statuses. We were unable to apply statistical analysis to compare the 3 subclasses (deficient, insufficient and sufficient) in each of GDM or normal pregnancy class, to explore the effect of 25(OH)D statuses on each group separately.
In Saudi pregnant women complicated with GDM, 25(OH)D was correlated with markers of IR which was not indicated in normal pregnancy. Deficient GDM had significantly higher FBG and IR markers compared to matched deficient normal pregnancy. Improving 25(OH)D status had significantly normalizes IR indicating an association between vitamin D and elevated IR that accompany GDM.
The authors have not declared any conflict of interests.
REFERENCES
|
Al-Rowaily MA, Abolfotouh MA (2010). Predictors of gestational diabetes mellitus in a high-parity community in Saudi Arabia. East. Mediterr. Health J. 16:636-641.
|
|
|
|
Alzaim M, Wood RJ (2013). Vitamin D and gestational diabetes mellitus. Nutr. Rev. 71:158-167.
Crossref
|
|
|
|
|
American Diabetes Association (ADA) (2004). Gestational diabetes mellitus. Diabetes Care 23:S88-S90.
|
|
|
|
|
Ategbo JM, Grissa O, Yessoufou A, Hichami A, Dramane KL, Moutairou K, Miled A, Grissa A, Jerbi M, Tabka Z, Khan NA (2006). Modulation of adipokines and cytokines in gestational diabetes and macrosomia. J. Clin. Endocrinol. Metab. 91:4137-4143.
Crossref
|
|
|
|
|
Barbour LA, McCurdy CE, Hernandez TL, Kirwan JP, Friedman JE (2007). Cellular Mechanisms for Insulin Resistance in Normal Pregnancy and Gestational Diabetes. Diabetes Care 30:112-118.
Crossref
|
|
|
|
|
Barrett H, McElduff A (2008). Vitamin D and pregnancy: An old problem revisited. Best Pract. Res. Clin. Endocrinol. Metab. 24:527-529.
Crossref
|
|
|
|
|
Baynes KC, Boucher BJ, Feskens EJ, Kromhout D (1997). Vitamin D, glucose tolerance and insulinaemia in elderly men. Diabetologia 40:344-347.
Crossref
|
|
|
|
|
Burris HH, Rifas-Shiman SL, Kleinman K, Litonjua AA, Huh SY, Rich-Edwards JW, Camargo CA Jr, Gillman MW (2012). Vitamin D deficiency in pregnancy and gestational diabetes mellitus. Am. J. Obstet. Gynecol. 207(3):1-8.
Crossref
|
|
|
|
|
Chiu KC, Chu A, Go VL, Saad MF (2004). Hypovitaminosis D is associated with insulin resistance and β cell dysfunction. Am. J. Clin. Nutr. 79:820-825.
|
|
|
|
|
Dovnik A, Mujezinović F, Treiber M, PeÄovnik Balon B, Gorenjak M, Maver U, TakaÄ I (2014). Seasonal variations of vitamin D concentrations in pregnant women and neonates in Slovenia. Eur. J. Obstet. Gynecol. Reprod. Biol. 181:6-9
Crossref
|
|
|
|
|
Festa A, Shnawa N, Krugluger W, Hopmeier P,Schernthaner G, Haffner SM (1999). Relative hypoleptinaemia inwomen with mild gestational diabetes mellitus. Diabetes Med. 16:656-662.
Crossref
|
|
|
|
|
Gao XL, Yang HX, Zhao Y (2008). Variations of tumor necrosis factor-alpha, leptin and adiponectin in mid-trimester of gestational diabetes mellitus. Chin. Med. J. 121:701-705.
|
|
|
|
|
Hahn S, Haselhorst U, Tan S, Quadbeck B, Schmidt M, Roesler S, Kimmig R, Mann K, Janssen OE (2006). Low serum 25-hydroxyvitamin D concentrations are associated with insulin resistance and obesity in women with polycystic ovary syndrome. Exp. Clin. Endocrinol. Diabetes 114(10):577-83.
Crossref
|
|
|
|
|
Holick MF (2006). Resurrection of vitamin D deficiency and rickets. J. Clin. Invest. 116:2062-2072.
Crossref
|
|
|
|
|
Holick MF (2002). Vitamin D: the underappreciated D-lightful hormone that is important for skeletal and cellular health. Curr. Opin. Endocrinol. Diabetes 9:87-98.
Crossref
|
|
|
|
|
Holick MF (2006). High prevalence of vitamin D inadequacy and implications for health. Mayo Clin. Proc. 81:353-373.
Crossref
|
|
|
|
|
Hollis BW (1996). Assessment of vitamin D nutritional and hormonal status: what to measure and how to do it. Calcif. Tissue Int. 58:4-5.
Crossref
|
|
|
|
|
Holmes VA, Barnes MS, Alexander HD, McFaul P, Wallace JM (2009). Vitamin D deficiency and insufficiency in pregnant women: a longitudinal study. Br. J. Nutr. 102:876-881.
Crossref
|
|
|
|
|
Inzucchi SE, Maggs DG, Spollett GR, Page SL, Rife FS, Walton V, Shulman GI (1998). Efficacy and metabolic effects of metformin and troglitazone in type II diabetes mellitus. N. Engl. J. Med. 338:867-872.
Crossref
|
|
|
|
|
Kirwan JP, Hauguel-De Mouzon S, Lepercq J, Challier JC, Huston-Presley L, Friedman JE, Kalhan SC, Catalano PM (2002). TNF- alpha is a Predictor of Insulin Resistance in Human Pregnancy. Diabetes 51(7):2207-2213.
Crossref
|
|
|
|
|
Kramer CK, Swaminathan B, Hanley AJ, Connelly PW, Sermer M, Zinman B, Retnakaran R (2014). Vitamin D and parathyroid hormone status in pregnancy: Effect on insulin sensitivity, β-cell function, and gestational diabetes mellitus. J. Clin. Endocrinol. Metab. 99(12):4506-4513.
Crossref
|
|
|
|
|
Kuhl C (1991). Insulin secretion and insulin resistance in pregnancy and GDM: implications for diagnosis and management. Diabetes 40:18-24.
Crossref
|
|
|
|
|
Lau SL, Gunton JE, Athayde NP, Byth K, Cheung NW (2011). Serum 25-hydroxyvitamin D and glycatedhaemoglobin levels in women with gestational diabetes mellitus. Med. J. Aust. 194:334-337.
|
|
|
|
|
Lima-Martínez MM, Arrau C, Jerez S, Paoli M, González-Rivas JP, Nieto-Martínez R, Iacobellis G (2017). Relationship between the Finnish Diabetes Risk Score (FINDRISC), vitamin D levels, and insulin resistance in obese subjects. Prim. Care Diabetes 11(1):94-100.
Crossref
|
|
|
|
|
Maghbooli Z, Hossein-Nezhad A, Karimi F, Shafaei AR, Larijani B (2008). Correlation between vitamin D3 deficiency and insulin resistance in pregnancy. Diabetes Metab. Res. Rev. 24:27-32.
Crossref
|
|
|
|
|
Mathieu C, Gysemans C, Giulietti A, Bouillon R (2005). Vitamin D and diabetes. Diabetologia 48(7):1247-1257.
Crossref
|
|
|
|
|
Noureldeen AF, Qusti SY, Al-seeni MN, Bagais MH (2014). Maternal leptin, adiponectin, resistin, visfatin and tumor necrosis factor-alpha in normal and gestational diabetes. Ind. J. Clin. Biochem. 4:462-470.
Crossref
|
|
|
|
|
PleskaÄová A, Bartáková V, Pácal L, Kuricová K, BÄ›lobrádková J, Tomandl J (2015). Vitamin D Status in Women with Gestational Diabetes Mellitus during Pregnancy and Postpartum. BioMed Res. Int. 2015:1-7.
Crossref
|
|
|
|
|
Soheilykhah S, Mojibian M, Rashidi M, Rahimi-Saghand S, Jafari F (2010). Maternal Vitamin D Status in Gestational Diabetes Mellitus. Nutr. Clin. Pract. 25:524-527.
Crossref
|
|
|
|
|
Talaei A, Mohamadi M, Adgi Z T (2013). The Effect of Vitamin D on Insulin Resistance in Patients with Type 2 Diabetes. Diabetol. Metab. Syndr. 5(1):8.
Crossref
|
|
|
|
|
Taskiran B, Cansu GB, Bahadir E, Mutluay R. (2017). Role of Vitamin D in Intima Media Thickness in Patients with Type 1 Diabetes Mellitus. J. Natl. Med. Assoc. 109(1):14-20.
Crossref
|
|
|
|
|
Warnick GR, Benderson J, Albers JJ (1982). Dextran sulfate- Mg2+ precipitation procedure for quantitation of high-density-lipoprotein cholesterol. Clin. Chem. 28:1379-1388.
|
|
|
|
|
Wittamer V, Franssen JD, Vulcano M, Mirjolet JF, Le Poul E, Migeotte I, Brézillon S, Tyldesley R, Blanpain C, Detheux M, Mantovani A, Sozzani S, Vassart G, Parmentier M, Communi D (2003). Specific recruitment of antigen-presenting cells by chemerin, a novel processed ligand from human inflammatory fluids. J. Exp. Med. 198(7):977-985.
Crossref
|
|
|
|
|
Wright DC, Hucker KA, Holloszy JO, Han DH (2004). Ca2+ and AMPK both mediate stimulation of glucose transport by muscle contractions. Diabetes 53(2):330-335.
Crossref
|
|
|
|
|
Zuhur SS, Erol RS, Kuzu, I, Altuntas Y (2013). The relationship between low maternal serum 25- hydroxyvitamin D levels and gestational diabetes mellitus according to the severity of 25-hydroxyvitamin D deficiency. Clinics 68(5):658-664.
Crossref
|
|