Full Length Research Paper
ABSTRACT
Surface water quality in Niger Delta has been impaired over the years as a result of oil exploration and exploitation carried out in the region. This study investigates the anthropogenic influence on the water quality of Odeama creek. Water samples were collected during the wet and dry season from 20 sampling points and four control points and analyzed following standard methods and procedures. No statistical difference (p> 0.005) at 95% confidence interval was observed between sampling points except for nitrate values in the dry season. Some of the results observed in this study are: pH range of 7.1 - 8.0 and 7.12 - 8.3; dissolved oxygen, 4.8 - 5.4 and 2.12 - 3.69 mg/L; chemical oxygen demand, 4.8 - 5.4L and 2.12 - 3.69 mg/L; polynuclear aromatic hydrocarbons, 0.01 - 0.17 and 0.05 - 1.06 mg/L for wet and dry season, respectively. Values observed from dissolved oxygen, chemical oxygen demand, polynuclear aromatic hydrocarbons, and heavy metals except copper indicated human influence on the water quality that may be due to domestic and industrial waste, illegal bunkering activities, and corrosion of abandoned vessels in the water-way. Regular monitoring of the physicochemical parameters and standard measures should be put in place to evaluate and control anthropogenic influence on the water quality.
Key words: Oil exploration, anthropogenic activities, Odeama, water quality.
INTRODUCTION
Surface water receives most contaminants from the terrestrial environment; the fate and effect of these pollutants may change before they eventually end up in the nearest water body. Surface water is a very important natural resource used for different purposes, and as such, its quality must be monitored and sustained. The sustainability of water quality through monitoring is crucial because anthropogenic activities produce pollutants that sometimes end up in water bodies (Boyd, 2015). Surface water quality in the Niger Delta has over the years been impaired as a result of oil exploration and exploitation in the region (Mogborukor, 2014). Odeama creek is situated in Brass Local Government Area of Bayelsa State, in the Niger Delta sub-region of Nigeria. The Odeama creeks water flows into the Atlantic Ocean. Odeama community has satellite communities which include Onyankiama, Ibidi, Ikpeyaigala, and Akabule situated along the creek. Asides from farming, which inhabitants of the community engage in because of their well-drained soil, which has high humus content, the people are also into palm oil production, canoe making, and fishing, which is done on an active scale because of the proximity of Odeama creek to the ocean. For all of these, they require that the water from the creek is of high quality. The Odeama community is host to oil exploration and exploitation. An oil and gas flow station was commissioned in 1983 which has been producing oil since it was commissioned and is still producing. The area is also known for illegal oil activities, locally known as bunkering or “kpo-fire".
Water quality is assessed by monitoring the physical, chemical, and biological parameters of water to ascertain its suitability for various purposes (Chapman and Kimstach, 1996). Dissolved Oxygen (DO) in water bodies must be sufficient to sustain aquatic species in it. It is a very important parameter used to assess the quality of water bodies (Ustaoglu and Tepe, 2019). According to Chapman and Kimstach (1996), DO in surface water below 5 mg/L may cause physiological stress in some aquatic species, and values below 2 mg/L may lead to the death of some aquatic species. Biological oxygen demand and chemical oxygen demand in water bodies are indicators of organic pollution (Edori et al., 2019). Polynuclear aromatic hydrocarbons (PAHs), benzene, toluene, ethylbenzene, and heavy metals are constituents of crude oil released into the environment as a result of oil spillage (Tamrakar and Pitre, 2000; Asejeje et al., 2021; Davies and Abolude, 2016). It is paramount that the concentration of these constituents is accessed in studies conducted in oil-producing communities to investigate the anthropogenic influence on water quality because of their toxicity which poses threats to the environment and health of humans. Some PAHs are carcinogenic and mutagenic (Davies and Abolude, 2016). Heavy metals released into the environment persist when it enters the food chain, and it is also known to bioaccumulate in the tissues of plants and animals (Gbaruko and Friday, 2007). Human exposure to heavy metals may lead to mental disorders, lungs damage, brain damage, arthritis, headache, and hypertension (Monisha et al., 2014; Lawal et al., 2021). Water bodies, however, have the natural ability to adjust when contaminants are washed into it through dilution and the breakdown of organic matter by microorganisms; water loses this buffering ability when contaminants introduced by anthropogenic activities exceed the threshold limits and become polluted (Edokpayi et al., 2017).
There is a popular claim by the people in Odeama community that their water is being polluted by anthropogenic activities. Odeama as a fishing community requires unimpaired water quality, which is necessary for the survival of aquatic organisms and also water for domestic use. Another major concern of the people is oil spillage, which is described as the release of crude oil into the environment as a result of anthropogenic activities (Chad-Umoren and Ohwekevwo, 2013). Oil spillage is caused by natural disasters, corrosion of pipelines, failure of oil and gas installation, operational errors, and third-party interference, which includes vandalization and crude oil theft (DPR, 2016). Oil bunkering involves the puncturing of crude oil pipelines carrying crude oil from which the oil is tapped (Boris, 2015). Bunkering is not carried out under federal government regulatory guidelines; it often results in oil spills which pollute surrounding soil and surface water. It is, therefore, necessary to determine the physiochemical parameters of Odeama creek surface water to ascertain if the water quality is impaired. In this study, the objectives are to develop an experimental design, carry out in-situ and ex-situ analysis on the surface water collected from Odeama creek, and evaluate the impact of exceedances of the physicochemical parameters of the surface water on the environment and inhabitants of odeama community.
MATERIALS AND METHODS
Study area
Samples were collected from different sampling points along Odeama creek from pre-determined points which were used to develop the map of the study area, as shown in Figure 1. The creek has an elevation of 281 m and is situated in the swamp and mangrove forest in Brass Local Government Area of Bayelsa State. The town of Brass is the headquarters of Brass Local Government Area (LGA), whose population at 2006 census was stated as 317,413. Odeama is an estuarine community whose water enters directly into the Atlantic ocean. Odeama creek water is a brackish water environment because of the influx of seawater from the Atlantic ocean. The map of the study area showing the sampling point is as shown in Figure 1.

Sample collection
Surface water samples were collected from 20 sampling points along Odeama creek following standard methods and procedures. The control points were areas where there is an infinitesimal level of industrial activities. The sampling points were close to operational oil and gas fields. The field study was carried out in May, June, July, August, September, and April for the wet season and November, December, January, February, and April for the dry season in the year 2019.
Samples were collected using a 2 L plastic container that was pretreated by washing in diluted hydrochloric acid and rinsed with distilled water. The sample bottles were labelled with sample point numbers and dates. At the sample collection point, the plastic containers were rinsed with the surface water several times. Water samples were collected by submerging the container below the surface and allowing it to overflow. Fast-changing parameters such as pH, dissolved oxygen, total dissolved solids, turbidity, temperature, and conductivity were determined in-situ. Samples for biochemical oxygen demand (BOD5), chemical oxygen demand, and heavy metals were collected separately. Heavy metal samples were acidified with nitric acid pH<2. While the samples of chemical oxygen demand were acidified with sulphuric acid pH< 2. All samples were preserved at (< 4°C) and transported in that state to Dukoria laboratory Ltd, Effurun, Delta State where all ex-situ analysis were carried out in line with adapted standard procedures that were validated (APHA, 1998).
Laboratory analysis
The methods of analysis were based on standard operating procedures (SOP) developed and validated in Dukoria Laboratories. The methods were all adapted from international standard methods presented in Table 1.

Statistical analysis
The results were subjected to descriptive statistics and one-way analysis of variance (ANOVA) was used to compute the significant difference between sampling points at 95% confidence level. All statistical analyses were performed using Microsoft Excel, office 365.
RESULTS
The physicochemical characteristics of surface water in Odeama creek of Niger Delta region of Nigeria are presented in Tables 2 and 3 (wet season) and Tables 4 and 5 (dry season). The result represents the summary of the descriptive statistics for each physicochemical parameters and the statistical difference between the samplings station at 95% confidence interval. In the table of results (Tables 2 to 5), p > 0.05 connotes that at 95% confidence interval, the difference between the values at different sampling points is statistically insignificant, while p < 0.05 is an indication that the differences are statistically significant.


Physicochemical parameters of Odeama creek water
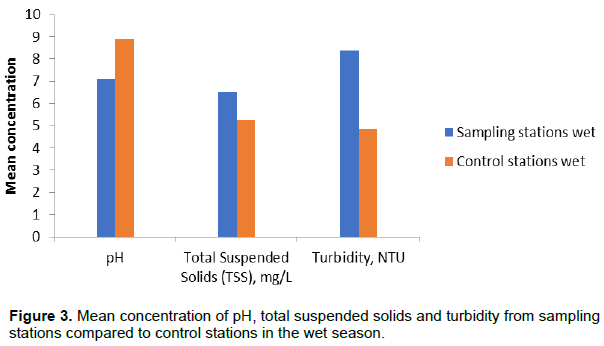
The pH range of 7.1 - 8.0 (wet season) and 7.12 - 8.3 (dry season) was observed in the study area, while (7.0 - 8.1) and (7.12 - 7.82) were recorded in the control area for the wet and dry season, respectively. There is no statistical difference between pH at the sampling stations (p > 0.05) at 95% confidence interval. The mean pH value of 8.9 ± 0.36 observed in the control area is higher than the mean pH value of 7.1 ± 0.21 obtained in the sampling points in the wet season (Figure 3). The mean pH value 7.55 ± 0.23 observed in the sampling station was consistent with the pH value 7.57 ± 0.31 obtained in the control area in the dry season (Figure 12).

The Electrical Conductivity (EC) obtained from the study area ranged from 6380 to 7680 µS/cm (wet season) and 18,010 - 29,920 µS/cm (dry season). EC values observed in the control area range 260 - 7800 µS/cm (wet season) and 16150 - 35980 µS/cm (dry season). EC values between sampling stations were not statistically different at p > 0.05 at 95% confidence interval. Average EC values 6639 ± 269 and 27219 ± 2850 µS/cm recorded in the study area were higher than the mean values 5528 ± 3557 and 23740 ± 8596 µS/cm obtained in the control stations (Figures 6 and 9) in both seasons.
Total suspended solids (TSS) in the study area range 0 - 17 mg/L (wet season) and range 0-34.5 mg/L (dry season). TSS values in the range 3 - 7 and 5.5 -16.5 mg/L were observed in the control points in the wet and dry season, respectively. There was no statistical difference of TSS values between sampling points (p > 0.05) at 95% confidence interval. The mean concentration of TSS 6.51 ± 4.35 mg/L is slightly higher in the sampling stations compared to the mean value of 5.25 ± 1.84 mg/L observed in control stations in the wet season (Figure 3). The mean value of TSS 8.75 ± 5.20 mg/L observed in the control area is slightly higher than mean value 7.23 ± 11.30 mg/L observed in the sampling stations (Figure 12).
The total dissolved solids (TDS) range 4080 - 4915mg/L (wet season) and 13160 - 14911 mg/L (dry season) were observed in the study area. The control area TDS ranged from 166 - 4992 and 8055 - 18020 mg/L in the wet and dry season, respectively. All the sampling points analyzed, showed no significant difference of TDS values (p > 0.05) at 95% confidence interval. The mean concentration of TDS 42496.51 ± 173 and 14008 6.51 ± 459 mg/L obtained from the sampling stations was higher than the mean TDS values 3537 ± 2276 and 118646.51 ± 4319 mg/L observed in the control stations in both wet and dry seasons (Figures 6 and 9).
The dissolved oxygen (DO) range 4.8 - 5.4 mg/L (wet season) and 2.12 - 3.69 mg/L (dry season) was recorded in the study area. The control area DO values ranged from 4.5 to 5.30 mg/L (wet season) and 2.98 to 4.9 mg/L (dry season). There was no significant difference in DO values (p > 0.05) at 95% confidence interval among the sampling stations. The mean DO value of 5.08 ± 0.17 mg/L recorded in the sampling area is consistent with the mean DO value of 4.98 ± 0.36 mg/L recorded in the control area in the wet season (Figure 5). The average DO value of 2.64 ± 0.44 mg/L in the sampling stations was lower than the mean DO of 3.84 ± 0.87 mg/L observed in the control stations in the dry season (Figure 13).
BOD range of 0.2 - 5.3 mg/L (wet season) and 0.01 - 1. 61 mg/L (dry season) was observed in this study area. The control area BOD values range from 1.90 - 3.20 mg/L (wet season) and 0.48 - 1.24 mg/L (dry season). There was no statistical difference in BOD values between the sampling points (p > 0.05) at 95% confidence interval. The control area recorded a slightly higher mean BOD concentration of 2.55 ± 1.56 mg/L than 1.47 ± 1.41 mg/L observed in the sampling stations in the wet season (Figure 5). The average BOD value of 1.05 ± 0.54 mg/L observed in the sampling stations was slightly higher than the mean BOD level of 0.87 ± 0.53 mg/L recorded in the control area in the dry season (Figure 13).
COD range of 6.9 - 13.40 mg/L (wet season) and 236 - 797mg/L (dry season) was observed in the study area. 0.80 - 9.70 mg/L (wet season) and 432.86 - 796 mg/L (dry season) were obtained in control area. There was no significant difference of COD values (p > 0.05) at 95% confidence interval between the sampling points. The mean COD values of 9.74 ± 1.85 and 622 ± 156.43 mg/L were higher in the sampling stations than the mean COD values of 6.45 ± 3.89 and 533 ± 165 mg/L recorded in the control area in both wet and dry season (Figures 5 and 10).
The turbidity range of 0 - 21 mg/L (wet season) and 0 - 27.50 mg/L (dry season) was observed in this study. The control area recorded values in the range 3.0 - 6.50 mg/L (wet season) and 4.0 - 6.0 mg/L (dry season). No significant difference was obtained between sampling points for turbidity values (p > 0.05) at 95% confidence interval. The mean turbidity values of 8.40 ± 5.61 and 5.55 ± 0.21 NTU were slightly higher in the sampling area compared to the mean values of 4.87 ± 1.65 and 4.63 ±0.94 NTU recorded in the control stations in the wet and dry seson (Figures 3 and 12).
Polynuclear aromatic hydrocarbon (PAHs) range of 0.01 - 0.17 mg/L (wet season) and 0.05 - 1.06 mg/L (dry season). The control area recorded PAHs values in the range of 0.01 - 0.04 mg/L (wet season) and 0.05 - 0.26 mg/L (dry season). No significant difference was obtained between sampling points for PAHs (p > 0.05) at 95% confidence interval. Higher mean PAHs values of 0.04 ± 0.11 and 0.22 ± 0.21 mg/L were recorded in the sampling stations compared to the mean PAHs values of 0.03 ± 0.01 and 0.12 ± 0.09 mg/L observed in the control stations in the wet and dry season (Figures 4 and 11).


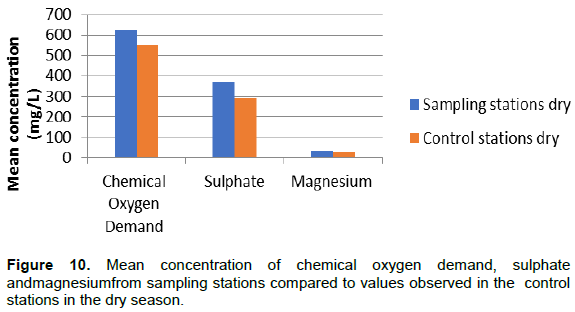


The sulphate range 118 - 559 mg/L (wet season) and 103 - 781 mg/L (dry season) was observed in the study area. The control area observed sulphate values in the range 103 - 781 mg/L (wet season) and 39.74 - 581. 57 mg/L (dry season). Sulphate sampling points are not statistically different (p > 0.05) at 95% confidence interval. The mean sulphate concentration values of 319 ± 102.7 and 372 ± 209 mg/L were higher in the sampling stations compared to the mean concentration values of 201 ±235 and 295 ±240 mg/L observed in the control stations in the wet and dry season (Figures 2 and 10).
Nitrate range 0.01 - 0.11 mg/L (wet season) and 0.002 - 0.032 mg/L (dry season) was observed in the sampling stations. 0.06 - 0.12 mg/L (wet season) and 0.022 - 0.014 mg/L (dry season) were obtained from the control area. Variation of nitrate between sampling points is not statistically different (p > 0.05) at 95% confidence interval during the wet season. A significant difference was observed between sampling stations (p < 0.05) at 95% confidence interval during the dry season. The mean nitrate value of 0.08 ± 0.02 mg/L recorded in the control stations was higher than the mean concentration of 0.04 ± 0.03 mg/L observed in the sampling stations in the wet season (Figure 4). The sampling stations recorded a higher mean nitrate value of 0.02 ± 0.01 mg/L compared to the mean nitrate value of 0.01 ± 0.01 mg/L recorded in the control area in the dry season (Figure 11).
Magnesium (Mg) range 37 - 462 mg/L (wet season) and 32 - 36 mg/L (dry season) were observed in this study. The control area observed ranges from 1.95 to 618 mg/L (wet season) and 19.33 - 43.23 mg/L (dry season). There was no statistical difference of magnesium values between sampling stations (p > 0.05) at 95% confidence interval. The sampling stations mean magnesium concentrations of 253 ± 150.12 mg/L is consistent with 255 ± 298 mg/L observed in the control station in the wet season (Figure 2). The mean concentration value of 34 ±1.10 mg/L observed in the sampling station is higher than the mean concentration 28.49 ± 10.36 mg/L observed in the control stations dry seasons (Figure 10).
Sodium (Na) range 1132 - 1363 mg/L (wet season) and 3651 - 4136 mg/L (dry season) observed in this study, is comparable to the control area 46.20 - 1385mg/L (wet season) and 3143 - 4999 mg/L (dry season). Na values observed between sampling points are not statistically different (p > 0.05) at 95% confidence interval. Sodium recorded a higher mean sodium concentration value of 1178 ± 47.90 and 3886 ± 128 mg/L in the sampling stations compared to the mean values 981 ± 631 and 3291 ±1198 mg/L recorded in the control stations in the wet and dry season (Figures 6 and 9).
Heavy metals of Odeama creek water
Iron (Fe) range 0.01 - 2.93 mg/L (wet season) and 0.04 -532 mg/L (dry season) was observed in this study. The control area recorded Fe values in the range of 0.08 - 21. 53 mg/L (wet season) and 0.13 - 1.63 mg/L (dry season). Variation of Fe between sampling points is not statistically different (p > 0.05) at 95% confidence interval. The mean concentration value of 1.23 ± 0.72 mg/L zinc observed in the sampling station is lower than the mean value of 7.05 ± 9.77 mg/L obtained in the control area in the wet season (Figure 7). During the dry season the sampling station recorded higher mean concentration value of 34 ± 133 mg/L compared to mean concentration of 0.65 ± 0.69 mg/L observed in the control stations (Figure 14).

Zinc (Zn) range of 1.18 - 1.42 mg/L (wet season) and 0.61- 35.5 mg/L (dry season) was obtained from the study area. The control area observed Zn values in the range of 0.05 - 1.44 mg/L (wet season) and 2.0 - 102 mg/L (dry season). Zn values observed between sampling points are not statistically different (p >0.05) at 95% confidence interval. Mean concentration values of 1.22 ± 0.25 mg/L zinc in the sampling stations were consistent with the mean values of 1.02 ± 0.65 mg/L recorded in the control stations in the wet season (Figure 7). The mean concentration of 27.33 ± 49.84 mg/L observed in the control stations is higher than 5.9 ± 21.15 mg/L mean value recorded in the sampling stations in the dry season (Figure 14).
Lead (Pb) was below detection limit < 0.01 during the wet season. Lead values in the range of 2.23 - 5.04 mg/L (dry season) were observed in the sampling stations while values in the range of 1.93 - 4.20 mg/L (dry season) were observed in the control area. Pb values observed are not statistically different (p > 0.05) at 95% confidence interval between sampling stations. Pb mean value 3.56 ± 0.69 mg/L obtained from the sampling stations was consistent with the mean values 3.08 ± 0.92 observed in the control stations (Figure 14).
Chromium (Cr) was below the detection limit <0.006 during the dry season. During the wet season, Cr range, 37 - 59 mg/L was observed in the sampling stations. Chromium values in the range of 36.43 - 44.20 mg/L were observed in the control area. Cr values obtained are not significant (p > 0.05) at 95% confidence interval between sampling stations. Higher mean concentration value 49 ± 5.37 of chromium was observed in the sampling stations compared to the mean value 40.21 ± 3.47 mg/L recorded in the control stations during the wet season (Figure 7).
Cadmium (Cd) range 0.03 - 0.01 mg/L (wet season) and 0.04 - 0.26 mg/L (dry season) were observed in the study area. The control area recorded values in the range 0.02 - 0.01 and 0.08 - 0.02 mg/L for wet and dry season, respectively. There was no statistical difference of Cd values (p > 0.05) at 95% confidence interval between sampling stations. The control stations recorded higher mean concentration 0.04 ± 0.03 mg/L of cadmium compared to the mean concentration 0.01 ± 0.003 mg/L observed in the sampling stations during the wet season (Figure 8). Cadmium mean value of 0.13 ± 0.05 mg/L obtained in the sampling stations was consistent with the mean concentration value of 0.08 ± 0.20 mg/L obtained in the control stations (Figure 14).
Copper (Cu) values range from 0.01 - 0.19 mg/L (wet season) and 0.14 - 6.51 mg/L (dry season) were observed in the study area. Cu values in the range 0.004 - 0.033 mg/L (wet season) and 0.17 - 0.26 mg/L (dry season) were obtained from the control stations. There was no statistical difference of Cu (p > 0.05) at 95% confidence interval between the sampling points. Higher mean concentration values of 0.09 ± 0.06 and 0.13 ± 0.05 mg/L of copper were recorded in the sampling stations compared to the mean values of 0.004 ± 0.033 and 0.17 ± 0.26 mg/L recorded in the control stations (Figures 1 and 8).
Benzene toluene ethylbenzene (BTEX), vanadium and barium values were below detection limits at <0.005, <0.001 and <0.005, respectively in the sampling stations and control stations in the wet and dry season.
DISCUSSION
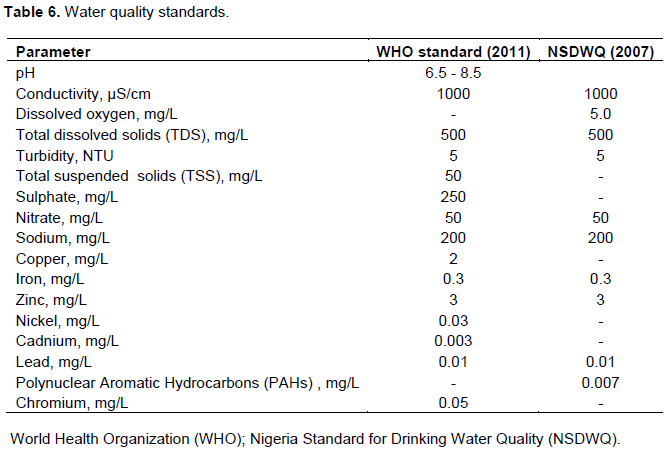
The salt and chloride content of the seawater is diluted by freshwater to approximately 2.5% and 4000 ppm, respectively; this gives brackish water pH values in the range 6 - 9 (Brian, 2007). The pH recorded in the sampling and control stations in both wet and dry seasons corresponds with pH range 6 - 9. According to Wokoma and Njoku (2017) pH values in the range, 6.5 - 9 are ideal for fish production. pH values obtained in this study in both seasons from the sampling area and control stations were within Nigeria Standard for Drinking Water Quality (2007) and World Health Organization (2011) permissible limits for water quality (Table 6).
The influx of seawater due to high tide may have been the reason for the elevated EC concentration observed in this study (Edori et al., 2019). The higher concentration of EC observed in the dry season may be due to the high temperature associated with the dry season, which leads to an increase in evaporation and concentration of the ions in the water (Trivedy and Goel, 1984). The EC values in this study were higher than World Health Organization (2011) permissible limit of 1000 µS/cm (Table 6). EC values obtained in this study agree with EC values of 33, 489 - 33,592 µS/cm reported by Onojake et al. (2017) from Bonny/New Calabar river estuary. Higher EC values in the range 3,472.53 - 39,611.68 µS/cm were reported by Effiong and Etteokon (2020) from the tropical mangrove estuarine system, Akwa Ibom State, Niger Delta, Nigeria. The high values reported by Effiong and Etteokon (2020) were attributed to the consistent discharge of waste from anthropogenic activities. The high concentration of EC observed in this study corroborates the elevated concentration of total dissolved solids.
The slight variation between total suspended solids (TSS) values obtained in the sampling area and control area indicates minimum anthropogenic influence from activities such as farming which loosens soil particles and consequently increases the amount of silt and sand washed into the water column. Brackish water usually contains silt and sand particles because of the turbulent nature of the water (Brian, 2007). The TSS values in the sampling area and the control sites were below the World Health Organization (2011) recommended limit of 50 mg/L (Table 6). A higher TSS value of 17.78 mg/L was reported by Edori et al. (2019) from Silver River, Southern Ijaw, Bayelsa State, Niger Delta, Nigeria.
Brackish and seawater contains more dissolved solids than freshwater sources (Sean, 2018). Total dissolved solids (TDS) in freshwater water are usually less than 500 ppm while brackish and seawater usually contains dissolved solids in the range of 500 - 30,000 and 30 - 40,000 ppm, respectively (Sean, 2018). The TDS values recorded in the sampling stations and control stations are within the range for brackish water. TDS values recorded in the wet and dry season were significantly higher than Nigeria Standard for Drinking Water Quality (2007) and World Health Organization (2011) recommended limits of 500 mg/L (Table 6). This indicates that the water may not be suitable for domestic use. Saltwater mixing with fresh water in the creek elevates TDS in the water bodies (Osokpor et al., 2014). Estuaries in the dry season are more influenced by seawater which contains a large quantity of dissolved salt (Udiba et al., 2012). This corresponds with higher TDS observed in the dry season in this study. Edori et al. (2019) reported similar high values in the range 13,050 - 13,500 mg/L in the dry season. 280 - 3371 mg/L (wet season) and 3090 - 4220 mg/L (dry season) were reported by Udiba et al. (2012) from Calabar River Estuary, Calabar, Nigeria. Lower TDS values of 6.77 - 12.58 mg/L were reported by Seiyaboh et al. (2016) from River Orashi in Eastern Niger Delta, Nigeria. Ngah et al. (2017) reported higher values in the range 10,185 - 26, 250 mg/L from Elechi Creek in the Upper Bonny Estuary, Rivers State, Nigeria. Ngah et al. (2017) attributed the elevated concentration of TDS to human activities. Salt intrusion and industrial waste discharge in the water bodies result in the high concentration of TDS in water bodies (Anhwange et al., 2012).
The lower DO values observed in the sampling stations compared to higher values obtained in the control area during the dry season indicate anthropogenic influence in the study area. The effect of high temperature on the solubility of gases in the water body may have contributed to the low values of DO in the dry season (Sharma and Walia, 2015). In this study, DO levels in the dry season were below World Health Organization (2011) stipulated limit of 5 mg/L. This further buttresses anthropogenic influence on the water quality in the dry season. A similar seasonal variation of DO value was also observed in a study conducted by Edori et al. (2019) and Edori and Nna (2018). Lower values in the range of 1.211 mg/L (dry season) and 1.139 mg/L (wet season) were reported by Odigie and Olomukoro (2020). 6.25 - 6.53 mg/L (wet season) and 3.23 - 4.63 (dry season) were reported by Ngah et al. (2017) from Upper Bonny Estuary, River State, Nigeria. Ngah et al. (2017) attributed the low DO observed in the dry season to domestic waste and the discharge of petroleum hydrocarbons into the water body which use up available oxygen in the water column.
The low BOD values recorded in this study and the slight difference in values observed between the BOD values recorded in sampling stations and control stations indicates minimum activities of microbes in the breakdown of organic pollutants. According to Clerk (1986) and Ngah et al. (2017), BOD levels between 2 and 4 mg/L do not show pollution, while BOD values above 5 mg/L indicate serious pollution. Similar BOD values in the range 1.40 - 5.38 mg/L (wet season) and 1.20 - 1.78 mg/L (dry season) were reported by Ngah et al. (2017).
The elevated value of COD recorded in the study area and the control stations in the dry season indicate anthropogenic influence. Farm activities, discharge of domestic waste, and industrial waste are anthropogenic activities that introduce oxidizable organic and inorganic pollutants into water bodies (Kamarudin et al., 2020; Gadhia et al., 2012). The lower COD values detected in the wet season may be a result of the dilution of organic substances caused by the increase in the volume of water due to heavy rainfall in the wet season (Jonah et al., 2020). The low dissolved oxygen observed corresponds with the elevated level of COD in the dry season. Similar season variation with mean COD value 83.16 mg/L (wet season) and 136.41 mg/L (dry season) was reported by Jonah et al. (2020) from upper Qua Iboe River, Akwa Ibom State, Nigeria. Higher value in the range 350 - 1675 mg/L was reported by Longe and Omole (2008) from River Illo, Ota, Nigeria. 180 - 382 mg/L was reported by Arafat et al. (2021) from Urban River in Bangladesh.
The turbidity values in both seasons were below the 5 mg/L recommended by Nigerian Standard for Drinking Water Quality (2007) and World Health Organization (2011) as presented in Table 6. The slight difference in turbidity values observed between the sampling area and control area indicates minimum anthropogenic influence from farming activities in the study area. Onojake et al. (2017) reported similar turbidity values in the range 4.35 - 6.65 NTU from Bonny/New Calabar River Estuary, Niger Delta, Nigeria.
The higher polynuclear aromatic hydrocarbons (PAHs) values recorded in the sampling area compared to values recorded in the control area indicate human influence on the water quality. PAHs values observed in the sampling stations and control stations were above Nigerian Standard for Drinking Water Quality (2007) permissible limit of 0.007 mg/L in both seasons. This further indicates anthropogenic influence on the water quality. Water polluted with PAHs is usually linked with industrial discharge, burning of fossil fuel, leaks from fuel tanks of boats in the waterway, and illegal bunkering activities (Davies and Abolude, 2016; Adeniyi et al., 2019). Mean values of 0.27, 0.22, and 0.19 mg/L were reported by Iyama et al. (2020) from Rumuwoji River, Woji creek, and Akpajo River in Port Harcourt, Rivers State, Nigeria.
The higher sulphate values observed in the sampling stations compared to lower values observed in the control area in the dry season indicates anthropogenic influence. Mean sulphate values recorded in the sampling stations (both the wet and dry seasons) and the control stations in the dry season were above World Health Organization (2011) stipulated limit of 250 mg/L (Table 6). This further confirms pollution from anthropogenic activities in the study area. The use of pesticides and fertilizers in farming, combustion of fossil fuel, and dumping of refuse are examples of anthropogenic activities that can increase sulphate concentration in water bodies (Moreno - Casas et al., 2009). The oxidation of sulphate from decaying organic matter to sulphite is known to increase sulphate concentration in water bodies (Makinde et al. 2015). A similar high value of 694.83 mg/L was reported in a study by Numbere (2017) from surface water in the mangrove forest area, of Niger Delta. 309 - 988 mg/L was reported by Wokoma and Njoku (2017) from the lower Sombreiro River, Niger Delta, Nigeria.
Nitrate values observed in the sampling stations and control sites were below 50 mg/L acceptable limits by World Nigerian Standard for Drinking Water Quality (2007) and World Health Organization (2011). The conformity denotes little influence from anthropogenic activities in the study area. High nitrate is known to increase the growth of plants and algae in the water body and this contributes to high BOD and the depletion of oxygen (Poulsen et al., 2018; Alam et al., 2021). The low nitrate values recorded in this study corresponds with the low BOD observed.
The high magnesium concentration in aquatic systems may be due to weathering of rocks and the presence of organic compounds (Chapman and Kimstach, 1996). The elevated concentration of magnesium observed in the wet season may be due to surface runoff caused by increased rainfall in the wet season. Oribhabor and Ogbeibu (2009) reported similar high magnesium values in the range 51.18 - 428.3 mg/L.
The high concentration of sodium observed in the control sites and sampling stations may be due to seawater intrusion (Chapman and Kimstach, 1996). Sodium values recorded in the sampling stations and control points were above 200 mg/L recommended limits by Nigeria Standard for Drinking Water Quality (2007) and World Health Organization (2011) in the wet and dry seasons. In conformity to values observed in this study, 382 - 709 mg/L (wet season) and 514.50 - 716 mg/L (dry season) were reported by Ukpatu et al. (2018) from Okoro River Estuary, South Eastern Nigeria. Ukpatu et al. (2018) attributed the elevated concentration of sodium to seawater intrusion of the estuary.
Iron (Fe) values observed in the sampling area were way higher than values observed in the control area especially during the dry season. This indicates human influence in the study area. Iron (Fe) values recorded in the sampling and control stations in the wet and dry seasons were above Nigeria Standard for Drinking Water Quality (2007) and World Health Organization (2011) permissible limit of 0.3 mg/L for safe drinking water quality. The high redox potential of the water body may have contributed to the high values of Fe observed in this study (Chapman and Kimstach, 1996; Numbere, 2017). Dan et al. (2014) reported similar mean values of 10.68 ± 1.91 mg/L (wet season) and 7.36 ± 194 mg/L (dry season) from Qua - Iboe River estuary and adjoining creeks, Nigeria. Dan et al. (2014) attributed the high concentration observed from Qua - Iboe River to anthropogenic influence.
Zinc (Zn) values recorded in sampling sites and control sites in the dry season were above Nigeria Standard for Drinking Water Quality (2007) and World Health Organization (2011) permissible limit of 3 mg/L for safe drinking water. This indicates human influence in the study area in the dry season. Anthropogenic activities such as the discharge of domestic waste, industrial discharge, and corrosion of abandoned vessels in the waterway can result in the release of Zn into the water body (Dan et al., 2014). The Zn value in the range of 9 to 15 mg/L was obtained by Mohammad et al. (2020) in a study conducted in three crude oil contaminated rivers corroborate with values obtained in this study.
Lead (Pb) values obtained in sampling area and control area during the dry season are above 0.01 mg/L acceptable limit by Nigeria Standard for Drinking Water Quality (2007) and World Health Organization (2011). This indicates human influence on the concentration of lead observed in the study area. Human activities such as illegal bunkering activities and the surface runoff which washes fertilizer into the water body can elevate the concentration of lead in aquatic systems (Ordiniola and Brisibe, 2013; Sanjay, 2014). High mean Pb values of 0.95 ± 0.002 mg/L (rainy season) and 0.99 ± 0.022 mg/L (dry season) were reported by Owamah (2013) from Warri River impacted with petroleum. According to Owamah (2013), surface water with this range of Pb concentration is not suitable for domestic use because of the health implications.
The chromium (Cr) values obtained in this study from the sampling station and the control stations were above World Health Organization (2011) stipulated limit of 0.05 mg/L for safe drinking water. This indicates pollution due to human activities. The high values observed may be due to corrosion from chromium-plated vessels abandoned in the water, oil spills, and fertilizers washed into the creek (Ghani, 2011; Mohammad et al., 2020). Cr values observed in this study are higher than the mean concentration values of 0.79 ± 0.03 mg/L (dry season) and 0.68 ± 0.02 mg/l (rainy season); 0.56 ± 0.04 mg/l (dry season) and 0.52 ± 0.01 mg/l (rainy season value) reported by Nduka and Orisakwe (2010) from Ijala creek and Ekpan River, respectively. Mohammad et al. (2020) reported 0.283 ± 0.034 mg/L along the Escravos River in Warri Southwest Local Government Area of Delta State, Nigeria.
Cadmium (Cd) values observed in the sampling and control sites in the wet and dry seasons were above the stipulated limit of 0.003 mg/L by World Health Organization (2011). This indicated anthropogenic influence on the cadmium level in the water body. Cd observed in this study is lower than Cd value in the range of 0.01 - 1.49 mg/L reported by Oribhabor and Ogbeibu (2009).
Copper (Cu) values observed in this study in the wet and dry seasons conform to World Health Organization (2011) recommended limit of 2 mg/L for safe drinking water (Table 6). The low value of Cu indicates little anthropogenic influence on the environment. A lower mean value of 0.05 ± 0.01 2 mg/L (wet season) and 0.02 ± 0.0042 mg/L (dry season) Cu was reported By Dan et al. (2014). Cu value observed in this study is lower than values obtained by Onojake et al. (2017).
CONCLUSION
The physicochemical and heavy metals results of Odeama creek revealed higher concentrations in the dry season. This may be due to a reduction in rainfall, increase evaporation, and consequent concentration of ions in the water body. Although electrical conductivity, total dissolved solids, and sodium observed in the sampling stations and control stations exceeded World Health Organization and Nigeria Standard for Drinking Water Quality recommended limits, their values were within limits of typical of brackish water. The high concentration of EC, TDS, and sodium recorded in this study may be due to seawater intrusion.
Low total suspended solids and turbidity observed in this study indicate minimum influence from farming activities which involves tilling of the soil. DO, COD, PAHs, sulphate, and heavy metals except copper exceeded World Health Organization and Nigeria Standard for Drinking Water Quality. This observed exceedance may be due to anthropogenic influence from activities such as domestic waste and industrial waste discharge into the water body, illegal bunkering activities, burning of fossil fuel, and corrosion of abandoned vessels in the waterway. Constant monitoring of the physicochemical parameters of Odeama creek surface water should be conducted to evaluate and mitigate the environmental and health impact of the exceedances in surface water observed in this study.
CONFLICT OF INTERESTS
The authors have not declared any conflict of interests.
ACKNOWLEDGEMENT
The authors thank Dukoria International Limited for their benevolence in providing logistic assistance during the sampling campaign and laboratory analysis.
REFERENCES
|
Adeniyi AO, Okoh OO, Okoh AL(2019). Levels of polycyclic aromatic hydrocarbons in water and sediment of Buffalo River estuary, South Africa and their health risk assessment. Environmental Contamination and Toxicology 76:657-669. |
|
|
Alam MS, Han B, Gregg A, Pichtel J (2021).Nitrate and biological oxygen demand change in a typical midwest Stream in the past two decades. H2O Open Journal 3(1):519-537. |
|
|
Anhwange BA, Agbaji EB, Gimba EC (2012). Impact assessment of human activities and seasonal variation on River Benue within Makurdi metropolis. International Journal of Science and Technology 2 (5):248-254. |
|
|
APHA (1998).American Public Health Association/American Water Works Association/Water Environment Federation.(1998). Standard Methods for the Examination of Water and Wastewater.20nd Edition, Washington DC, USA. |
|
|
APHA (2012).American Public Health Association/American Water Works Association/Water Environment Federation.(2012). Standard Methods for the Examination of Water and Wastewater.22nd Edition, Washington DC, USA. |
|
|
Arafat R, Ishrat J, Yeasmin NJ(2021). Assessment of physicochemical properties of water and seasonal variation in an Urban River in Bangladesh. Water Science and Engineering 14(2):139-148 |
|
|
Asejeje G, Ipeaiyede A, Onianwa P (2021). Occurrence of BTEX from petroleum hydrocarbons in surface water, sediment and biota from Ubeji Creek of Delta State, Nigeria. Environmental Science and Pollution Research International 28:1-19. |
|
|
Boris OH (2015). The upsurge of oil theft and illegal bunkering in the Niger Delta Region Nigeria: Is there a way out? Mediterranean Journal of Social Science 6(3):563-573. |
|
|
Boyd CE (2015). Water quality: An introduction. 2nd Edition. Springer International Publishing. |
|
|
Brian N (2007). Properties of fluid in handbook of valves actuators. Elsevier Science and Technology Books. |
|
|
Chad- umoren YE, Ohwekevwo E(2013). Influence of crude oil spillage on the radiation status of water and soil in Ogba/Egbema /Ndoni Area, Nigeria. Energy and Environment Research 3(2):45-52. |
|
|
Chapman D, Kimstach V (1996). Selection of water quality variables. Water quality assessment: a guide to the use of biota, sediments and water in environmental monitoring. 2nd Edition. University Press, Cambridge. |
|
|
Clerk RB (1986). Marine pollution. Clarandon Press, Oxford. |
|
|
Dan SF, Umoh UU, Osabor VN (2014). Seasonal variation of enrichment and contamination of heavy metals in the surface water of Qua Iboe River estuary and adjoining Creeks, South-South Nigeria. Journal of Oceanography and Marine Science 5(6):45-54. |
|
|
Davies OA, Abolude DS (2016). Polycyclic aromatic hydrocarbons (PAHs) of surface water from Oburun Lake, Niger Delta, Nigeria.Applied Science Reports 13 (1):20-24. |
|
|
DPR (2016). Department of Petroleum Resources.(2016). Oil and Gas Annual Report. |
|
|
Edokpayi JO, Odiyo J, Durowoju O (2017). Impact of wastewater on surface water quality in developing countries: a case study of South Africa.In water quality. IntechOpen |
|
|
Edori OS, Idomo BSK, Chioma F(2019). Physicochemical characteristics of surface water and sediments of Silver River, Southern Ijaw, BayelsaState, Niger Delta, Nigeria. American Journal of EnvironmentScience and Engineering 3(2):39-46. |
|
|
Edori OS, Nna PJ (2018). Determination of physicochemical parameters of effluents at discharge points into the new Calabar River along Rumuolumeni axis, Port Harcourt, Rivers State, Niger Delta, Nigeria. Journal of Environmental and Analytical Toxicology 8:1-5. |
|
|
Effiong U, Etteokon SE (2020). Preliminary study on the diversity of plankton flora and water quality of a tropical Mangrove estuarine system, Akwa Ibom State, Niger Delta Area. Nigeria. African Journal of Environmental And Natural Science Research 3(6):34-45. |
|
|
Gadhia M, Surnana R, Ansari E (2012). Seasonal variation in physico - chemical characteristics of Tapi estuary In Hazira industrial area. Our Nature 10:249-257. |
|
|
Gbaruko BC, Friday OU (2007). Bioaccumulation of heavy metals in some fauna and flora. International Journal of Environmental Science Technology 4(2):197-202. |
|
|
Ghani A (2011). Effect of chromium toxicity on growth, chlorophyll and some mineral nutrients of Brassica Juncea. Egyptian Academic Journal of Biological Sciences 2(1):9-15. |
|
|
Iyama WA, Edori OS, Nwagbara VU (2020). Assessment of the pollution load of the Woji Creek water body, Port Harcourt, Rivers State, South-South, Nigeria. International Journal of Advanced Research in Chemical Science 7(1):1-8. |
|
|
Jonah UE, Iwok ES, Hanson HE (2020). Impact assessment of coastal activities on water quality of Upper segment of Qua Iboe River, Akwa Ibom State, South - South, Nigeria. Journal of Applied Science Environment Management 24(7):1217-1222. |
|
|
Kamarudin MKA, Wahab NA, Bati SNA, Toriman, ME, Saudi, MSA ( 2020). Seasonal variation and dissolved oxygen demand in Terengganu River Basin, Malaysia. Journal of Environmental Science and Management 23:1- 7. |
|
|
Lawal KK, Ekeleme IK, Onuigbo CM, Ipeazu VO, Obiekezie SO (2021). A review on the public health implication of heavy metals.World Journal of Advanced Research and Reviews 10(3):255-265. |
|
|
Longe EO, Omole DO (2008). Analysis of pollution status of River Illo, Ota, Nigeria. Environmentalist 28:451-457. |
|
|
Makinde OO, Edun OM, Akinrotimi OA (2015). Comparative of physical and chemical characteristics of water in Ekerekana and Buguma Creek Niger Delta. Journal of Environmental Protection and Sustainable Development 1(3):126-133. |
|
|
Mogborukor JOA (2014). The Impact of Oil Exploration and Exploitation of Water Quality and Vegetal Resources in a Rain Forest Ecosystem Of Nigeria. Mediterranean Journal of Social Science 5(27):1678-1685. |
|
|
Mohammad SA, Abubakar SI, Babashani H, Asagbra AE, Alhassan AJ (2020). Assessment of heavy metal concentration in crude oil contaminated water sample of three communities of Ikpokpo, Atanba and Okpele-Ama of GbaramutuKingdom, along the Escravos River in Warri South-West Local Government Area of Delta State, Nigeria. International Journal of Environmental and Pollution Research 4(3):45-59. |
|
|
Monisha J, Tenzin T, Naresh A, Blessy BM, KrishnamurthyNB (2014).Toxicity, mechanism and health effects of some heavy metals.Interdisciplinary Toxicology 7(2):60-72. |
|
|
Moreno - Casas PA, Aral H, Vecchio - Sadus S (2009). Environmental impact and toxicology of Sulphate. Enviromine Conference 2009. Santiago, Chile. |
|
|
Nduka JK, Orisakwe OE (2010). Water - quality issues in the Niger Delta of Nigeria: a Look at heavy metal level and some physicochemical properties. Environmental Science Pollution Research 18:237-246. |
|
|
Ngah AS, Braide S, Dike CC (2017). Physico-chemistry of Elechi Creek in the Upper Bonny estuary, Rivers State, Nigeria. Journal of Geoscience and Environment Protection 5:181-197. |
|
|
Nigerian Standard for Drinking Water Quality (2007). Standard Organization of Nigeria, Abuja, Nigeria. |
|
|
Numbere AO (2017). Concentration of Iron and other physico- chemical parameter in ground and Surface Water in some Mangrove Forest Area in the Niger Delta, Nigeria 19:1-12. |
|
|
Odigie O, Olomukoro JO (2020). Physicochemical profiles and water quality indices of surface waters collected from Falcorp Mangrove Swamp, Delta State, Nigeria. Journal of Applied Science and Environmental Management 24(2):357-365. |
|
|
Onojake MC, Sikoki FD, Omokheyeke O, Akpiri RU (2017). Surface water and trace metal level of Bonny / New Calabar River estuary, Niger Delta, Nigeria. Applied Water Science 7(2):951-959. |
|
|
Ordiniola B, Brisibe S (2013). The human health implication of crude oil spills in the Niger Delta NIgeria: an interpretation of published studies. Nigerian Medical Journal 54(1):10-16. |
|
|
Oribhabor BJ, Ogbeibu AE(2009). Concentrationof heavy metals in a Niger Delta Mangrove Creek, Niger Delta Mangrove Creek, Nigeria. Global Journal of Environmental Science 8(2):1-10. |
|
|
Osokpor J, Osokpor OJ, Overare B, Avwenagha EO, Emudianughe JE (2014 ). Environmental evaluation of physiochemical parameters of surface water in OMA field, Western Niger Delta, Nigeria. Tropical Journal of Environmental Science and Health 17(1):7-15. |
|
|
Owamah HI (2013). Heavy metal determination and assessment in a petroleum impacted river in the Niger Delta Region of Nigeria. Journal of Petroleum and Environmental Biotechnology 4(1) |
|
|
Poulsen R, Cedergreen N, Hayes T, Hansen M(2018). Nitrate: an environmental endocrine disruptor? A review of evidence and research needs. Environmental Science and Technology 52(7):3869-3887. |
|
|
Sanjay KS (2014). Heavy metals in water: presence, removal and safety. Royal Society of Chemistry. |
|
|
Sean M (2018). An applied guide to water and effluent treatment plant design. Joe Hayton. |
|
|
Seiyaboh E, Angaye TCN, Okogbue BC (2016). Physicochemical quality assessment of River Orashi in Eastern Niger Delta of Nigeria. Journal of Environmental Treatment Technique 4(4):143-148. |
|
|
Tamrakar PK, Pitre KS (2000). Analysis of crude oil for its trace metal content. Indian Journal of Chemistry 39:779-783. |
|
|
Trivedy RK, Goel PK (1984). In chemical and biological methods for water pollution studies. Environmental Publication, Karad, Maharashtra (India). |
|
|
Udiba UU, Akpan ER, Ogabiela EE, Magomya AM, Yebpela GG, Apogo - Nwosu TU, Hammuel C, Ade - Ajayi AF, Aina OB (2012). Influence of oil exploitation in the Niger Delta on the water quality of Calabar River estuary, Calabar, Nigeria. Journal of Basic Applied Science Research 2(2):1658-1666. |
|
|
Ukpatu J, Udoinyang E,Etim L (2018).Seasonality, collinearity and quality assessment of the physicochemical propertiesof Okoro estuary, South Eastern Nigeria. Journal of Scientific Research and Report 19(5):1-15. |
|
|
Ustaoglu F, Tepe Y (2019). Water quality and sediment contamination assessment of Pazarsuyu, Turkey using multivariate statistical methods and pollution indicators.International Soil and Water Conservation Research 7(1):47-56. |
|
|
Wokoma OAF, Njoku KU (2017). Physical and chemical characteristics of the lower Sombreiro River, Niger Delta, Nigeria. Applied Science Report 20(1):11-16. |
|
|
World Health Organization (2011). Guidelines for drinking - water quality. 4th Editon. Geneva. |
|
Copyright © 2024 Author(s) retain the copyright of this article.
This article is published under the terms of the Creative Commons Attribution License 4.0


