ABSTRACT
There seem to be inconclusive results regarding the interactions between bank efficiency, default risk and bank capital. This study tries to assess the dynamic interactions between efficiency estimates, default risk and bank capital in the Ghanaian banking industry, using bank specific panel data for 20 Ghanaian banks from 2007 to 2015. We employ panel vector autoregressive models (VAR) models which are estimated using generalized method of moments (GMM) to examine the interactions. The results give an indication that bank default risk has negative and statistically significant impact on cost efficiency but exerts only a mild influence on profit efficiency. However, there exist weaker evidence on the impact of both efficiencies on bank default risk. Bank capital on the other hand has significant positive impact on cost and profit efficiencies but both efficiencies have insignificant impact on bank default risk.
Key words: Efficiency, bank capital, Stochastic Frontier Approach (SFA), default risk.
The measurement of bank efficiency plays a pivotal role in the accurate assessment of the performance of individual banks and the industry as a whole, whiles providing information concerning the overall stability of the entire financial system. Inefficiencies in the banking industry can cause banking crisis and impede economic growth since they are the main financial intermediation channels.
Similarly, risk is an important determinant of financial stability. Miss-assessment of risk has several repercussions including bank failure, stifling money supply and credit flow, losses for investors and depositors, banking crisis and destabilization of the financial services industry.
With the inception of Financial Sector Adjustment Program (FINSAP) in 1988, the Ghanaian banking industry has evolved over the past decade from a regime characterized by controls to a market based regime, with sound financial liberalization and integration, rapid growth of new financial products and technologies, consolidation in the industry as well as increased competition (BOG, 2013). This development brings extra burden on the banks with respect to the management of their risk, and achieving the desired level of efficiency in their operations. It also poses a challenge to regulators in ensuring financial stability and promoting financial efficiency. The rapid growth and major structural transformation of the Ghanaian financial system have brought many opportunities but not without increased risk. Regardless of efficiency growth and stringent regulation, a stable risk return position of banks can unexpectedly be impaired. The measurement of bank efficiency and accurate assessment of risk and the identification of the interrelationship between risk and efficiency have therefore become crucial as a result of these reasons mentioned above.
There exist a large strand of literature that analyses bank efficiency theoretically and empirically, focusing on particular types of efficiency such as technical, allocative, cost, profit and revenue efficiencies, using both parametric and non-parametric frontier techniques (Berger and Mester, 1997; Dietsch and Lozano, 2000; Fiorentino et al., 2006; Tahir and Haron, 2008; Akoena et al., 2009; Olson and Zoubi, 2011; Isshaq and Bokpin, 2011; Said and Tumin, 2011).
Some studies sought to establish the interrelationship between bank specific variables (size, capital, and liquidity), industry specific variables (market share and concentration), macroeconomic variables (inflation and GDP) and different types of bank efficiency (Kwan and Eisenbeis, 1997; Dietsch and Lozano-Vivas, 2000; Berger and DeYoung, 2001; Chaffai et al., 2001; Carvallo and Kasman, 2005; Williams, 2004; Altunbas et al., 2007; Goddard et al., 2007; Ioannidis et al., 2008; Hughes and Mester, 2009). Some studies also determined the relationship between product diversification, market valuation and risk (Stiroh and Rumble, 2006; Leaven and Levine, 2007; Lepetit et al., 2008).
Despite threatening implications of inefficiency and miss-assessment of risk and the relevance of identifying the interactions between bank risk and efficiency, there is limited literature on the Ghanaian banking industry. This study therefore attempts, using panel Vector Autoregression (VAR), which is estimated using generalized method of moments (GMM), to identify the causal relationship between efficiency (cost and profit) estimates, derived from Stochastic Frontier Approach (SFA) and bank default risk (determined by the distance to default approach) in the Ghanaian banking industry.
Secondly, we measure the impact of bank capital on default risk and efficiency trade-offs, since the relationship between bank efficiency and default risk might be impacted on by the proportion of capital to total loans. As part of a sensitivity analysis, we extend our study to investigate the relationship between bank efficiency and default risk for listed and unlisted banks. Said and Masoud (2014) confirm that on average, listed banks are cost efficient than unlisted banks. We therefore identify the interactions between efficiency and risk for listed and unlisted banks by classifying our sample into listed and unlisted banks.
This study contributes to literature in many ways. Firstly, it examines the underlying dynamic interaction between bank efficiency, capital and default risk within the context of pane VAR for Ghanaian banks, which enables us to provide empirical evidence on the Ghanaian banking industry. Secondly, we estimate efficiency using two alternative efficiency measures (cost and profit) in order to strengthen the validity of our results. Thirdly, we perform sensitivity analysis and determine whether the interaction between risk and efficiency is influenced by whether a bank is listed or not. Finally, we investigate the interactions between bank efficiency, capital and risk by forming a broader set of variables accounting for these concepts.
We expect an increase in bank default risk to cause a decrease in bank efficiency, since a rise in default probability will cause a decision making unit (DMU) to operate less efficiently. This is because DMUs that face high default risk incur extra risk monitoring costs in order to preserve the quality of bank portfolio and defend its financial soundness to regulators. A rise in default risk may temporally precede a decrease in cost efficiency arising from lower credit screening. This is in consonance with the ‘bad luck’ hypothesis (Berger and DeYoung, 1997).
In accordance with the ‘bad management’ hypothesis of Berger and DeYoung (1997), we expect a rise in a bank’s inefficiency to cause an increase in bank default risk. There is high probability that inefficient managers that do not properly control their operating cost, or do not generate increased profitability, resulting in cost and profit inefficiency, might also engage in ineffective risk management practices. Deterioration in efficiency could be an indication of poor or ineffective management practices which might lead to investing in poor quality loans. Decrease in bank efficiency as a result of bad management might lead to increased default risk.
We also theorize that a reduction in a bank inefficiency leads to an increase in default risk. In relation to the ‘skimming’ hypothesis of Berger and DeYoung (1997), banks in order to increase their efficiency may rather limit operating costs at the expense of facing higher future risk. This gives an indication that increase in bank inefficiency in the short run could lead to a decrease in risk taking transactions that will lead to a decline in bank default risk, implying an inverse relationship between risk and inefficiency.
We expect the relationship between bank efficiency and default risk to be affected by the proportion of capital to total loans. Moral hazard challenges might provide sufficient incentives for banks that thinly capitalized to extend their level of risk by taking on high non-performing loans in future. On the other hand, highly capitalized banks might face lower moral hazard challenges and may be better than thinly capitalized banks in terms of efficiency.
The study findings seems to be in consonance with the bad ‘luck hypothesis’ and supports the fact that highly capitalized banks might face lower moral hazard challenges and may be better than thinly capitalized banks in terms of efficiency. Bank default risk has negative and statistically significant impact on cost efficiency but exerts only a mild influence on profit efficiency. However, there exists weaker evidence on the impact of both efficiencies on bank default risk. Bank capital on the other hand has significant positive impact on cost and profit efficiencies but both efficiencies have insignificant impact on bank default risk.
Empirical investigations have utilized two main methodologies to measure bank efficiency: SFA and Data Envelopment Analysis (DEA) (Mester, 1996; Berger et al., 1999; Dietsch and Weill, 1999; Dietsh and Lozano, 2000; Hao et al., 2001; Fries and Taci, 2004; Sufian, 2009; Thagunna and Poudel, 2013).
Some researchers also explored different aspects of bank efficiency and estimates from different techniques (Berger and Mester, 1997; Bauer et al., 1997), the effects of off-balance sheet items, (Tortosa-Ausina, 2003; Pasiouras, 2007), and the contribution of environmental factors, markets, regulation and control (Altunbas et al., 2007; Dietsch and Lozano-Vivas, 2000; Chaffai et al., 2001; Berger and DeYoung, 2001; Cavallo and Rossi, 2002).
Literature on bank default risk has utilized two main methods in determining default probability as benchmarks: structural credit and reduced form credit models (Merton, 1974; Duffie et al., 2000; Collin-Dufresne et al., 2001; Huang, 2003; Leaven and Levine, 2007).
The reduced form model does not provide an implicit link between default risk and the firm’s structure whereas the structural credit model produces default probabilities from financial and accounting information, which can provide and update credit information on time, based on the financial constraints of different firms. Credit risk is usually proxied by problem loans, loan loss provision or bad loans. The commonly used structural credit measures are the distance to default and index numbers. The Merton type distance to default market based measure of risk is considered as a more comprehensive estimate of default risk compared to the widely used index number proxies which are based on accounting information. An extension of Merton’s distance to default measure was proposed by Liu et al. (2004), by integrating stochastic interest rates. Chan-Lau and Sy (2007) propose distance to capital model, which is also an extension of the Merton’s type distance to default measure that takes in consideration pre-default regulatory actions.
There seem to be inconclusive results regarding the interaction bank efficiency and default risk. Goodhart et al. (2004) identified that stability in the financial system and default risk, which is the main determinant of financial stability are endogenously ascertained together with economic efficiency within a general equilibrium model, and there exist some trade-off between them.
This seems to imply a possible inverse relationship between bank efficiency and default risk. Other studies, (Allen and Gale, 2004; Boyd and De Nicolo, 2005), however assert that there exist no such trade-off.
The Granger-causality techniques and simultaneous equation framework are the commonly used techniques in literature for testing hypotheses about the interactions between bank efficiency and default risk. A major contribution in literature was made by Berger and DeYoung (1997) who utilized granger-causality technique in examining the possible relationships between bank efficiency, risk and capital, developing four alternative hypotheses, that is, bad management, bad luck, skimping and moral hazard hypotheses.
Kwan and Eisenbeis (1997), assess the interrelationships between bank efficiency and asset quality estimated by past due and non-accrual loans. They identify a direct relationship between inefficiency and risk, taking into consideration not only credit risk but also interest risk. Berger and DeYoung (1997) examine the relationship between efficiency and risk taking behavior of banks, estimating risk by problem loans. Their results show that among highly efficient banks, a rise in cost efficiency tend to precede an increase in non-performing loans, indicating a short operating cost reduction at the expense of long run loan quality.
Altunbas et al. (2007), measured the relationship between bank efficiency and risk, using loan loss reserves to measure asset quality. They identify that least efficient banks take less risk with decreasing cost efficiency and that their efficient counterparts appear more risk. Mamatzakis and Koutsomanoli-filippaki (2009) and Fiordelisi et al (2011), asses the interaction between bank efficiency and default risk, measured by the Merton type distance to default, which incorporate market information such as stock price, volatility and leverage. Their results show that an increase in bank efficiency is followed by a decrease in default risk.
Podpiera and Weill (2008) identify the interaction between cost efficiency and non-performing loans among banks in Czech Republic in order to examine whether either of these factors is a key determinant of bank risk and find evidence supporting the bad management hypothesis. Their results imply that deteriorations in cost efficiency precede increases in bank default risk.
Williams (2004) assess the inter-temporal relationships among default risk, cost efficiency, and bank capital of European savings banks, using Granger causality techniques and finds that banks that are bad at managing their efficiency are also bad at managing risk. Pastor and Serrano (2005) also examine the interaction between efficiency and risk taking for a sample of European banks, while they also differentiate between exogenous and endogenous default risk and find that risk precedes profit efficiency but not cost efficiency.
This study seeks to find the efficiency-risk-capital relationships by constructing a broader set of variables accounting for each of these concepts. In achieving this objective, two dimensions of bank efficiency are measured (cost, profit), using parametric frontier technique (SFA). In estimating risk, we employ the traditional method, which uses the ratio of total to non-performing loans as proxy for bank default risk. Capital is also measured by the ratio of total capital (equity, retained earnings and other disclosed reserves) to total assets, which is a wider measure of bank capital.
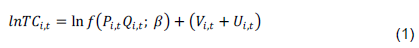
The Battese and Coelli (1995) stochastic frontier for panel data, which allows for the estimation of efficiency in a one-step procedure is employed because it eliminates some of the anomalies in the two step procedure. The standard translog specification is utilized to estimate the cost frontier and profit frontier since it has well known advantage of including a flexible form and as a particular case, Cobb-Douglas specification. The stochastic frontier cost efficiency model is specified as follows:
Where: represents total cost of the ith firm in the ith period, and are the vectors of input prices and output quantities. β represents a vector of unknown parameters; are random errors which are assumed to follow a symmetrical normal distribution and are independently distributed of ; and are independently distributed inefficiency effects. The profit efficiency model is also specified as follows:
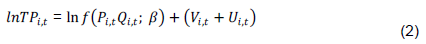
Where: measures total profit before tax but after interest of the ith firm in the tth period and all other variables are as defined in the total cost function. In measuring the efficiency under the profit function, the composite error term is considered as = . We employ the standard translog function for this study because though the translog and the Fourier flexible functional form yield essentially the same average level and dispersion of measured efficiency, Altunbas and Chakravarty (2001) identified limitations with the Fourier suggesting that the translog is preferred (Berger and Mester, 1997). The standard translog functional model for multi products is specified as follows:
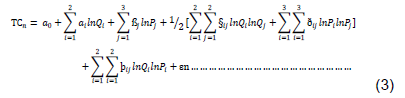
TC represents total production cost, comprising total total operating expense and interest expense; (i = 1,2) represent output quantities, where is total loans; is other earning assets; ( j = 1,2,3) are input prices, where is the price of labour (total personnel expense divided by total assets); the price of deposits (interest expense divided by corresponding liabilities (deposits, and other short term funding).); the price of equity (total capital expense divided by total fixed assets), is a two component stochastic error term; and are parameters to be estimated.
Profit functions are estimated in the same manner as the cost functions in equation (3) except that the dependant variable is replaced with total profit on the left side of the equation. The study focuses on cost and revenue efficiencies as tey reflect managerial abilities to minimize costs and maximize revenues respectively. Although at an initial stage of our study, we thought of using the distance to default method in estimating bank default risk, we could not obtain data on market values for some banks because most of them are unlisted. We proxy bank default risk in accordance with the study of Berger and De Young (1997) and Williams (2004), by the ratio of non-performing to total loans. This method is a widely used accounting indicator of banks’ risk and accounts for realized credit risk.
Capital is estimated by the ratio of total capital (equity, retained earnings and other disclosed equity reserves) to total assets, which is a wider measure of bank capital. This estimate is able measure capital adequacy and management better than the narrow equity to total assets ratio (Santos, 1999).
We follow the methodology and analysis of Mamatzakis and Koutsomanoli-filippaki (2009), and employ Sims (1980) Vector Autoregressive methodology to investigate the relationship between bank efficiency, risk and capital as this approach allows us to test unique relationships among variables. The Vector Autoregressive method is appropriate for this research because of the absence of a proiri theory of the interactions between the variables of our model, since it deals with the issue of endogeneity of the variables. This model is constructed on the basis that all variables enter as endogenous system of equations where the short run dynamic interrelationships can be subsequently identified.
Essentially, the Vector Autoregression methodology would allow us to examine the underlying causal relationships between our main variables: bank efficiency, default risk and capital. Though a common difficulty that emerges in panel VAR analysis is the heterogeneity across banks (Arellano and Bover, 1995), this can be addressed by setting individual specific terms. By this, our panel data vector autoregression recognizes all the variables in the system as endogenous, while allowing for unobserved individual heterogeneity. We specify a first order Vector Autoregression model as follows:
Where is a vector of two random variables, efficiency, risk and capital, Φ is a 2x2 matrix of coefficients, is a vector of m individual effects and , is a multivariate white-noise vector of m residuals.
As indicated by Mamatzakis and Koutsomanoli-filippaki (2009), all variables in standard VAR models depend on the past of all variables in the system, the main difference being the presence of the individual specific terms μi. We follow the work of (Mamatzakis and Koutsomanoli-filippaki, 2009), regarding estimation and inference, and utilize a system-based GMM estimator for each equation, according to the study of Arellano and Bover (1995).
We then obtain parameters by regressing the endogenous variables on the set of lagged endogenous variables. (Mamatzakis and Koutsomanoli-filippaki, 2009), indicate that the above system of equations is stated in the reduced form, so that once estimated it can be used to implement dynamic simulations. This analysis would include the estimation of impulse response functions (IRF) or variance decomposition (VDC) and requires solving complex identification problem. According to Mamatzakis and Koutsomanoli-filippaki (2009), this problem can be tackled by the study of Love and Zicchino (2006). We assume that bank default risk affects the efficiency with a lag, while it is simultaneously affected by its own innovation and that of the default the default risk. The reverse causation will also be tested. It also assumes that capital affects the efficiency with a lag, while it is simultaneously affected by its own innovation and innovation in the default risk and the reverse causation will also be tested. In detail, we model efficiency and bank default risk and later efficiency and bank capital in two- equations VAR with the following structure:
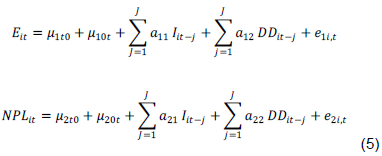
Here, and capture the bank efficiency and default risk respectively, while and are the industry and time dummies respectively. Capital is estimated similarly as NPL in eq. 5 expect that the dependent variable is replaced with capital (ratio of total bank capital to total bank assets) on the left side of the equation.
In order to impose that the underlying structure is the same for each cross-sectional unit we follow the study of Mamatzakis and Koutsomanoli-filippaki (2009), greatly influenced by Love and Zicchino (2006), by allowing for ‘individual heterogeneity’ in the levels of the variables by introducing fixed effects. The regressors are correlated with the fixed effects because of the lags of the dependent variables and as a result the mean differencing procedure commonly used to eliminate fixed effects would create biased coefficients This problem is avoided by using forward mean differencing, also referred to as the ‘Helmert procedure’ (Arellano and Bover, 1995). This transformation maintains the orthogonality between transformed variables and lagged regressors, so that we can use lagged regressors as instruments and estimate coefficients by system GMM.
The study employed a balanced panel data from twenty commercial banks operating in the Ghanaian financial services industry, over the period 2007 to 2015. The banks in the sample were selected because they have been operating continuously over the chosen period and there is continuous financial data for all of them over the entire period. The published annual financial statements and reports of the banks were obtained from their respective official sites.
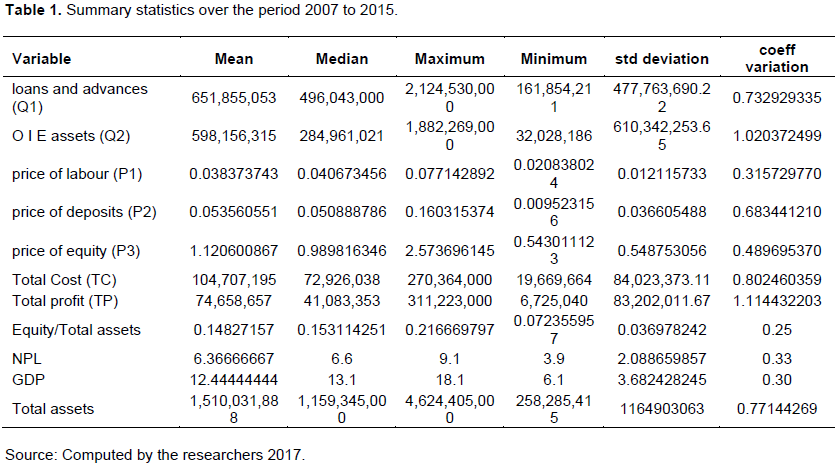
Table 1 presents the main descriptive statistics of default risk, and the input and output variables of cost and profit functions.
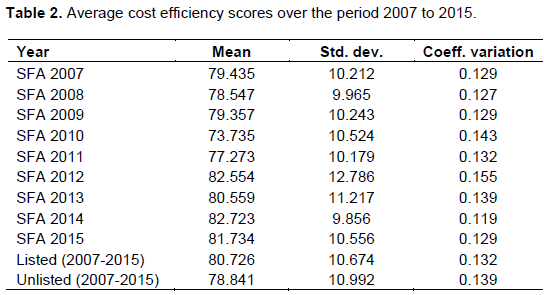
The cost efficiency estimates based on parametric frontier technique (SFA) are reported in Table 2. The measure of efficiency takes a maximum value of 100, which corresponds to the most efficient bank in the sample. The cost efficiency estimates range between 73.7 and 82.6%, with an average of 79.5%, thereby indicating average inefficiency of approximately 20.5%. The average cost efficiency is estimated at 80.73 and 78.84% for listed and unlisted banks respectively, indicating that listed banks are cost efficient than unlisted banks.
Table 3 also presents the profit efficiency estimates. The profit efficiency estimates range between 53.6 and 73.9%, with an average of 63.6%, thereby indicating average inefficiency of 36.4%. Profit efficiency estimates show an average of 60.52% and 65.29% for listed and unlisted banks respectively, indicating that listed banks tend to outperform their unlisted counterparts in terms profit efficiency.
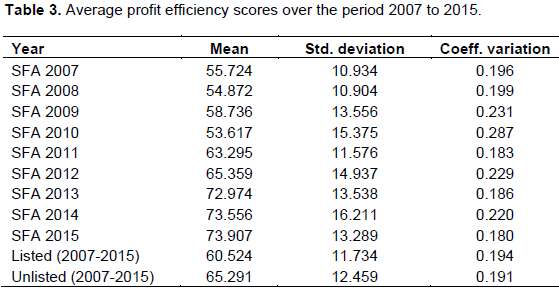
The average non-performing loans are approximately 6.37% of total bank loans and total equity are on average, around 14.83% of total bank assets. Consistent with literature, cost efficiency estimates are higher compared to profit efficiency estimates. The estimates show an average cost efficiency score of 79.5% compared to an average profit efficiency score of 63.6% for all the banks, indicating that there are significant inefficiencies on the revenue side. This might be showing that banks are much interested in increasing their investment activities (Dietsch and Lozano-Vivas, 2000). The overall trend for cost and profit efficiency estimates is not consistent but there is some improvement over the years. The rank order correlation between cost and profit efficiency estimates is estimated at approximately 0.43.
The cost and profit efficiency scores were estimated using SFA. Before the estimation of the panel VAR we have to determine the optimal lag order j of the right-hand variables in the system of equations. In order to determine the optimal lag order, we opt for the Arellano Bover GMM estimator for the lags of j=1,2,3. We then estimate the reduced form Panel VAR for difference lag orders. Dynamic panel is estimated with the Arellano Bond GMM estimator and opt for the lag order based on Akaike Information Criterion and the optimal lag length is of order one.
In order to test for evidence of autocorrelation, more lags were added. The Sargan tests show that for lag order one, we cannot reject the null hypothesis, and the Akaike information criterion confirms that the maximum lag order is one. We also perform normality tests for the residuals, opting for the Shapiro-Wilk Test. The test shows a value greater than 0.05, indicating that the data is normal. The parameter estimates of the system of equations for efficiency (cost and profit), capital and default risk are presented in Table 4.
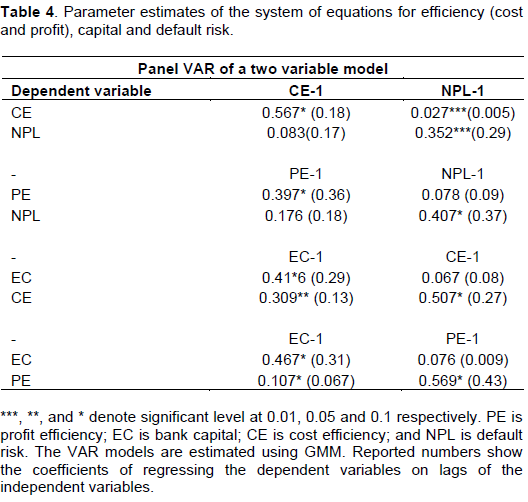
The results show that the impact of default risk (NPL), as measured by the ratio of non-performing to total loans, on cost efficiency (CE), is negative and statistically significant. This show that an increase in the lagged default risk coefficient precedes a decrease in cost efficiency. This is in consonance with the ‘bad luck’ hypothesis of Berger and DeYoung (1997), which states that an increase in a bank’s default risk will cause managers to operate less efficiently.
This is because managers that face high risk will have to put in measures and to incur additional risk monitoring costs so as to preserve the quality of bank portfolio. It can also mean that banks that are bad at managing their risks are also bad at managing their costs. This finding is consistent with the study of Maudos et al. (2002). Cost efficiency however has a positive impact on default risk but surprisingly and unlike most of the previous literature the impact is statistically insignificant for our period of study. This shows that cost efficiency does not exert significant influence on bank default risk.
Default risk impacts positively on profit efficiency (PE) but the impact is statistically insignificant. Profit efficiency is also positively related to default risk but statistically insignificant. This implies that bank default risk and profit efficiency have mild influences on each other.
On the other side, cost efficiency impacts positively on capital (EC) as measured by the ratio of total capital to total assets but are insignificant. Capital however has a positive and statistically significant impact on cost efficiency. This suggests that moral hazard incentives appear to plummet when bank capital increases and these banks are more likely to reduce costs. Shareholders in highly capitalized bank may be more active in controlling bank costs or capital allocation than thinly capitalized banks. Profit efficiency on the other hand has insignificant positive impact on capital.
The impact of capital on profit efficiency is positive and statistically significant. This shows that highly capitalized banks might benefit from lower cost of capital and transfer gains into profits thereby performing better than thinly capitalized banks in terms of profit efficiency.
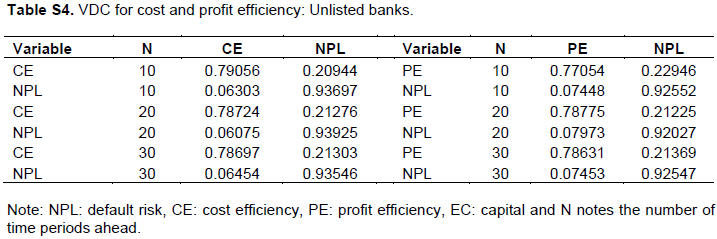
Tables S1, S2, S3, and S4 in the appendix present the variance decompositions of cost efficiency, profit efficiency, cost efficiency (listed), profit efficiency (unlisted) respectively. We present the total accumulated effect over the 10, 20 and 30 years. The results provide further evidence favouring the importance of risk in explaining the variation of cost efficiency. Specifically, approximately 15% of cost efficiency forecast error variance after thirty years is explained by default risk disturbances. The VDCs results would imply that the causality runs from bank default risk to efficiency. On the other side, approximately 1.6%, of the variation of default risk is explained by cost efficiency. 12% of profit efficiency forecast error variance after thirty years is explained by default risk disturbances whereas over 9% of the variation of default risk is explained by profit efficiency.
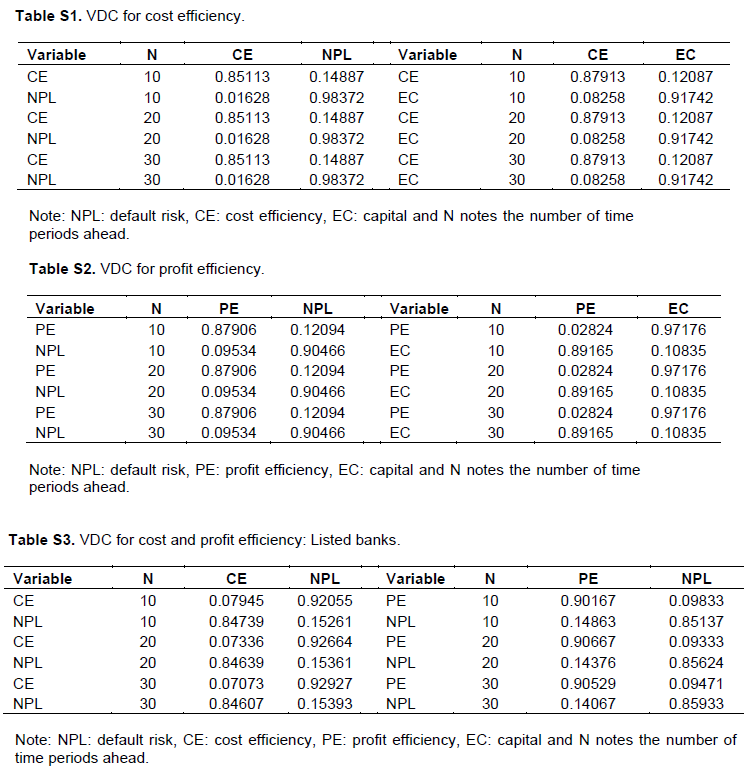
With regards to the interactions between efficiency and capital, we find that approximately 12% of cost efficiency forecast error variance after thirty years is explained by capital disturbances. On the other hand, 8% of the variation of capital is explained by cost efficiency. Thus, the VDCs results would imply that the causality runs from bank capital to cost efficiency. On the other side, over 10% of profit efficiency forecast error variance after thirty years is explained by capital disturbances whereas close to 3% of the variation of capital is explained by profit efficiency disturbances. This VDCs results would imply that the causality runs from bank capital to profit efficiency.
We also present variance decomposition estimates for efficiencies of listed and unlisted banks. approximately 15% of cost efficiency forecast error variance after thirty years is explained by default risk disturbances for listed banks whereas 7% of default risk forecast error variance is explained by cost efficiency. The results would imply that the causality runs from bank default risk to cost efficiency for listed banks. On the other hand, approximately 10% of profit efficiency forecast error variance after thirty years is explained by default risk whereas 15% of default risk forecast error variance is explained by profit efficiency.
In the case of unlisted banks, close to 21% of cost efficiency forecast error variance after thirty years is explained by default risk disturbances whereas 6% of default risk forecast error variance is explained by cost efficiency. This would also imply that the causality runs from bank capital to cost efficiency for unlisted banks. On the other side, close to 23% of profit efficiency forecast error variance after thirty years is explained by default risk whereas 7% of default risk forecast error variance is explained by profit efficiency
There seem to be inconclusive results regarding the interaction between bank efficiency, default risk and bank capital. The results provide an indication that bank default risk has negative and statistically significant impact on cost efficiency but exerts only a mild influence on profit efficiency.
However, there exists weaker evidence on the impact of both efficiencies on bank default risk. Bank capital on the other hand has significant positive impact on cost and profit efficiencies but both efficiencies have insignificant impact on bank default risk. Listed banks are efficient than unlisted banks and causality runs from bank default risk to cost efficiency for both listed and unlisted banks.
The study findings have some policy implication. Assuming bank default risk is a measure of financial stability, we find evidence that a trade-off between financial stability and bank efficiency does not exist. The majority of our results show clearly that bank efficiency and financial stability are positively related and the causality runs from default risk to efficiency. Essentially, default risk may act as an early warning mechanism for financial stability and efficient operation.
Effective monitoring of default risk could enhance financial markets and regulators ability to effectively deal with crises and improve efficiency.
The authors have not declared any conflict of interests.
REFERENCES
|
Akoena SK, Aboagye AAQ, Antwi-Asare TO, Gockel AF (2009). A Study of the Efficiency of Banks in Ghana", Unpublished work.
|
|
|
|
Allen F, Gale D (2004). Competition and Financial Stability. J. Money Credit Bank. 36(2):453-480.
Crossref
|
|
|
|
|
Altunbas Y, Carbo S, Gardener EPM, Molyneux P (2007). Examining the relationships between capital, risk and efficiency in European banking. Eur. Finan. Manage. 13:49-70.
Crossref
|
|
|
|
|
Altunbas Y, Chakravarty S (2001). Frontier cost functions and bank efficiency. Economic Letters 72, 233-240. Asian Econ. Finan. Rev. 4(10):1447-1460.
Crossref
|
|
|
|
|
Arellano M, Bover O. (1995), Another look at the instrumental variables estimation of error-components models, J. Econometrics. 68:29-51.
Crossref
|
|
|
|
|
Bank of Ghana (2013). BOG monetary policy report vol.6 No 1/2013.
|
|
|
|
|
Battese GE, Coelli TJ (1995). A model for technical inefficiency effects in a stochastic Frontier production function for panel data. Empirical Econ. 20:325-332.
Crossref
|
|
|
|
|
Bauer PW, Berger AN, Ferrier GD, Humphrey DB (1997). Consistency Conditions for Regulatory Analysis of Financial Institutions: a Comparison of Frontier Efï¬ciency Methods. Financial Services
|
|
|
|
|
Berger AN, DeYoung R (1997). "Problem Loans and Cost Efï¬ciency in Commercial Banks." J. Bank. Financ. 21:849-870.
Crossref
|
|
|
|
|
Berger A, DeYoung R (2001). The Effects of Geographic Expansion on Bank Efficiency. J. Finan. Serv. Res. 19(2):163-184.
Crossref
|
|
|
|
|
Berger AN, Mester LJ (1997). Inside the black box: What explains differences with efficiency of financial institutions? J. Bank. Financ. 21:895-947.
Crossref
|
|
|
|
|
Berger AN, Demsetz RS, Strahan PE (1999). Efficiency of Financial Services Industry: Causes, Consequences, Implications for the future. J. Bank. Financ. 23:135-194.
Crossref
|
|
|
|
|
Boyd JH, Nicolo GD (2005). The theory of bank risk taking and competition revisited. J. Financ. 60:1329-1343.
Crossref
|
|
|
|
|
Cavallo, L, Rossi SPS (2002). Do environmental variables affect the performance and frontier approach? Eur. J. Financ. 8:123-146.
Crossref
|
|
|
|
|
Carvallo O, Kasman A (2005). Cost efficiency in the Latin American and Caribbean banking systems. J. Int. Financ. Mark. Institutions Money 15:55-72.
Crossref
|
|
|
|
|
Casu B, Girardone C (2009). Testing the relationship between competition and efficiency in banking: A panel data analysis. Econ. Letters 105:134-137.
Crossref
|
|
|
|
|
Casu B, Molyneux P (2003). A comparative study of efficiency in European banking. Appl. Econ. 35(17):1865-1876.
Crossref
|
|
|
|
|
Chaffai ME, Dietsch M, Lozano-Vivas A (2001), Technological and environmental differences in the European banking industries. J. Finan. Serv. Res. 19(2/3):147-162.
Crossref
|
|
|
|
|
Chan-Lau JA, Sy A (2007). Distance-to-default in banking: A bridge too far? J. Bank. Regulation 9(1):14-24.
Crossref
|
|
|
|
|
Collin-Dufresn P, Goldstein RS, Martin JS (2001). The determinants of credit spread changes. J. Financ. 56:2177-2207.
Crossref
|
|
|
|
|
Dietsch M, Lozano-Vivas A (2000), How the environment determines banking efficiency: a comparison between French and Spanish industries. J. Bank. Financ. 24(6):985-1004.
Crossref
|
|
|
|
|
Dietsch M, Weill I (1999). The performance of banks in France. J. Bank. Financ. 20:134-145.
|
|
|
|
|
Duffie DJ, Jun P, Singleton K (2000). Transform Analysis and Asset Pricing for Afï¬ne Jump Diffusions. Econometrica 68(6):1343-1376.
Crossref
|
|
|
|
|
Fiordelisi F, Marques-Ibanez D, Molyneux P (2010). Efficiency and risk in European banking. European Central Bank Working paper series 1211 /6/ 2010
|
|
|
|
|
Fiorentino E, Karmann A, Koetter (2006). The cost efficiency of German banks: A comparison of SFA and DEA. Discussion Paper Series 2: Banking and Financial Studies No 10/2006
Crossref
|
|
|
|
|
Fries S, Taci A (2005). Cost Efficiency of Banks in Transition: Evidence from 289 Banks in 15 Post- Communist Countries. J. Bank. Financ. 29:55-81.
Crossref
|
|
|
|
|
Goddard J, Molyneux P, Wilson JOS, Tavakoli M (2007). European Banking: An Overview. J. Bank. Financ. 31:1911-1935.
Crossref
|
|
|
|
|
Goodhart CAE, Sunirand P, Tsomocos DP (2000). A model to analyse ï¬nancial fragility: applications. J. Financ. Stability 1:1-30.
Crossref
|
|
|
|
|
Hao J, Hunter W, Yang W (2001). Deregulation and efficiency: The case of private Korean banks. J. Econ. Bus. 53:237-254.
Crossref
|
|
|
|
|
Huang JZ (2003). Local asymptotics for polynomial spline regression Annal. Statist. 31:1600-1635.
Crossref
|
|
|
|
|
Hughes JP, Mester LJ (1998). Bank capitalization and cost: Evidence of scale economies in risk management and signalling. Rev. Econ. Statist. 80:314-325.
Crossref
|
|
|
|
|
Ioannidis C, Molyneux P, Pasiouras F (2008). The relationship between bank efficiency and stock returns: evidence from Asia and Latin America. University of Bath School of Management, Working Paper Series, 2008(10).
|
|
|
|
|
Isshaq Z, Bokpin GA (2011). Cost and Profit Efficiency of Ghanaian Banks, Unpublished work.
|
|
|
|
|
Kwan S, Eisenbeis R (1997). Bank risk, capitalization and operating efficiency. J. Finan. Serv. Res. 12:117-131.
Crossref
|
|
|
|
|
Lepetit L, Nys E, Rous P, Tarazi A (2008). Bank income structure and risk: An empirical analysis of European banks. J. Bank. Financ. 32:1452-1467.
Crossref
|
|
|
|
|
Leaven L, Levine R (2007). Bank governance, regulation and risk taking. J. Financ. Econ. 85(7):2331-2360.
|
|
|
|
|
Liu M, Zhou LJ, Zhu SY (2004). Efficiency of Chinese Commercial Banks: SBM DEA model. J. Mathematical Financ. 7:102-120.
|
|
|
|
|
Love I, Zicchino L (2006). Financial Development and Dynamic Investment Behaviour. Rev. Econ. Financ. 46:190-210
Crossref
|
|
|
|
|
Mamatzakis E, Staikouras C, Koutsomanoli-Filippaki A (2008). Bank efficiency in the new European Union member states: Is there convergence? Int. Rev. Finan. Analysis, 17:1156-1172.
Crossref
|
|
|
|
|
Maudos J, Pastor JM, Perez F, Quesada J (2002). Cost and profit efficiency in European banks. Journal of International Financial Markets, Institutions and Money, 12(1):33-58.
Crossref
|
|
|
|
|
Merton RC (1974). On the pricing of corporate debt: The risk structure of interest rates. J. Financ. 29:449-470.
Crossref
|
|
|
|
|
Mester LJ (1996). A case study of bank efficiency taking into account risk preferences. J. Bank. Financ. 22:61-84.
|
|
|
|
|
Olson D, Zoubi TA (2011). "Efficiency and Profitability in Middle East and North Africa Countries", Emerging Markets Rev. 12(2):94-110.
Crossref
|
|
|
|
|
Pasiouras F (2007). Estimating the technical and scale efficiency of Greek commercial banks: the impact of credit risk, off-balance sheet activities, and international operations. Res. Int. Bus. Financ. 22(3):301-318.
Crossref
|
|
|
|
|
Pastor JM, Serrano L (2005). Permanent Income, Convergence and Inequality among Countries. Rev. Income Wealth. 54(1):105-115.
Crossref
|
|
|
|
|
Podpiera J, Weill L (2008). Bad Luck or Bad Management? Emerging Banking Market Experience. J. Financ. Stability 4(2):135-148. (Czech National Bank WP 5/2007).
|
|
|
|
|
Said RM, Tumin MH (2011). "Performance and Financial Ratios of Commercial Banks in Malaysia and China", Int. Rev. Bus. Res. papers. 7(2):157-169.
|
|
|
|
|
Santos JD (1999). Ownership Structure and Banking Efficiency. J. Bank. Financ. 24:224-237
|
|
|
|
|
Sims C (1980). Macroeconomics and Reality. Econometrica, 48(1):1-48
Crossref
|
|
|
|
|
Stiroh K, Rumble A (2006). The dark side of diversification: the case of US financial holding companies. J. Bank. Financ. 30(8):2131-2161
Crossref
|
|
|
|
|
Sufian F (2009). Determinants of bank efficiency during unstable macroeconomic environment: Empirical evidence from Malaysia. Research in Int. Bus. Financ. 23:54-77.
Crossref
|
|
|
|
|
Tahir IM, Haron S (2008). "Technical Efficiency of Malaysian Commercial Banks: A Stochastic Frontier Approach". J. Bank Bank Syst. 3(4):65-72.
|
|
|
|
|
Thagunna KS, Poudel S (2013). Measuring Bank Performance of Nepali Banks: A Data Envelopment Analysis (DEA) Perspective. Int. J. Econ. Finan. Issues, 3(1):54-65.
|
|
|
|
|
Tortosa-Ausina E (2003). Nontraditional activities and bank efficiency revisited: a distributional analysis for Spanish financial institutions. J. Econ. Bus. 55(4):371-395.
Crossref
|
|
|
|
|
Williams J (2004), Determining management behaviour in European banking. J. Bank. Financ. 28:2427-2460.
Crossref
|
|