This article fills a gap of literature on the relationship between education and the stock market. We adopt the modified Calderon-Rossell model to estimate the effect of quality of human capital on Capital market. Four different techniques were used to check the robustness of the result. Of all the techniques adopted Newey-West to account for different characteristics of emerging economies turnout to be more efficient and appropriate. The article finds that the quality of human capital is an important determinant of stock market development in emerging market countries. Policy makers in emerging economies must seek to implement policies that would make education accessible and meaningful to the populace. By this Free Senior High School policy in Ghana is in the right direction for capital market development.
The stock market in every country is one way to access long term funding for investment and development. Generally Stock markets are believed to be the heartbeat of the economy given their ability to respond almost instantaneously to fundamental changes in the economy and the avenue for the needed long term funding for development. As a result of this belief, there has been considerable development in the stock market since the early 1990s in various economic blocks. Before 1989, there were just a few stock markets in the economies sampled for this article. The rise in number can be attributed to the needed long term equity funds for economic development. The pace and extent of stock market development in the sampled countries have been unparalleled. This has led to fundamental shift both in the financial structures and in the capital flows from more economically endowed countries.
Theories identify human capital and technology as major factors of development. To achieve sustainable development, the citizenry needs to change their behavior as individuals and as societies. This can be realized through educational reforms or increase access to education. There are two reasons for expecting to find some link between education and the performance of the stock market. The general reason is that it is intuitively plausible that living standards have risen so much over the last millennium because of education.
This article contributes to the literature on the relationship between education and the Stock market. Winful et al. (2013) concluded that education positively effects the Ghana stock market. Goh (1979) present the wealth of an economy in the 21st century is the quality of human resource. This article seeks to substantiate this finding about the Stock markets of emerging economies. The objective here is to establish a relationship between the quality of human capital and Stock market.
The realization of the important human capital can be linked to classical economics (Fitzsimons, 1999) and became prominent in the 1950’s (Woodhall, 2001). Human capital is now an important factor for a national economic growth in the modern economy.
Intellectual capital assets has become an important resource for performance due to change from manufacturing-based economy to a knowledge-based economy (Firer and Williams, 2003; Orens et al., 2009). The stock market is an example of knowledge-based enterprise or sector.
Rastogi (2002), Garavan et al. (2001), and Youndt et al. (2004) linked human capital to knowledge, skills, education, and abilities. To this article it is the ability to invest appropriately in the stock market. De la Fuente and Ciccone (2002) neglects one’s experience and stresses on human capital as knowledge and skills obtained throughout educational activities such as compulsory education, postsecondary education, and vocational education. In the work of Guiso et al. (2004), they proved that individuals who live or were born in areas with higher levels of social capital are more likely to invest in stocks.
Conventional human capital stock can be largely categorized into three parts: output, cost and income-based approach. Examples of the measure using the output approach are School enrollment rates, scholastic attainments, adult literacy, and average years of schooling (Barro, 1991; Barro and Lee, 1993). However, the limitation with the measure is that student’s effectiveness can be recognized after participating in activities.
The evidence comes from a few studies. Van Rooij et al. (2011) in their article concluded that individuals with high financial literacy are more likely to invest in the stock market.
The reason being that their knowledge lowers their operation cost. In Maddison (1991) he established that countries with high levels of GDP per Capita are associated with high-quality human capital some thirty years earlier. According to Guiso et al. (2004) individuals born in areas with higher levels of social capital are more likely to invest in stocks.
A relevant empirical proxy for the ability of individuals in a country is secondary school enrolment. The use of this variable deserve cautious treatment since, quality of human capital is endogenous to stock market development. This is because there may be some omitted variables that correlate with both knowledge and stock market development. It also believed that the relationship might suffer from simultaneity (or reverse causality). Secondly, education is a policy output variable and therefore further caution is called before thinking of it as an explanatory variable determining another output.
From Campos and Horvath (2006) and Loayza and De Soto (2002), we argue that the quality of human capital is associated with the stock market variables and macroeconomic stability variables. The direction of causation is from the latter to the former hence we cannot consider the quality of human capital as exogenous policy tool.
Cadeleron-Rossell’s (1990) behavioral structural model was adopted. The model to date represents a more comprehensive attempt to develop the foundation of a financial theory of stock market development. The empirical model includes secondary school education, which is a proxy for the quality of human capital. In this article we create a probabilistic model by starting with a deterministic model that approximates the relationship we want to model:
Since we do not need the assumption of homoscedasticity for OLS to be unbiased, we use OLS with heteroskedasticity to run the regression while maintaining the assumption with no autocorrelation. If the variables is tested at α=0.05 and are not stationary, we then find the first difference model 1 and 3.
“Model difference”, looks at the variables in difference and expects the same prior signs. To address the likely problem serial correlation in the error term, we focus on DOLS estimator instead since serial correlation and the endogeneity can be corrected by using the DOLS estimator. We then also correct for heteroskedasticity and serial correlation together with Newey-West estimation technique.
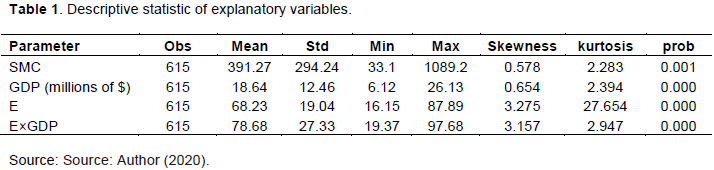
Descriptive analysis of explanatory variables
The minimum and maximum values for GDP for the 41 countries covering the period under study is 6.12 and 26.13 million US dollars respectively. The minimum value for SMC is 33.1 and a maximum value of 1089.2. The mean values of SMC and GDP were 391.27 and 18.64 with a standard deviation of 294.24 and 12.46. The mean quality of human capital for the period under study is 68.23, with a standard deviation of 19.004. The minimum and maximum Secondary school enrolments as a percentage of the workforce were 23.415 and 114.134, respectively, as shown in Table 1. The standard deviation for the variables presented is widely spread around their respective mean. The results reveal that ability of the individual to invest varied more than GDP. The skewness of the variables as shown in Table 1, reveals that the variables are all asymmetrical. All variables are positive and skewed.
Table 1 shows that the descriptive statistics are not normally distributed about their mean and variance. The data is a systematic one. This indicates that the aggregate stock price on the emerging markets and quality of human capital and GDP are very sensitive to periodic changes and speculations. To interpret, entrepreneurs can benefit considerably higher normal rate of profit from the stock market. This revelation demonstrates the degree of efficiency of the stock market.
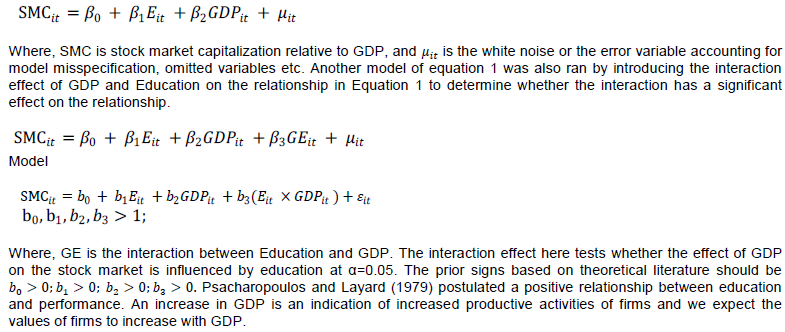
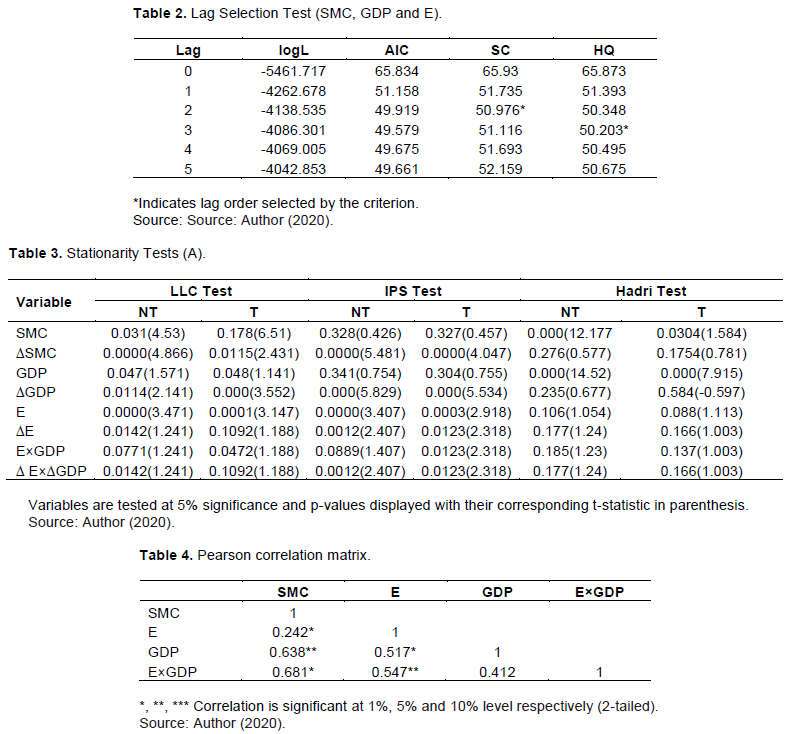
The ability of the individual to invest (E) and GDP to test stationary cointegration relationships was assumed. The article examines the time-series properties of the variables by utilizing unit-root tests and the presence of a stochastic trend in the adapted regression model Fosu et al. (2014). The stationarity of variables using the following tests; LLC, Breitung, IPS and Hadri was determined. This certified that the statistical properties of the selected variables do not change overtime. This is important because nonstationary variables tended to give a misleading parameter estimate of the relationship between independent variables and stock market returns. Based on the Schwarz information criterion, the stationarity test is sensitive to lag length of a maximum lag order of 2, as shown in Table 2.
The statistics are normal standard with a left-hand side rejection area, except on the Hadri test, which is the right side. A* indicates the rejection of the null hypothesis of nonstationarity (LLC, Breitung IPS) or stationarity (Hadri) at least at a 5% level of significance. Table 3 shows the stationarity test. At 5% significance and considering p-value, it was found that all three variables had unit-roots. This is so because the variables were lesser than the absolute variables of the test critical values at 5% (55.11, 18.37, and 98.63%). The article fails to reject the null hypothesis of no unit roots in the data series. Variables with unit-roots are transformed into the first difference to bring stationarity in the variable.
To ascertain whether variables were integrated or not, we carried out the test at the first difference. Table 3 indicates that all the variables are stationary at the first difference, meaning that they all had unit-root hence a stable series condition. The p-values of all variables are less than 5%. The absolute values of the test statistics for all variables are also greater than their corresponding test critical values at 5%. This implies the null hypothesis of all the variables having unit roots at first difference cannot be accepted at a 5% significance level. Hence, the article concludes that at first difference all variables, represent a stationary series integrated of the first order.
Since the quality of human capital and GDP are not static, the tendency for multicollinearity to pose some problems concerning with respect to the independent variables’ strengths. This exists because the predictive variables are correlated. Since the correlation numbers are lower than 0.7 as shown in Table 4, the results clearly showed that none of the independent variables were highly correlated; hence we could assume that there is no existence of serious multicollinearity amongst independent variables.
Using the variance inflation factor (VIF), the article measures the impact of collinearity among the independent variable. This shows the extent to which the repressors are related to other repressors and to find out how the relationship affects the stability and variance of the regression estimates. The tolerance factors for the two independent variables quality of human capital (E) and GDP are high (0.726 and 0.861, respectively) with the associated VIFs 5.81and 6.52, respectively, which are low to the VIF value of 10. This indicates that even though multicollinearity is present it is insignificant in affecting the steadiness and the variance of the regression estimates with an average VIF of 6.16.
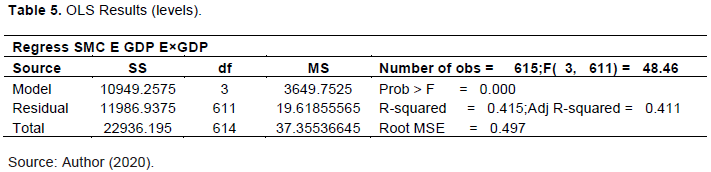
Appendix A column 1 is the regression where we determine the relationship between explanatory variables (the ability of the individual to invest in an economy, GDP and interaction of ability of the individual to invest and GDP) with the dependent variable (stock market capitalization) using the variables in levels. We also test the validity of the regression by testing whether all parameters are equal to zero. A large value of F indicates that most of the variation in stock market capitalization is explained by the quality of human capital and GDP. At 5%, there is a great deal of evidence to infer that the model is valid. Analyses of variance with F-test of the probability of zero (0) means that the model fit the data set and that E and GDP are linearly related to SMC. The relationship between E and SMC is 1.306 with a standard error of 0.358, which yields a t-statistic of 3.65. The relationship between GDP and SMC is also 1.24 with a standard error of 0.134. For both variables, there is enough even to conclude that there is a significant linear relationship between them SMC. The signs are all as expected. The interaction between E and GDP is also significant in explaining SMC variability. That is, there is significant evidence to conclude that GDP complement E in explaining variability in SMC.
An R-square of 0.415 implies 41.5% of the variations in SMC. The F-value of 48.46 with a probability 0.000 implies the data set fits the model. Breuch-Pagan test of a large chi-square 44.97 is indicative that heteroskedasticity is present.
Column 2 of Appendix A shows the OLS result corrected for heteroskedasticity (Table 5). The reported t-statistics from the regression are based on heteroskedasticity-consistent standard errors and covariance. This addresses minor concerns about the failure to meet assumptions, such as minor problems about normality, heteroscedasticity, or some observations that exhibit large residuals, leverage or influence. With the robust option, the point estimates of the coefficients are the same as in ordinary OLS, but the standard errors take into account issues concerning heterogeneity and lack of normality, hence standard errors did not change any of the conclusions from the original OLS regression as in shown in column 1 of Appendix A.
Since the model fits the data as well and the required conditions are satisfied, the individual coefficients are interpreted. The intercept b0= 11.14 is the average stock market capitalization when GDP and E are zero. This value is misleading to interpret since the value zero is outside the range of values of independent variables.
The relationship between SMC and E is described by 1.306. This is indicates that for each additional increase in the E in an emerging market, SMC increases on average by 1.306, assuming that the other independent variable in this model (GDP) is held constant. There is sufficient evidence to infer E and SMC are linearly related (βi = 0 against an alternative βi > 0). The value of the test statistic of 7.28 with an associated p-value of zero (0) shows that there is overwhelming evidence to infer that the E in emerging market and SMC are linearly related and the sign as expected.
The coefficient b2=1.24 specifies that for each additional GDP growth or increase, the average stock market capitalization increases by 1.24%, assuming the constancy of E. The nature of the relationship between SMC on E and GDP was expected. The value of the test statistic t=2.62 with a p-value of zero (0) shows that there is evidence to conclude that GDP and SMC of emerging economies are linearly related at a 5% significance level. GDP is important to the SMC in that it is a measure of the health of the economy (Appendix B). A rational stock investor is expected to invest more as the level of GDP rises, which is an indicative of firms on the whole, are performing positively on the stock market. This aggregate performance of firms allows for more reinvesting which should ultimately lead to higher future earnings and stock prices.
The article introduces the interaction effect of GDP and E on the relationship to determine whether the interaction has significant effect on SMC. That is, we suspect that GDP moderate the effect of E on SMC. AIC test confirms that the interaction term cannot be dropped.
Assuming that there is a partial effect of the E on SMC, in other words, GDP complements E. Simply looking at the coefficient of E, it will incorrectly conclude that E has 1.306 effects on SMC. The reason for interacting E and GPD is backed by the theoretical reason that the higher the level of GDP of a country, the higher the level of secondary school. The result shows explicitly that there is a statistically significant interaction between E and GDP. AIC analysis confirms that the interaction term should be included in the model.
The coefficient of E being greater than zero indicates that improvement in E increases SMC for economies with high GDP. Since b3 is significant, the interpretation of parameter b1 is not straight forward. To explain the partial effect, we plug in the mean value of GDP. At the mean value of GDP, the partial effect of E on SMC is b1+ b3 (mean of GDP) that is 1.306+0.079(18.64) = 2.78. This means that one percent increase in the E increases SMC by 2.78 standard deviations from the mean of SMC.
To test the coefficient of the interaction term (2.78) that is statistically different from zero (0), the article rerun the regression, where we replace the interaction term (E and GDP) with the difference between GDP and mean GDP multiply by E. This gives a new coefficient on E, the estimated effect of a GDP=18.64, along with its standard error. Running this new regression gives the standard error of the coefficient as 0.953, which yields a t=2.92). Therefore at the average GDP ( , E has a statistically significant positive effect on SMC. The variable of interest E is also positive and significant as expected indicating that higher levels of E are associated with SMC. This outcome indicates that E is good predictors of SMC in emerging countries. The coefficient of 1.306 of the E is misleading because it does not account for the effect of GDP on E which then affects stock market capitalization.
R square of 0.415 is an indication of a moderate correlation between aggregate SMC and the two independent variables. This means that about 41.5% of fluctuations in SMC are accounted for by E and GDP while 58.5% could be explained by other factors not related to the chosen independent variables. The results also shows that the relationship is an actual one and not merely due to the spurious regression problem.
To determine the unbiasedness of the OLS estimator, the article check for the presence of autocorrelation in the errors since the explanatory variables are strictly exogenous. This is analogous to our results in the case of heteroskedasticity, where the presence of heteroskedasticity alone does not cause bias or inconsistency in the OLS point estimates. The Durbin –Watson (DW) statistic obtained by running the analysis using the data series at the level has a value of (d= 0.217394 < 1). This is an evidence of positive serial correlation among residuals.
The presence of positive serial correlation implies that our OLS coefficients are still unbiased and consistent but inefficient because there is no lagged dependent variable (SMC) on the RHS as an explanatory variable. Breusch-Pagan test of a large chi-square 46.34 implies that heteroskedasticity is present.
To improve upon our results we run OLS with serial correlation and heteroskedasticity using GLS estimating technique. Generalized least squares (GLS) allow models with heteroskedasticity and no cross-sectional correlation and the results are shown in Table 6. This technique also confirms that E, GDP and its interaction are significant in explaining the variations in SMC. Wald chi2 with a p-value of 0.000 implies the model fits the data set.
Comparing column 3 with column 1 of appendix A we realize an improvement in the result. The parameters were overestimated under column 1 Appendix A due to the presence of serial correlation and heteroskedasticity. One percent increase in E is associated with a 0.096% increase in SMC. The partial effect of E on SMC is 0.88. There is a percentage increase given an average GDP, SMC increases by 0.88% instead of 0.096 assuming that GDP is zero for which it is not realistic since the values of GDP for the data series zero cannot be assumed. The parameters are all significant and the signs as expected. A wald chi-square of p-value of 0.000 implies that the data fits the model. The article could also deduce that correcting for heteroskedasticity and serial correlation, the standard errors of the estimated coefficients reduce in value which shows how efficient and unbiased the results are.
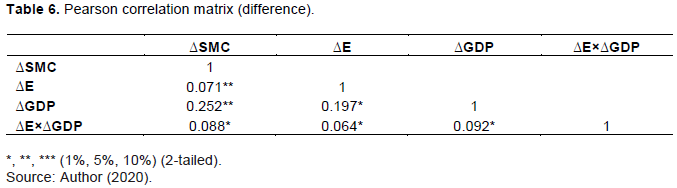
Even though there is statistical evidence to show that E and GDP influence SMC, the article cannot draw a firm conclusion based on these results because the regression results displayed are based on level, nonstationary data series and could represent a spurious problem. The stationarity estimation of nonstationary variables tended to give a misleading parameter estimate of the relationship. It is also established in the literature that stationary and weakly dependent can correct the effect of serial correlation. Since the variables are nonstationary, we find the first difference of the variables. The result from Table 3shows that the first difference of the variables is stationary. The Pearson correlation matrix of the first difference of the variables improves the problem multicolinearity since the correlation coefficients are relatively lower for the variables in levels (Table 6).
Regression of the first difference of the model using dynamic ordinary least squares technique gives the result in column 4 of Appendix A. The result improves column 1 of appendix A because of the smaller coefficients and Newey standard errors recorded. This implies the result from column 1 of Appendix A is overestimated and that the t-values and standard errors are not reliable. From column 4 of Appendix A the explanatory variables are still significant as expected. The Wald chi-square test is used to test the probability that the correlation coefficients for all the variables included in the models are zero. The article tests the validity of the regression model by testing whether all parameters in each model are all equal to zero. The Wald chi-square 47.3, with a p-value of 0.000, implies that the data set fit the model. The model can be able to explain 31.9% of the variations in SMC. Using DOLS, the article can circumvent the problem of endogeneity between and and the serial correlation between and .
Comparatively, the reported standard error and the coefficients of the parameters have improved significantly. All the variables of interest were significant and with their expected signs. Changes in the E, GDP and the interaction (E×GDP) are significant in explaining SMC; that is for every 1% increase in E, SMC of emerging markets increases by 0.04% assuming that other variables are constant. To determine the statistical significance of the coefficient of the partial effect of ∆E on ∆SMC the article replace the interaction variable with GDP minus the average GDP multiple by ∆E. This gives the new coefficient on ∆E (the coefficient of partial effect), the estimated effect at GDP of 18.64, along with a standard error. Running this new regression gives the standard error of as 0.0743, which yields t = 2.77. Therefore at the average GDP, it can be concluded that ∆E has a statistical significant positive effect on SMC. That is an enhancement in ∆E leads 0.206 increases in SMC of emerging economies. The sign is as expected. This suggests that the enhancement of ∆E for emerging economies is important for SMC. This study conforms to the theoretical postulation and the study of Yartey (2008).
The presence of auto correlated errors, makes the OLS estimators unbiased. This is analogous to the result in the case of heteroskedasticity where OLS point estimates do not cause bias or inconsistency in results. For a DW of 0.349, the null hypothesis is rejected. The article concludes that the data does have the first-order autocorrelation. Breusch-Pagan test with a large chi-square 46.15 implies that heteroskedasticity is present. Wald chi2 of the probability of 0.000 implies the data set fits the model well.
Accounting for serial correlation and heteroskedasticity in the model, the article compute Newey-West estimated standard error as depicted in column 5 of Appendix A addressing the problem of serial correlation and heteroskedasticity. There is a significant improvement in the result compared with column 4 of Appendix A. One percent increase in ∆E leads to 0.038% increase in ∆SMC. This again confirmed that the quality of human capital (E) complement GDP. The coefficient of the partial effect E on SMC of 0.088 with Newey-West standard error of 0.029 yields a t-statistic of 3.02. By implication, 1% increase ∆E gives average GDP; SMC will increase by 0.088%. A VIF of 1.07 shows that the coefficients are relatively stable and variance relatively small. Breusch-Pagan test the null hypothesis; the error variances are all equal versus the alternative that the error variances are a multiplicative function of one or more variables. A small chi-square 0.257 implies that heteroskedasticity is probably not a problem or at least that if it is a problem, it is not a multiplicative function of the predicted values. A DW test of 1.93 implies the absence of autocorrelation in the error term at 5% significance level. It is also clear that we correct heteroskedasticity and serial correlation using different estimation techniques; the calculated standard errors reduced in value which, males the results more reliable.
The model suggests that the ability of individual to invest per labor force and economic growth can make a statistically significant and economically meaningful contribution to stock market development. This study conforms to the theoretical postulation and the study of Yartey (2008). It is clear from these results that countries with high levels of education (E) stand to benefit more in terms of stock market development (SMC). This result is not different from those of Winful et al. (2013). Poor understanding of issues on the part of the public discourages potential investors from participation in stock markets. Our work also confirms the findings of Hong-Yih (2000) where they argue that the propensity to invest in shares rises with the level of education. A higher level of education increases confidence in stock market activities.
The results suggest that policy makers should not expect significant stock market development if the country’s educational structure is poor. The results are generally in agreement with the theoretical and empirical findings. The findings have important policy implications for emerging countries. Firstly, education play’s a crucial role in stock market development. Policymakers in emerging economies may initiate policies to foster growth in secondary school enrolment in emerging economies.
Overall, there is widespread and robust evidence that education play’s a key role in enhancing stock market performance, especially in those sectors where productivity and labour utilization is relatively low. Therefore, improving education – and quantitative and qualitative terms – has to be at the heart of policy measures to raise the stock market performance sustainably. By this Free Senior High School policy in Ghana is in the right direction to position the Stock market. It is expected that other African countries with weak capital markets show come up with policies that will make education affordable and accessible to majority of the populace.