ABSTRACT
The multidimensional apprehension of poverty is largely accepted today given the considerable contribution to understanding and acting against the manifestations of this phenomenon. Amartya Sen’s capability approach is the basis of the recent developments on the subject. In this perspective, the present work aims to study the application of multidimensional deprivation measures on Tunisian data. This paper investigates the nature of deprivations in the country using the measures proposed by Alkire and Foster, based on a two-threshold identiï¬cation method. Our work proposes measures of deprivation in four dimensions. In addition to the dimension of economic resources, we consider the deprivations in terms of housing, education and health. The study employed the national survey on household budget, consumption and standard of living 2010. The results are useful in identifying the most widespread deprivations and the most vulnerable population groups. In fact, with the monetary approach it is not possible to target all vulnerable groups and to detect all the deprivations suffered by the population. According to the results of this work, the western and southern regions of the country record the highest deprivation rates. The results are also indicative of the most widespread deprivations and the most affected socio-economic groups.
Key words: Capability approach, monetary poverty, deprivation, poverty measurement, Alkire and Foster measures, Tunisia.
Nowadays, the multidimensional understanding of poverty is universally recognized by the work on Amartya Sen’s approach to capabilities, which places a central value on the notion of positive liberty (Sen, 1985, 1987, 2003). The influence of this approach has affected not only the study of deprivations, but also the areas of education, health, gender inequality, sustainable development as well as the protection of the environment.
Poverty cannot be reduced to the lack on monetary resources, but must take into account the dimensions of a digniï¬ed and respectable human life. Alkire and Santos (2013) discussed three reasons to consider income to be inadequate indicator of poverty. First, the existence of needs met by non-market or institutional goods (access to services: water, education). Secondly, the ability of individuals to transform income into functioning depends on their physical states, activity, location, level of education. Finally, participatory surveys show that poor people identify in priority other dimensions of deprivation such as: nutrition, health, access to drinking water, exclusion, violence. At this level, the exploration of other facets of deprivation helps to complete the image drawn and offers a better view of the disadvantages suffered by the poorest individuals.
Studies on multidimensional poverty continue to grow. Many of these works link poverty to several dimensions of human life. We refer here, for example, to Brandolini and D’Alessio (1998), Chiappero-Martinetti (2000), Lelli (2001) and Maître et al. (2014). The results reveal the contribution of multidimensional perception to the understanding of poverty.
In the same perspective, the construction of multi-dimensional measures has largely developed. Deutsch and Silber (2005) presented a comparison of four approaches based on fuzzy set theory, information theory, efficiency analysis and axiomatic approach. In 2010, the United Nations Development Program (UNDP), in collaboration with the Oxford Poverty and Human Development Initiative (OPHI), launched the Multi-dimensional Poverty Index calculated for a hundred countries.
Official statistics in Tunisia show that poverty in the country is in constant decline. However, this regression cannot hide the existence of a very signiï¬cant differential, particularly according to the region and the area of residence (Institut National de la Statistique INS, 2010 and 2015). In addition, the study of poverty in Tunisia focused on monetary terms with a dominance of the work carried out by national and international institutions (African Development Bank, 2011; INS, African Development Bank and World Bank, 2012; World Bank, 2016).
Belhadj (2011) constructed a multidimensional poverty index using fuzzy set theory, applied to Tunisian data from the 1990 budget and consumption survey. The work retains 3 dimensions relating to: the region of residence (by differentiating between rural and urban coastal and interior environments as well as the urban region of the capital Tunis); the activity and level of education of the head of household. The results show that poverty is more severe for: residents in interior regions; households headed by a worker or illiterate.
Likewise, Nasri and Belhadj (2017) used household expenditure to analyze regional multidimensional poverty, by only retaining expenditure related to three headings: food, health and education. Other works such as Belhadj (2012); Hasnaoui and Belhadj (2015); Zedini and Belhadj (2015) have adopted the same logic. They exclude expenses relating to communication, leisure.
The approach to our work is completely different from this vision. Indeed, the contribution is to consider an understanding of multidimensional poverty that takes into account monetary and non-monetary aspects. This is at the heart of recent developments in the study of poverty.
The objective of this paper is to analyze poverty in Tunisia from a multidimensional perspective. For this purpose, we apply the method of Alkire and Foster (2009) to obtain the multidimensional poverty measures. These measurements are based on an identiï¬cation method with two thresholds (Between and within dimensions). The aggregation step is done through the ï¬tted Foster-Greer and Thorbeck family of measures. The application is based on Tunisian data from the 2010 National Household Budget, Consumption and Standard of Living Survey.
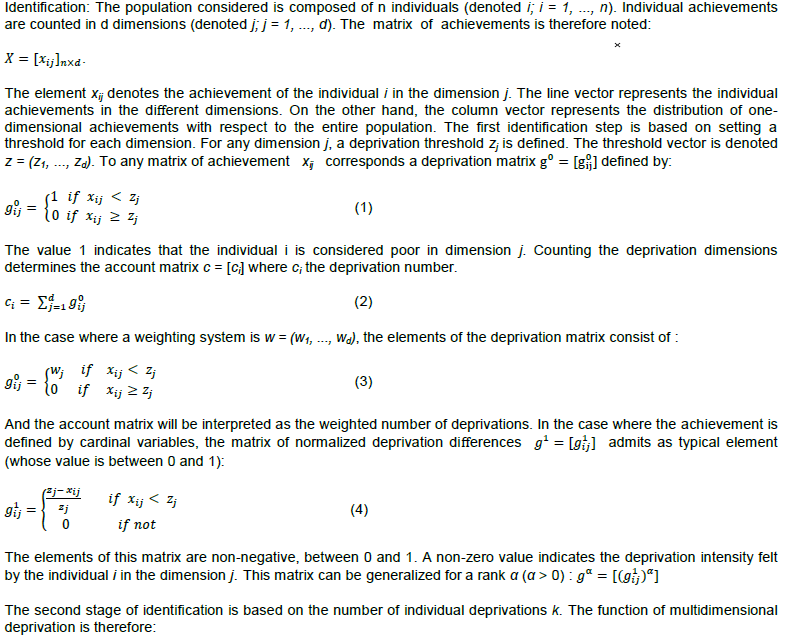
Multidimensional measures
Fundament
The deï¬nition of poverty in terms of lack of capabilities and functioning aims to defend the right to a decent life for all individuals. Although income is essential to meeting needs, it is not the primary objective. Income is a means and not an objective in itself.
Functioning expresses all the possibilities of choice and actions, from the most basic to the most complex, accessible to an individual (being well fed, in good health, participating in social life). Capability is a combination of functioning that represents a certain way of life. Achievements consist of all the modes of functioning that a person actually exercises. It is necessary to differentiate between achievement on one side and freedom of achievement on the other. Sen’s legal approach places a signiï¬cant value on the freedom to achieve in the sense that it extends the choice possibilities of an individual.
For Sen, the "Capability" space is more appropriate for the study of poverty and inequality. First, the real freedoms admit an intrinsic importance for all individuals. The possibility to choose independently is a goal that everyone seeks to achieve. This provides to capabilities the basic role for a digniï¬ed and fulï¬lling human life. Second, economic and monetary conditions are not the only factor influencing the production of capabilities. Political freedoms, housing conditions, health status are important elements in people’s perception. Finally, the relationship between monetary poverty and poverty in capabilities remains variable. This justifies the existence of situations where people suffering from various deprivations are not identiï¬ed by a monetary approach. This relationship depends on several factors that influence the conversion of resources into functioning.
Construction
The measures of Alkire and Foster (2009) consisted of a two-step identiï¬cation method (identiï¬cation step) combined with a family of measures based on the Foster et al. (1984) index (aggregation step).
DATA AND DEPRIVATION DIMENSIONS
Data
The empirical work done is based on data from the 2010 National Survey on Houshold Budget, Consumption and Living Standards. Conducted by the National Institute of Statistics (INS), the ï¬ve-year survey took place between June 2010 and main 2011 on a sample of 13,400 households. The purpose of the survey is to provide information on three aspects: household consumption expenditure, food consumption and household access to health and education services made with a sample halved.
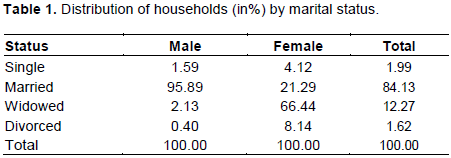
The merging of the data provided by the three components made it possible to obtain a sample composed of 5,690 house- holds representing 25,055 individuals of which 64.66 % live in a urban area. Male-headed households account for 84.24% of the sample. In 95% of these cases, the head of household is married. When a woman is in the position of household head (15.76% of the total households), the dominant marital status is "widowed" representing 64.44% of households headed by females. Households headed by females are, on average, smaller in size. Half of the households in the sample, the head is between 40 and 60 years old (Table 1).
Dimensions and indicators
The choice of dimensions and associated indicators follows two possible approaches (Guio, 2009; Guio et al., 2009):
i. the normative approach: consists of proceeding in a logical way, by attributing indicators to speciï¬c dimensions previously chosen (Multidimensional Poverty Index IPM built by the UNDP, poverty in living conditions in France);
ii. the descriptive approach: uses the CFA (Conï¬rmatory factor analysis) analysis techniques to identify groups of indicators according to the degree of correlation (Nolan and Whelan, 1996).
Monetary dimension
In this dimension, households that have an amount of consumption expenditure below a monetary poverty line, are considered in a state of deprivation. The threshold calculated by the INS is the sum of food and non-food components. It is calculated for three areas: metropolitan, communal (urban) and non-communal (rural). The respective values are estimated at 1277, 1158 and 820 dinars (Tunisian currency) per person / year.
Housing dimension
Housing is an essential dimension in the well-being of households. Deprivation in this dimension is assessed according to the comfort and availability of essential services. Four indicators were selected:
i. the number of persons per room: the threshold chosen is 3. Thus, a household will be judged in deprivation if the value of the indicator is greater than 3;
ii. the availability of electricity;
iii. the availability of potable water: provided by SONEDE (National Company of Exploitation and Distribution of Waters). Households who obtain drinking water by means of: public fountain, sellers, public or private wells as well as waterways are considered deprived;
iv. the Connection to the sewerage network.
Education dimension
Deprivation in the education dimension is assessed in relation to the education level of the household head. The household is deprived if the head has never studied.
Health and social security dimension
Two indicators are used to represent deprivation in this dimension. For the ï¬rst indicator, a household will be considered poor if one of these members is suffering from a long-term illness without having care coverage (through: CNAM National Health Insurance Fund, a mutual or a group insurance, free of charge, with a family member). The second indicator concerns the affiliation of the household to a social security organization (Caisse Nationale de Sécurité Sociale, CNSS or Caisse Nationale de Retraite et de Sociale, CNRPS). Deprivation in this indicator is conï¬rmed when the head of household is not affiliated.
Deprivation by dimension
When the dimension is represented by more than one indicator, the household is considered deprived if it accumulates deprivations in at least 50% of the indicators. Tables 2 to 4 summarize the information on the indicators by dimension (reporting the threshold and frequency of deprivation).
The data show that income poverty affects 14.24% of households. The proportion of the poor in this dimension is even higher:
i. in the rural area (19.74%) compared to the urban area (11.23%);
ii. in the inner regions of the country, the poverty rate is 28.77 % in the Midwest, while it is 5.34 % in the Center East;
iii. for larger households;
iv. when the head of the household belongs to the category of unemployed or farm workers. As for the monetary poverty, the deprivation of education is more widespread in the rural area (48.41 % against 22.68 % in the urban area), as well as in the interior regions (in particular in the center west and North West). At the national level, 31.76% of household heads have never studied. In fact, the geographical distribution of schools is uneven between regions. This compromises development and increases the hardships of the inhabitants of some regions of the country. In rural areas, schools are devoid of equipment and lack of maintenance and teaching staff.
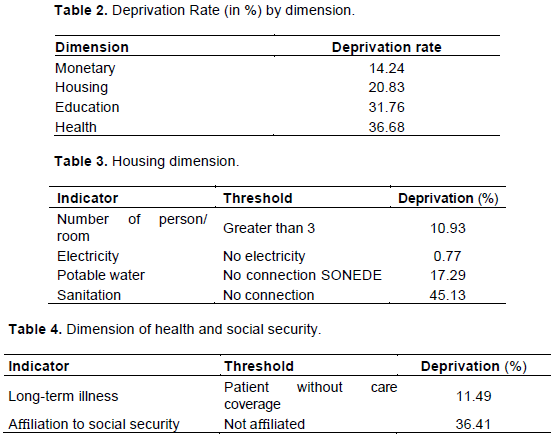
The regional differential of deprivation seems even more important in the housing dimension. While the proportion of households in deprivation is 2.08 % in Tunis agglomeration, it reaches 48.19 % in the center west. At the national level, the rate of housing deprivation is 20.83%. Official data on housing in Tunisia indicate a sustained evolution of the housing stock. However, as Zaafrane (2014) points out, the living conditions and the households’ comfort vary according to their socio-economic characteristics. Thus, the poorest households live in very difficult conditions. Housing policy must take into account social and regional parameter.
For the health and social security dimension, the deprivation rates in each indicator are shown in Table 4. The proportion of households in deprivation in the dimension is estimated at 36.68%. Despite the large offer of care, it remains characterized by strong disparities. Belhadj et al. (2016) note that community care structures in several regions can only provide one medical consultation per week. In addition, there are financial difficulties in accessing healthcare, particularly because of the non-affiliation of a large part of the population to the CNAM.
It is therefore necessary to carry out reforms that guarantee access to care and overcome the financial difficulties encountered by users. Also, it is necessary to reduce the imbalances between the regions by revising the health map and by giving priority to the regions of the west and south of the country. On this point, Achour (2011) underlines the significance of regional inequalities which is manifested by indicators such as the concentration of beds, equipment and health personnel in the coastal regions (the eastern regions of the country).
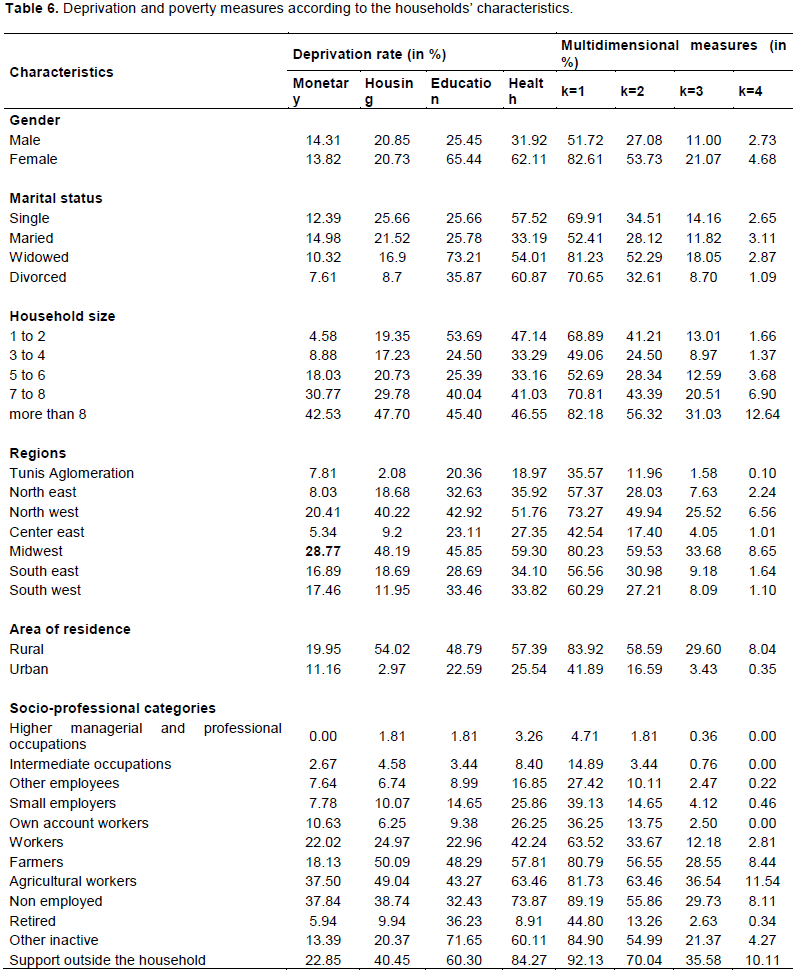
The results (Table 6) also show that households headed by women are more exposed to the risks of deprivation, particularly in the education and health dimensions. According to the socio-professional category, it appears that deprivation affects more severely the farmers and farm workers in the housing, education and health dimensions. The inactive and households without support also experience high rates in the education and health dimensions.
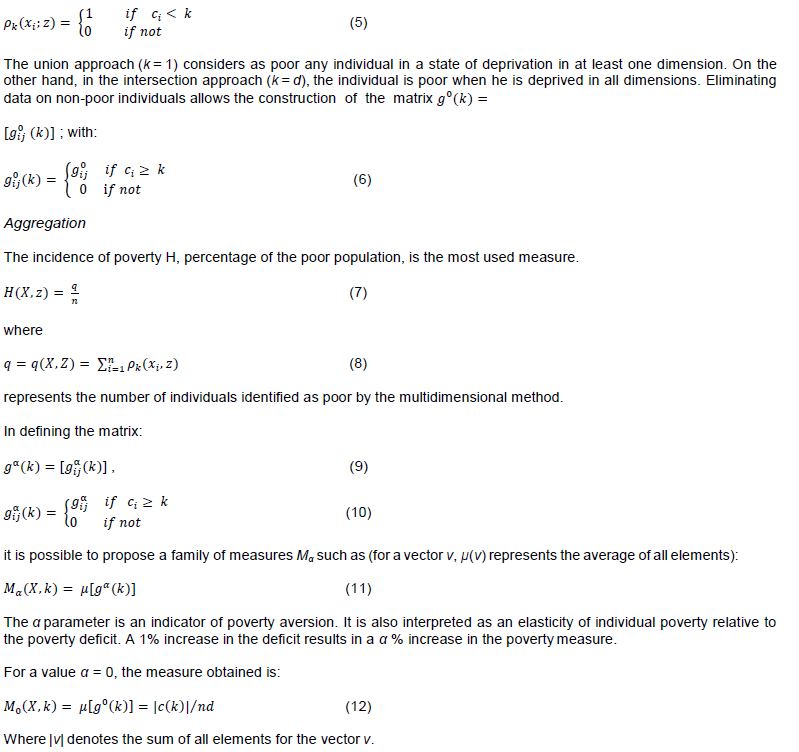
Poverty measures
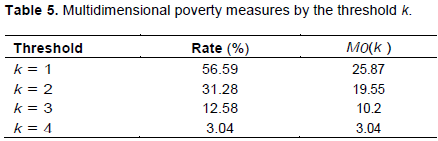
The identiï¬cation of multidimensional poor households as well as the measures depends on the threshold k, which indicates the number of deprivation dimensions needed to consider them as poor (Table 5). Equal weighting was adopted in construction measurements. The debate is very open for this choice and the literature is rich in contributions: Decancq and Lugo (2008) and Anand and Sen (1997) as examples.
Table 6 shows the different measures according to the values of k. When k = 1 (union approach), it suffices that a household suffers from deprivation in at least one dimension to be considered "poor". On the other hand, for a value of k = 4 (intersection approach), a household is considered poor only when it experiences difficulties in the four dimensions selected.
In view of the results, it should be noted that more than half (56.59%) of the population suffers from deprivation in at least one dimension. This proportion adds up to one quarter of the total deprivation (M0(1) = 25.87%) of possible deprivations equal to n×d = 5690 × 4.
For a threshold value k = 3, only households with deprivations in three or four dimensions are considered poor. For this threshold, 12.58% of households are classiï¬ed as poor. These households total deprivations equivalent to M0(3) = 10.2% possible deprivations.
An analysis of deprivations by household characteristics shows that households living in the Midwest and the North West are the most vulnerable to multidimensional poverty, regardless of the value of the threshold k. The deprivations are more felt in the dimensions of housing, health and education. Globally, the multidimensional measures are higher when the head of household is a farm worker, unemployed or a farmer.
Table 6 also shows that multidimensional poverty is more prevalent in the urban area. Research studies explained the deterioration in the living conditions of rural households by the deterioration of the terms of trade for agricultural products on the one hand and the decrease in investments in the agricultural sector on the other hand (Elloumi and Dhehibi, 2009). The rural environment seems unable to follow an economic model with high productivity. This imbalance between rural and urban areas is the result of a historical cleavage between town and country as well as the result of policies and development model for decades.
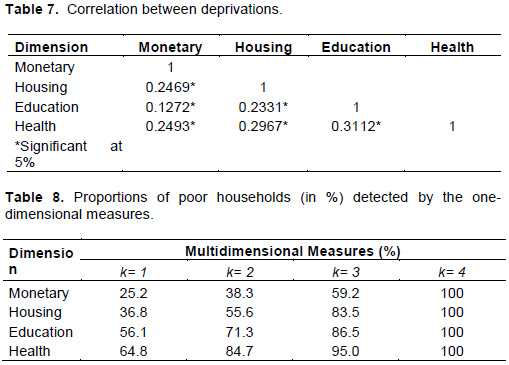
The low degree of correlation between deprivations by dimension attests to the usefulness of the multi-dimensional approach (Table 7). Indeed, each dimension provides additional information regarding the poor population. Thus, 68.95% of poor households in terms of housing are not detected by income poverty. Indeed, despite suffering from deprivation in the housing dimension, they have an income above the poverty line. This proportion climbs to 74.21% for the health dimension and 79.25% for the education dimension.
Moreover, the monetary dimension can only identify 60% of the poor population in multidimensional terms (k = 3). This proportion drops to 38.3 % when k = 2 (poor households are those experiencing difficulties in at least two dimensions). For a value of the threshold k = 3, the intersection between the multidimensional approach and the housing, education and health dimensions are respectively 83.5, 86.2 and 94.5% (Table 8).
The objective of this work was to identify multi-dimensional poverty in Tunisia and to build adapted measures. The approach adopted considered poverty in terms of capabilities according to a set of deprivations relating to different dimensions. Based on data from the 2010 National Survey on Houshold Budget, Consumption and Living Standards, indicators in four- dimensional were selected. In addition to the monetary dimension, they concern the dimensions of housing, education and health.
The measures, built on the basis of the two-threshold counting method, proposed by Alkire and Foster (2009), was applied. The results demonstrate the importance of non-monetary deprivations. They also show that more than half of the population suffers from deprivation in at least one dimension. These deprivations are widespread especially in the rural area as well as in the interior regions of the country. The risk of deprivation increases significantly when the head of the household is female or unemployed, working as a farmer, agricultural worker.
This work clarifies the nature of deprivation in Tunisia by introducing additional dimensions. We demonstrated the usefulness of this multidimensional approach. Indeed, the low correlation between deprivations by dimension attests to the contribution of each dimension to the understanding of poverty in Tunisia.
The authors have not declared any conflict of interests.
REFERENCES
|
Achour N (2011). Le système de santé Tunisien: état des lieux. Faculty of Pharmacy of Monastir.
|
|
|
|
African Development Bank (2011). Private Sector Development as an. Engine of Africa's Economic Development.
View
|
|
|
|
|
Alkire S, Foster JE (2009). Counting and Multidimensional Poverty Measurement. Oxford Poverty and Human Development Initiative OPHI Working Paper 7-5.
|
|
|
|
|
Alkire S, Santos ME (2013). A Multidimensional Approach: Poverty Measurement and Beyond. Social Indicator Research 112(2):239-257.
Crossref
|
|
|
|
|
Anand S, Sen AK (1997). Concepts of Human Development and Poverty: A Multidimensional Perspective. In: Poverty and Human Development: Human Development Papers 1997. New York: United Nations Development Programme, pp. 1-20.
|
|
|
|
|
Belhadj B (2011). A new fuzzy unidimensional poverty index from an information theory perspective. Empirical Economics 40(3):687-704.
Crossref
|
|
|
|
|
Belhadj B (2012). New Weighting Scheme for the Dimensions in Multidimensional Poverty Indices. Economics Letters 116(3):304-307.
Crossref
|
|
|
|
|
Belhadj H, Belhaj Yahia M , El Abassi A, Sabri B (2016). Rapport sur le droit à la santé en Tunisie. Tunisian Association for the Defense of the Right to Health.
|
|
|
|
|
Brandolini A, D'Alessio G (1998). Measuring well- being in the functioning space. Banca d'Italia.
|
|
|
|
|
Chiappero-Martinetti E (2000). A Multidimensional Assessment of Well-Being Based on Sen's Functioning Approach. Rivista Internazionale di Scienze Sociali 108(2):207-239.
|
|
|
|
|
Decancq K, Lugo MA (2008). Setting Weights in Multidimensional Indices of Well-being and Deprivation. OPHI working paper 18.
|
|
|
|
|
Deutsch J, Silber J (2005). Measuring Multidimensional Poverty: An Empirical Comparison of Various Approaches. Review of Income and Wealth 51:1.
Crossref
|
|
|
|
|
Foster J, Greer J, Thorbecke E (1984). A Class of Decomposable Poverty Measures. Econometrica 52(3):761-766.
Crossref
|
|
|
|
|
Elloumi M, Dhehibi B (2009). Politique agricole et pauvreté en milieu rural: une analyse par les prix agricoles et l'investissement en milieu rural tunisien. Conference Paper. Galatasaray University, Turkey.
|
|
|
|
|
Guio AC, Fusco A, Marlier E (2009). A European Union Approach to Material Deprivation using EU-SILC and Eurobarom- eter data. IRISS Working Paper Series 2009-19 December 2009.
|
|
|
|
|
Guio AC (2009). What can be learned from deprivation indicators in Europe? Eurostat methodologies and working papers. Eurostat, Luxembourg.
|
|
|
|
|
Hasnaoui L, Belhadj B (2015). Fuzzy multidimensional inequality measurement. Policies to reduce inequality in Tunisia. Euroeconmica 34(2):21-28.
|
|
|
|
|
Institut National de la Statistique INS (2010). Enquête sur la consommation des ménages 2010. Volume A, B and C.
|
|
|
|
|
Institut National de la Statistique INS (2015). Livret Enquête Nationale sur le Budget, la Consommation et le Niveau de vie des ménages, 2015.
|
|
|
|
|
Institut National de la Statistique (INS), ADB (African Development Bank), and World Bank (2012). "Mesure de la pauvreté, des inégalités et de la polarisation en Tunisie 2000-2010." Tunis, INS.
|
|
|
|
|
Lelli S (2001). Factor analysis vs. Fuzzy set theory: assessing the influence of different techniques on Sen's functioning approach. Leuven CES discussion Paper 01.21.
|
|
|
|
|
Maître B, Nolan B, Whelan CT (2014). L'indicateur EU2020 de suivi de la pauvreté et de l'exclusion : une analyse critique. Économie et statistique 469-470:147-167.
Crossref
|
|
|
|
|
Nasri K, Belhadj B (2017). Multidimensional poverty measurement in Tunisia: distribution of deprivations across regions, The Journal of North African Studies 22(5):841-859.
Crossref
|
|
|
|
|
Nolan B, Whelan CT (1996). Resources, Deprivation, and Poverty. Oxford: Clarendon Press.
|
|
|
|
|
World Bank (2016). Tunisia Poverty Assessment 2015. Poverty Global Practice Middle East and North Africa Region Maghreb Department, March 2016.
|
|
|
|
|
Sen AK (1985). Well-being, Agency and Freedom: The Dewey Lectures 1984. The Journal of Philosophy 82(4).
Crossref
|
|
|
|
|
Sen AK (1987). On Ethics and Economics. Oxford, Blackwell.
|
|
|
|
|
Sen AK (2003). Un nouveau modèle économique. Odile Jacob.
|
|
|
|
|
Zaafrane H (2014). Pour une nouvelle stratégie de l'habitat. Ministry of Equipment, Regional Planning and Sustainable Development.
|
|
|
|
|
Zedini A, Belhadj B (2015). A New Approach to Unidimensional Poverty Analysis: Application To The Tunisian Case. Review of Income and Wealth 61(3):465-476.
Crossref
|
|