ABSTRACT
The Okun’s law, which explains the inverse relationship between unemployment and output growth, has been observed to have broken down in most developing economies. The failure by researchers to take into account the asymmetric properties of the relationship between unemployment and output has been attributed to the limitations of the Okun’s law in explaining the inverse relationship between unemployment and output growth developing economies. The study was carried out with the objective of empirically testing Okun’s Law in Zimbabwe, using a two state Markov Regime Switching Model (MRSM) from 1991-2018. The study employed both the first difference approach and the gap approach with the Hodrick-Prescott (HP) and the Butterworth filters employed in determining the cyclical components of the gap models. Estimation results show that the Okun’s law is valid during economic expansions with the Okun’s coefficient having a magnitude of between -0.01 and -0.003, thereby reflecting the existence of an inverse relationship between economic growth and unemployment. The observed Okun coefficients during economic booms are however, economically insignificant and in so doing, attributes unemployment more towards structural causes and less to cyclical causes. During economic contractions, the Okun’s law was observed to have broken down and with changes in output observed to be insignificant in explaining unemployment during economic downturns. This result is attributed to the large composition of the informal sector in the economy which is an alternative source of employment to the formal sector when the economy contracts thus, making unemployment invariant to economic contractions. The study recommends that policy makers address the structural constraints to both labor supply and demand in the economy.
Key words: Economic growth, Okun’s law, regime switching, unemployment, Zimbabwe.
The Okun’s law originates from the study between unemployment and economic growth by Okun (1962) on the United States’ economy, where he observed that there was an inverse relationship between the two variables. Okun (1962) observed that a percentage increase in economic growth would result in a 0.3% decline in the unemployment rate. The Okun’s law has been observed to fit developed economies better whereas in most developing economies the law has failed to explain the inverse relationship between unemployment and output growth. Lal et al. (2010) traces the breaking down of Okun’s law in developing economies to failure by researchers to take into account of the asymmetric properties of the relationship between unemployment and output. Symmetrical studies assume that unemployment responds equally to both economic booms and contractions and therefore employ linear models, while asymmetrical studies take into consideration that unemployment responds differently to economic regimes and therefore, employ non-linear estimation methods (Harris and Silverstone, 2001; Cosar and Yavuz, 2019). Despite the success of most symmetrical studies in fitting the Okun’s Law in developed economies, Harris and Silverstone (2001) question the accuracy of the observed Okun coefficients in these studies given their use of linear regression models.
Variations in Zimbabwe’s unemployment figures have not followed countercyclical movement to changes in output due to the country’s methods of employment statistics collation. Zimbabwe’s low unemployment rate figures have been disputed as resembling those of developed economies than those of developing economies and this is due to the broad based definition, which includes informal sector employment, used in compiling employment statistics (Luebker, 2008). Figure 1 shows that during the study period, the country’s unemployment rate figures have ranged between 4.8% and 6.9% with the average unemployment rate for the period being 5.2%.
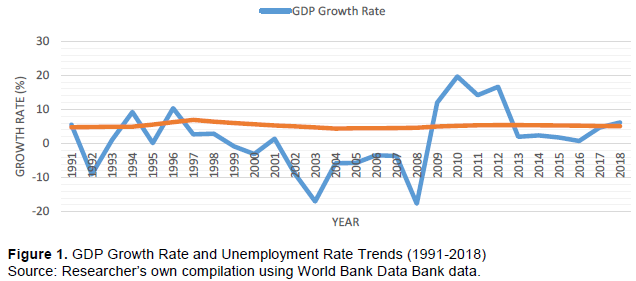
Unemployment increased from 4.8% in 1991 to 6.9% in 1997 in line with the deregulation of the labour market resonant with the economic reforms that took place under the Economic Structural Adjustment Program from 1991-1995 which resulted in retrenchments (Kanyenze, 2009; Luebker, 2008). During the crisis decade which ensued from 1998 to 2008 economic output contracted by an average of 5.6% per year and the unemployment rate declined from 6.4% in 1998 to 4.6% in 2008. The decline in the unemployment rate in the midst of a period of economic decline is reflective of the growing role of the informal sector in absorbing labour from the formal sector and the brain drain that transpired during the same period (Kanyenze, 2009; Matus et al., 2014). The post crisis period of 2009-2018 experienced significant economic growth from 2009 to 2013 but the growth did not lead to a proportionate decline in unemployment as unemployment increased from 5% in 2009 to 5.4% in 2013. Overall from 2009 to 2018 unemployment remained relatively stable reflective of the structural constraints in employment creation amongst which included a difficult business operating environment, low capital investment and declining aggregate demand (Matus et al., 2014).
The study seeks to examine the existence of asymmetry in the Okun’s law in Zimbabwe using the two-stage Markov Regime Switching model (MRSM) and in turn to determine if unemployment is cyclical or structural. The study draws its significance mainly on the empirical front where it seeks to add to the scarce literature on the potential asymmetrical properties of the Okun’s law in Zimbabwe. On the policy front, the study helps determine if economic growth in Zimbabwe is accompanied by employment creation which is important in ensuring shared growth and poverty eradication in Zimbabwe (Kanyenze, 2009; Kanyenze et al., 2011).
Lee (2000) investigated the robustness of the Okun’s Law in 16 OECD countries and observed EU countries had lower Okun coefficients compared to the US. Zagler (2003) performed a study on France, Germany, Italy and the UK and observed that the short-run relationship between output and unemployment was consistent with Okun’s Law but inconsistent in the long run. Studying Greece’s 13 regions, Christopoulos (2004) found the Okun’s Law to be valid in 6 of the 13 Greek regions.
In Spain, Villvarde and Maza (2008) tested the validity of Okun’s Law in 17 Spanish regions and found the Okun’s Law to be valid in at least 11 out of 17 regions. In a study of Greece, Portugal, Italy and Spain, Dritsak and Dritsaki (2009) found the Okun coefficient to be present in Portugal, Italy and Spain.
Ball et al. (2012) found the Okun coefficient was present in the US economy and 19 other advanced economies under study with the exception of the German economy. In a study of 15 EU countries Fernandez et al. (2018) empirically determined the Okun’s law per age and gender groups and found that EU countries experienced smaller output loss when unemployment is high and that older age groups were less exposed to cyclical unemployment. In a panel data analysis of 8 Eastern European countries from 1992-2014, Soylu et al. (2018) found the Okun Law to be valid in the 8 Eastern European countries in both the short run and long run.
In a study of China, Pakistan, India, Sri-Lanka and Bangladesh, Lal et al. (2010) observed that the Okun’s Law to be valid in Pakistan, India and Bangladesh in the long run with Law breaking down in the short run for all countries. In Jordan, Kreishan (2011) found economic growth to be insignificant in explaining unemployment. Khrais and Al Wadi (2016) performed a study on 20 Middle East Nation Association countries and found that out of the 20 countries under study only Egypt, Jordan and United Arab Emirates was the Okun’s Law valid. Pata et al. (2018) observed uni-directional causality from economic growth to three unemployment age groups of 15-24, 25-54 and 15-64, and thereby charactering unemployment in Turkey as cyclical.
In Africa, Kamgnia (2009) conducted a study of 39 countries and observed that overall economic growth led to growth in employment. In a study of 46 Sub-Saharan African economies, Karim and Aomar (2016) found that the Okun’s Law failed to hold in most African countries and economic regions. Abraham (2017) conducted a study that encompassed 23 low-income countries in Sub-Saharan Africa and observed that the Okun’s Law was only valid in 14 out of the 23 countries under study, excluding Zimbabwe. Abraham and Nosa (2018) tested the validity of the Okun’s Law in 6 upper middle income countries in Sub Saharan Africa and observed countries with high rates of economic growth to exhibit the Okun coefficient while countries with low output growth failed to exhibit the Okun coefficient.
In a group of studies that factor in asymmetry in the Okun’s law, Harris and Silverstone (2001) found that unemployment was more sensitive to economic contractions than economic expansion in seven OECD countries. Fouquau (2008) employed the two states, MRSM on 20 OECD countries and observed that for most countries in the study the Okun’s law was weak in explaining the relationship between unemployment and output growth. In South Africa, Phiri (2014) observed that the Okun’s law held in the long run for South Africa with uni-directional causality from unemployment to economic growth. In Zimbabwe, Ngundu et al. (2018) employed the MRSM Error Correction Model and found the employment elasticity of growth to be to be positive and asymmetric in the short-run. In Turkey, Cosar and Yavuz (2019 employed the MRSM and observed unemployment was more responsive to economic contractions than downturns.
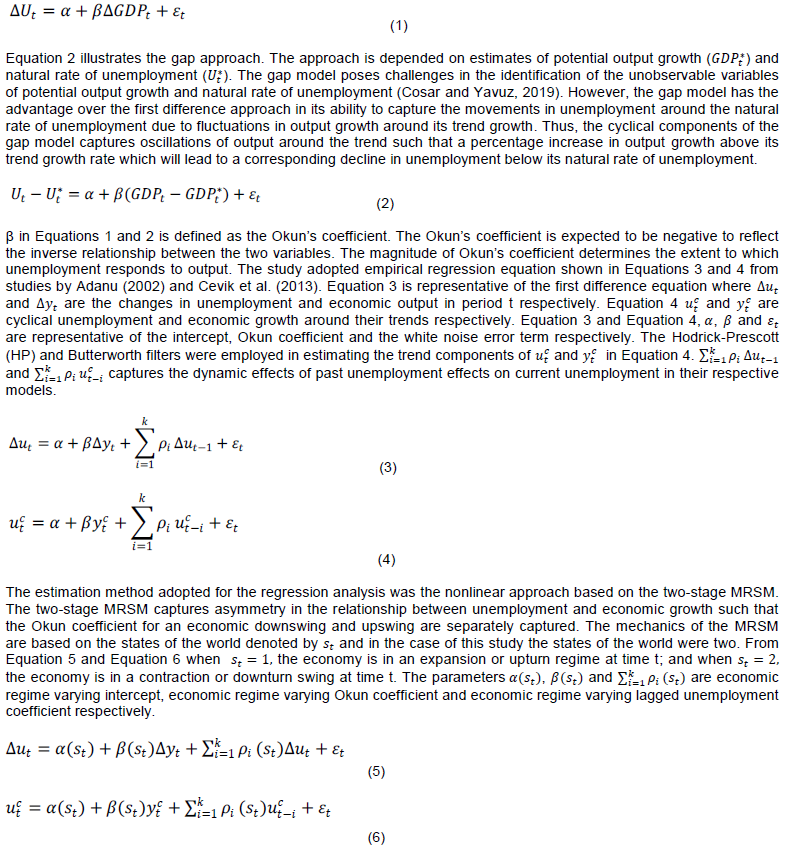
Okun (1962) developed the unemployment-output relationship using the first difference and the gap empirical approaches. The first difference approach illustrated in Equation 1 demonstrates that changes in unemployment in period t are related to quarterly changes in real economic output in that same period t. The first difference in approach provides a convenient way of establishing stationarity (Lee, 2000; Fouquau, 2008).
The MRSM is founded on the Maximum Likelihood method based on the Expectation Maximization algorithm (Cevik et al., 2013). The method provides both parameter estimates and the transition probabilities from one economic regime to another. The parameters are obtained in a two stage process that involve firstly, the expectation step which encompasses filtering and smoothing of conditional probabilities of future states, given past states and transition probabilities from one state to another. Lastly, the maximisation stage at which the smoothed probabilities obtained from the first process replace the conditional regime probabilities obtained in the maximisation stage with this final process resulting in estimation parameters and transition probabilities (Wang, 2003; Cevik et al., 2013).
Estimation techniques
The estimation of the unobservable variables of u* and y* in the cyclical components of Equation 6 requires the use of trend filters. The study employed the HP filter and the Butterworth filter. Each filter has its own strength and weakness, thereby affecting the sensitivity of coefficients (Lee, 2000; Phiri, 2014; Cevik et al., 2013). For the HP filter Lambda was set to 100, while the moving average period for the Butterworth filter was set to 2. The use of two trending techniques ensured robust regression analysis (Phiri, 2014).
Data observations for use in Equations 5 and 6 must be stationary as use of non-stationary series in regression analysis will lead to faulty estimate results that can give misleading conclusions. The Augmented Dick-Fuller (ADF) test was employed for this purpose. The model adopted for the study has a dynamic component in the form of the lagged unemployment term. Optimal lag selection was done using the Schwartz Bayesian Information Criterion (SBIC), Akaike Information Criterion (AIC) and the Hannan Quinn Criterion (HQIC). To establish the suitability of a non-linear regression analysis the study adopted the Likelihood Ratio (LR) linearity test employed by Cevik et al. (2013). The LR test is based on the null hypothesis denoted by the log likelihood of a linear model and an alternative hypothesis denoted by the log likelihood of a non-linear model. Rejection of the null hypothesis is determined by the p-value of the LR test. Tests on the residuals are not a pre-requisite for the MRSM as normality and homoscedasticity are not expected in the residuals (Brooks, 2008).
However, for diagnostic purposes, tests for normality, homoscedasticity and serial correlation were conducted using the normality test, correlogram Q2 test and the correlogram Q test respectively.
Data sources and limitations
The study employed time series data from the 1991 to 2018 obtained from the World Bank Data Bank, 2020. The study period was guided by the availability of data.
Unit root test
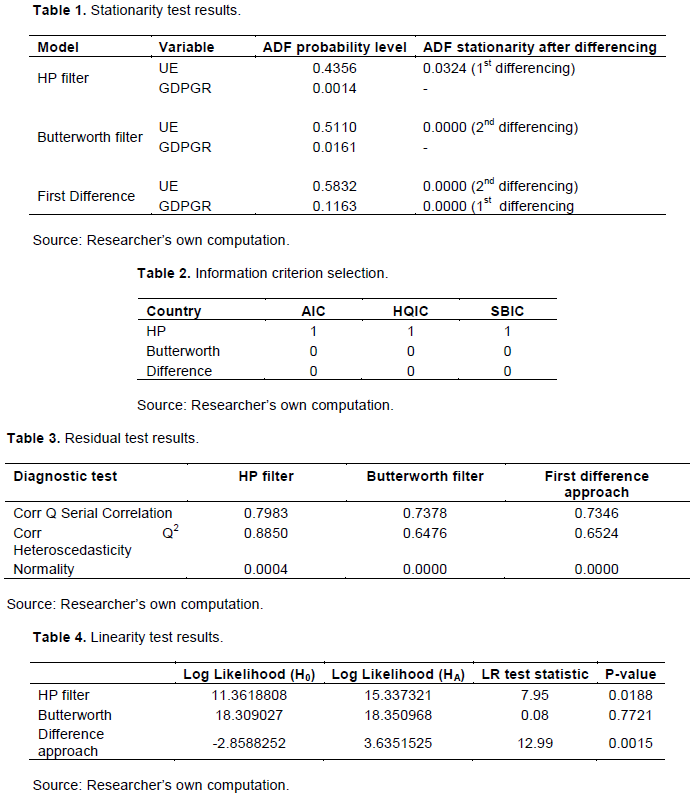
Table 1 shows the ADF stationarity test results for the three models’ variables. The HP filter model UE was stationary after first differentiation, while GDPGR was stationary in levels. The Butterworth model’s UE was stationary after differencing the variable twice with GDPGR being stationary in levels. For the first difference model, UE was stationary in second difference and GDPGR in first difference.
Lag selection
Lag selection for the autoregressive term in the estimation equation was guided by the AIC, HQIC and SBIC. For the HP filter model, all three information selection criterions agreed on an optimal lag length of 1; thus, the AR lag length for UE was 1. For the Butterworth filter and the first difference models, all three information selection criterions agreed on the lag length of 0 for UE (Table 2).
Diagnostic test results
Table 3 shows test results conducted on the estimated residuals. The correlogram Q test was tested for serial correlation to which no serial correlation was observed in the residuals of all three models. The test statistics of the three models led to the acceptance of the null hypothesis of no serial correlation in the residuals. The correlogram Q2 tested for heteroscedasticity in the residual and no heteroscedasticity was found present in the residuals of all three models. The p-values for the three tests led to the acceptance of the null hypothesis that states that the residual is homoscedastic at 5% level of significance. The test for normality found the residual to be normally distributed for all three estimation equations.
Linearity test
A LR test was conducted to determine the suitability of a non-linear model in estimating the regression equations. The null hypothesis denotes the log likelihood of a linear model, while the alternative hypothesis denotes the log likelihood of a regime-switching model. However, the LR model cannot directly compare a linear model to a regime-switching model due to the differences in the number of states. To adjust to this, the study turned the coefficients of the explanatory variables with the exception of the intercept into non-varying coefficients to obtain a closer approximation of a linear model as conducted by Cevik et al. (2013). Results in Table 4 showed that the HP filter and the first different estimates are better suited to a non-linear model. However, the Butterworth filter estimates were observed to be better suited to a linear model.
Table 5 presents the estimate results from the two-stage MRSM. Regime 1 is an economic upswing or boom and regime 2 is an economic downturn or contraction. HP filter estimate results validated the Okun coefficient in an economic upswing at 5% level of significance. In the downswing, the Okun Law broke down as the coefficient turned positive and insignificant in explaining the relationship between output and unemployment. The state varying variances could not be obtained due to the presence of a discontinuous region in the cyclical data.
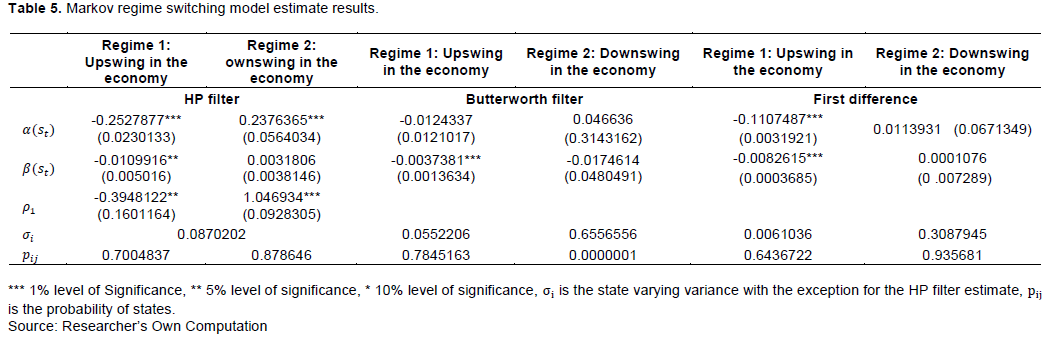
Butterworth filter estimation results produced an Okun coefficient significant at 1% level under an economic boom. The Okun coefficient was also validated in an economic upturn but found to be insignificant in explaining the relationship between economic growth and unemployment.
Lastly, the first difference estimation showed that the Okun coefficient exists in an economic upturn and was significant at 1% level. However, the Okun’s Law broke down in an economic contraction with the coefficient also observed to be insignificant in explaining the relationship between the two variables. Results in Table 5 shows an asymmetric relationship between unemployment and economic growth, where the Okun’s Law was validated under economic booms across all three models. The HP filter results showed that a 1% increase in GDPGR above its potential would result in a 0.01% decline in unemployment. The Butterworth filter estimate results showed that a 1% increase in GDPGR above its trend would lead to a 0.004% decline in unemployment. The first difference model showed that a 1% increase in GDPGR would lead to a 0.008% decline in unemployment. However, despite the Okun coefficients being statistically significant, the coefficients were economically insignificant as they were relatively lower than Okun coefficients from other regional studies. Karim and Aomar (2016) found the Okun coefficient for Southern African nations such as Malawi to range between -0.06 and -0.02, Mozambique between -0.08 and -0.03; thus reflecting that unemployment was more responsive to economic growth for these countries when compared to Zimbabwe. The low magnitudes of the Okun coefficients can be attributed to the structure of the Zimbabwean economy (Kanyenze, 2009) and the growing importance of the informal sector (Karim and Aomar, 2016). The informal economy of Zimbabwe constitutes 60.8% of the economy (Medina and Schneider, 2018) and absorbing at least 80% of total employment in the economy with most of the employment opportunities being in the agricultural sector (ZIMSTAT, 2020b). However, the agricultural sector suffers from over-employment and unable to create more employment opportunities. Moreover, constraints to sourcing foreign currency for capital imports to increase labor productivity have also limited the scope for informal manufacturing industries to create employment (Matus et al., 2014). Soylu et al. (2018) also observed the lack of capital as a key factor of unemployment in developing countries. Moreover, in the formal sector, which is less dominant, growth is concentrated in capital intensive production industries (ZIMSTAT, 2020a) with low labor requirements (Matus et al., 2014).
The breakdown in the Okun’s law during economic contractions may be attributed to the high levels of informal activities in the economy. Makochekanwa (2012) as well as Medina and Schneider (2018) observe that as employment in the formal sector declines due to an economy recession, the informal sector absorbs some of the labor, such that the rate of unemployment scarcely rises. It is observable that unemployment in Zimbabwe is structural and not cyclical and attempts to further reduce unemployment through demand side policies may lead to jobless growth.
The existence of asymmetry in the Okun’s law in the case of Zimbabwe was proven. The Okun’s coefficient was observed to hold during periods of economic expansion and to have broken down during periods of economic contraction. However, the Okun’s coefficient was economically insignificant in influencing unemployment; thereby displaying the presence of structural unemployment as opposed to cyclical unemployment. The results show that attempts by policymakers to reduce unemployment rates through the stimulation of demand alone will be insufficient until constraints to labour demand and supply are addressed. Despite the growing recognition of the importance of the informal sector, employment in the sector is of low productivity and not sufficient enough to be categorized as decent employment. Future studies may need to narrow down the definition of unemployment by disaggregating productive employment, which is mostly prevalent in the formal sector, from the low productive employment, which is common in the informal sector, and estimate the Okun’s Law using data on formal unemployment and economic growth.
The author has not declared any conflict of interests.
REFERENCES
|
Abraham IO (2017). Youth Unemployment and Economic Growth: Lesson from Low-Income Countries in Sub-Saharan Africa. European Journal of Economics, Law and Politics 4(2):1-15.
|
|
|
|
Abraham IO, Nosa AL (2018). Unemployment and Output Growth: Evidence from Upper-Middle-Income Countries in Sub-Saharan Africa. American Economic and Social Review 3(1):32-43.
Crossref
|
|
|
|
|
Adanu K (2002). A Cross-Province Comparison of Okun's Coefficient for Canada. University of Victoria Working Paper EWP 0204. Available at:
View
|
|
|
|
|
Ball L, Leigh D, Loungani P (2012). Okun's Law at 50? 13th Jacques Polak Annual Research Conference November 8-9 2012. International Monetary Fund. Available at:
View
|
|
|
|
|
Brooks C (2008). Introductory Econometrics for Finance 2nd Edition. New York: Cambridge University Press pp. 451-469.
Crossref
|
|
|
|
|
Cevik EI, Dikooglu S, Barisik S (2013). Asymmetry in Unemployment-Output Relationship over the Business Cycle: Evidence from Transition Economies. Comparative Economic Studies 55(4):557-581.
Crossref
|
|
|
|
|
Christopoulos DK (2004). The Relationship between Output and Unemployment: Evidence from Greek Regions. Review of Economic Design 83(3):611-620.
Crossref
|
|
|
|
|
Cosar EE, Yavuz AA (2019). Is there Asymmetry between GDP and Labour Market Variables in Turkey under Okun's Law? Central Bank of the Republic of Turkey, Working Paper No. 19/27. Available at:
View
|
|
|
|
|
Dritsaki C, Dritsaki N (2009). OKun's Coefficient for Four Mediterranean Member Countries of EU: An Empirical Study. International Journal of Business and Management 4(5):18-26.
Crossref
|
|
|
|
|
Fernandez CB, Prieto DC, Saez MP (2018). Okun's Law in Selected European Countries (2005-2017): An Age and Gender Analysis. Economics and Sociology 11(2):263-274.
Crossref
|
|
|
|
|
Fouquau J (2008). Threshold Effects in Okun's Law: A Panel Data Analysis. Economic Bulletin 5(33):1-14.
|
|
|
|
|
Harris R, Silverstone B (2001). Testing for Asymmetry in Okun's Law: A Cross Country Comparison. Economic Bulletin 5(2):1-13.
|
|
|
|
|
Kamgnia DB (2009). Growth Intensity of Employment in Africa: A Panel Data Approach. Applied Econometrics and International Development 9(2):161-174.
|
|
|
|
|
Kanyenze G (2009). Labour Markets and the Rebuilding of Human Capital. Comprehensive Economic Recovery in Zimbabwe. Working Paper 3. Available at:
View
|
|
|
|
|
Kanyenze G, Kondo T, Chitambara P, Martens J (2011). Beyond the Enclave: Towards a Pro-Poor and Inclusive Development Strategy for Zimbabwe. Harare: Weaver Press. Available at:
View
Crossref
|
|
|
|
|
Karim E, Aomar I (2016). Policy Lessons from Okun's Law for African Countries. Workshop on Global Labour Markets, IMF-OCP Policy Center-Brunel University. Available at:
View
|
|
|
|
|
Khrais I, Al Wadi M (2016). Economic Growth and Unemployment Relationship: An Empirical Study for MENA Countries. International Journal of Managerial Studies and Research (IJMSR) 4(12):19-24.
Crossref
|
|
|
|
|
Kreishan F (2011). Economic Growth and Unemployment: An Empirical Analysis. Journal of Social Science 7(7):228-231.
Crossref
|
|
|
|
|
Lal I, Sulaiman D, Jalil MA, Hussain A (2010). Test of Okun's Law in some Asian Countries: Co-Integration Approach. European Journal of Scientific Research 40(1):73-80.
Crossref
|
|
|
|
|
Lee J (2000). The Robustness of Okun's Law: Evidence from OECD Countries. Journal of Macroeconomics 22(2):331-356.
Crossref
|
|
|
|
|
Luebker M (2008). Employment, Unemployment and Informality in Zimbabwe: Concepts and Data for Coherent Policy-Making. ILO Sub-Regional Office for Southern Africa Integration Working Paper No. 9:32. Available at:
View
|
|
|
|
|
Makochekanwa A (2012). Measuring the Second Economy in Zimbabwe. Botswana Journal of Economics 10(4):27-58.
|
|
|
|
|
Matus RJ, Hansen A, Zhou H, Derman K, Pswarayi T (2014). Workforce Connections: Zimbabwe Labour Market Assessment. USAID Mission and FHI360. Available at:
View
|
|
|
|
|
Medina L, Schneider F (2018). Shadow Economies around the World: What did We Learn the Last 20 years? IMF Working Paper WP/18/17. Available at:
View
|
|
|
|
|
Medina L, Jonelis A, Cangul M (2016). The Informal Economy in Sub- Saharan Africa: Size and Determinants. IMF Working Paper WP/17/156. Available at: View
Crossref
|
|
|
|
|
Ngundu T, Kupeta KM, Ropi N (2018). Dynamics of Output and Formal Employment in Zimbabwe. Reserve Bank of Zimbabwe Working Paper Series No. 2. Available at:
View
|
|
|
|
|
Okun AM (1962). Potential GNP, Its Measurement and Significance. Cowles Foundation, Yale University. Available at:
View
|
|
|
|
|
Pata UK, Yurtkuran S, Kalcu A (2018). A Revisited Causality Analysis of Okun's Law: The Case of Turkey. Theoretical and Applied Economics 25(4):121-134.
|
|
|
|
|
Phiri A (2014). Nonlinear Co-integration between Unemployment and Economic Growth in South Africa. Managing Global Transitions 12(4):303-324.
|
|
|
|
|
Soylu OZ, Cakmak I, Okur F (2018). Economic Growth and Unemployment Issue: Panel Data Analysis in Eastern European Countries. Journal of International Studies 11(1):93-107.
Crossref
|
|
|
|
|
Villvarde J, Maza A (2008). The Robustness of Okun's Law in Spain: 1980-2004 Regional Evidence. Journal of Policy and Modelling 31(2):289-297.
Crossref
|
|
|
|
|
Wang P (2003). Financial Econometrics Methods and Models. London: Routledge Taylor and Francis Group. pp. 82-98.
|
|
|
|
|
World Bank Data Bank (2020). Available at:
View.
|
|
|
|
|
Zagler M (2003). A Vector Error Correction Model of Economic Growth and Unemployment in Major European Countries and An Analysis of Okun's Law. Applied Econometrics and International Development 3(3):93-118.
|
|
|
|
|
ZIMSTAT (2020a). Quarterly Digest of Statistics Fourth Quarter 2019. Available at:
View
|
|
|
|
|
ZIMSTAT (2020b). 2019 Labour Force and Child Labour Survey. Available at:
View
|
|