ABSTRACT
Human well-being was obsessed with the natural scheme that provides various functions vital to support management at various levels. Land use/ land cover (LULC) dynamics over 45 years within four intervals (1972, 1986, 2008, and 2017) to evaluate its influence on ecosystem services. Geographic information system (GIS) and global value of coefficients’ database together with LULC dynamics were used to determine ecosystem service values (ESV). The results showed that cultivated land and settlement land expanded by 67.38 and 532% respectively whereas forest land, shrub land and grassland declined by 66.35 and 18.36% respectively over the analysis period. A decline of total ESVs from US$ 35.23 million in 1972, to 33.61, 27.91 and 25.87 million in 1986, 2008 and 2017, respectively. Approximately US dollar of 9.37 million ESVs were lost owed to LULC changes from 1972 to 2017 in the sub-watershed. In terms of ES functions, erosion control, nutrient cycling, climate regulation and raw material provisions were the key bringers to loss of ESV. Global ESV data sets together with LULC change information helps to make a possible judgment about past environmental changes and reliable results achieved to make sound decisions. The decline of ESV was an indication of environmental degradation in the sub-watershed and needs future appropriate intervention policies in land conservation.
Key words: Land use/Land cover, Bilate Alaba subwatershed, ESV, geographic information system (GIS), remote sensing, landsat image.
Ecosystem services (ES) defined as situations through which natural ecosystem support and sustain human life, maintain a healthy environment and support production of goods such as fuels or fibers (Daily et al., 1997), offer services varied both quality and quantity (MEA, 2005). Goods and services derived from Ecosystem functions benefit man both directly and indirectly in the territorial environment (Costanza et al., 1997). Ecosystem services categorized in different ways based on functional groupings, production, and information services (MEA, 2005; De Groot et al., 2002; Lobo, 2001). Agricultural activities including cultivation in various watersheds had modified the existing landscapes; the conversion of the natural ecosystem to agriculture would have a strong impact on the watershed capacity to produce important ecosystem functions (Power, 2010). Land use changes focusing on cultivation and settlements were the major human activities that influence the ES (Kindu et al., 2016; Tolessa et al., 2017a).
The changes in ecosystem services were varied on the spatial and temporal distribution of land use/land cover (Bryan, 2013; Hu et al., 2008). Ecosystem service is defined as the ecology provisions any kinds which make the sustainable life of human being in the biosphere (Li et al., 2017). In terms of functionalities, ES is categorized into four major components; provisioning, regulating, cultural, and supporting services (MEA, 2005). An ecosystem service is correlated to changes in LULC in certain areas in the global world (Yirsaw et al., 2017).
LULC dynamics has direct effects on ecosystem services (Hu et al., 2008; Polasky et al., 2011). LULC change influenced the variation of ES components (an increase of some services on the contrary decreasing others) that would affect human beings needs, indicating ecological disturbances (Polasky et al., 2011). Land use altered some ecosystem services, affected social and government practices (Garcia-LIorente et al., 2015).
Land use changes (cultivation and settlements) were dominant in rural landscapes influencing ecosystem services in most parts of Ethiopia. LULC and ecosystem services valuation information would facilitate to identify the mainly exposed to alter in ecosystem services at the watershed scale. Most studies conducted to monitor LULC change in Ethiopia given little attention to address the influence on ecosystem services (Tolessa et al., 2018). Inside current science, an ecosystem service global database is commonly used for assessment of ESs together with the investigation of LULC changes intended for various biomes (Costanza et al., 2014).
In Ethiopia rural landscapes, LULC changes were a very common occurrence in which agriculture and settlements had been affecting ecosystem services. Furthermore, most studies in the country focused on LULC detection and its causes Ethiopia (Tsegaye et al., 2010; Meshesha et al., 2014). The influence of LULC changes on rural ecosystem services which are important in watershed scales are not recognized (Kindu et al., 2016). The objective of this study is to evaluate the influence of LULC changes occurred over the past four decades (1972-2017) on ecosystem service values in the Bilate Alaba sub-watershed of the Southern Ethiopian and to investigate changes of individual ecosystem service function.
Description of the Study area
Bilate Alaba sub-watershed located in Alaba woreda, Southern Ethiopia about 310 km south of Addis Ababa and about 85 km southwest of the Southern regional state capital of Hawassa. The sub-watershed has lied UTM coordinates of 387500 to 413750 m north latitude and 797000 to 824500 m east longitude (Figure 1). The sub-watershed comprises 45 rural kebeles and one town of Alaba wereda (kulito town).
The elevation ranges from 1613 to 2201 m above seas level, but the majority of the sub-watershed is found at about 1880 m above sea level, the sub-watershed coverage estimated is about 403 km2, it is proper for crop production and animal husbandry because of its major portion is flat with regard to its landscape.
The major soils of the subwatershed are Andosol, Chromic Luvisols, Phaeozem and Nitisol (FAO, 1998). The soils in the study area are potentially fertile if properly managed through various soil management practices and smallholders can get reasonable yield without application of inorganic fertilizers. The nature of the soil in the study area have been detached by both water and wind resulted from the development of huge gullies in the northern and eastern parts; in some north-eastern part it was totally removed and degraded by the effects of cattle and human interference of the natural ecosystem (IPMS, 2005).
Agro-ecologically, the sub-watershed is characterized as Subtropical zone (IPMS, 2005) having the mean precipitation of 1093 mm per year and the average annual temperature value of 21°C. It has received bimodal rainfall where the main rainfalls (kiremt) are from July to October whereas small rains (belg) are between March and April. Rainfalls in both seasons were erratic unevenly distributed resulted in crop failures in most parts of the sub-watershed.Maize, sorghum, wheat, pepper and haricot beans are the common rain-fed crops grown in the area.
All these crops are mana ged using traditional agricultural techniques and equipment. Moreover, a few types of vegetables and livestock feed like rodus grass and cowpea are grown with the help of small irrigation scheme (IPMS, 2005). The population of livestock exceeded the available feed sources in the sub-watershed has affected animal production in existing crop-livestock farming systems.
DATA SOURCES AND MATERIALS
Time series data for LULC changes created from Landsat images of four periods (1972, 1986, 2008 and 2017) acquired from the United State Geological Survey (USGS) source (Table 1). Topographic maps were used for verification of 1972 Landsat image since Google earth was not functioning on this time series. ERDAS Imagine 14.0 was used for image process techniques, and ArcGIS 10.1 software was implemented for the production land use land cover maps. Dry season images were selected in order to get clear images, not having clouds to facilitate the image classification without difficulty, along years the same cropping season.
Classification and processing of images
Evaluation of LULC changes was carried out using supervised classification specifically maximum likelihood approach of the Landsat images (Jensen, 2007). Images of a similar season were used to reduce the misclassification. For this study, five LULC types were recognized (Table 2). Field visits, as well as discussion with key informants, were conducted to encompass a clear judgment of the major classes of LULC.
In addition to image classification, a field visit was conceded to collect data for Ground Control Points (GCPs). Classified LULC using image classifications were cross-checked with ground truth data with the support of the global positioning system (GPS) which is generated during field trips. To monitor a correctness of the categorization method, 660 GCPs were collected using GPS from the field and Google Earth. Overall LULC classification was based on the general framework presented in Figure 2 (Alemu et al., 2015).
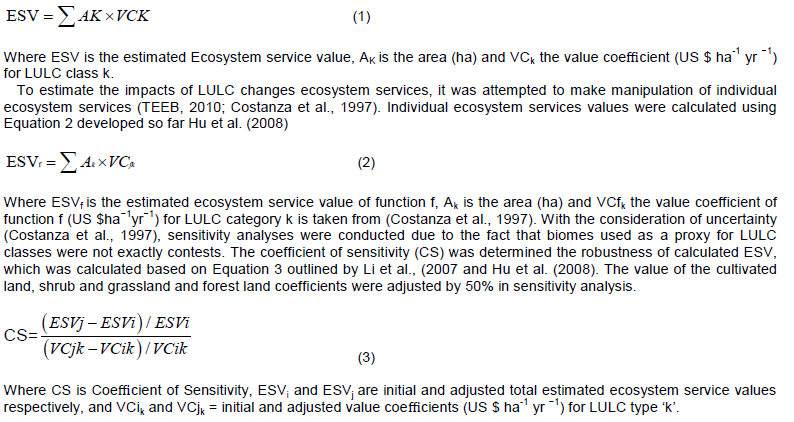
The overall producer’s accuracy of LULC map of the sub-watershed was 92.9%, overall user’s accuracy was 93.3% and overall kappa statistics was 91.1%, met the requirement outlined by (Anderson et al., 1976). Hence, the data considered for auxiliary evaluation of values of ecosystem services for five LULC classes. ArcGIS was used to analyze LULC data and ecosystem services valuation (ESV) for different biomes was computed by following the methods of (De Groot et al., 2012; Li et al., 2007; Hu et al., 2008).
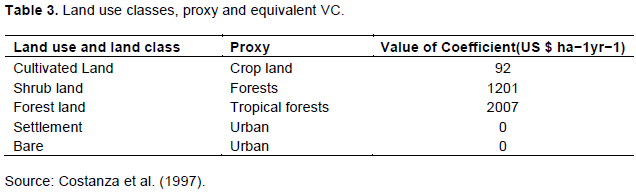
The global databases were used for five LULC classes to estimate the values of ecosystem services (Costanza et al., 1997). The identified major LULC was not matched with existing biomes (Costanza et al., 1997), a replacement for each LULC classes was used for forest, shrub and grassland, settlements and cultivated lands (Table 3).
LULC dynamics analysis
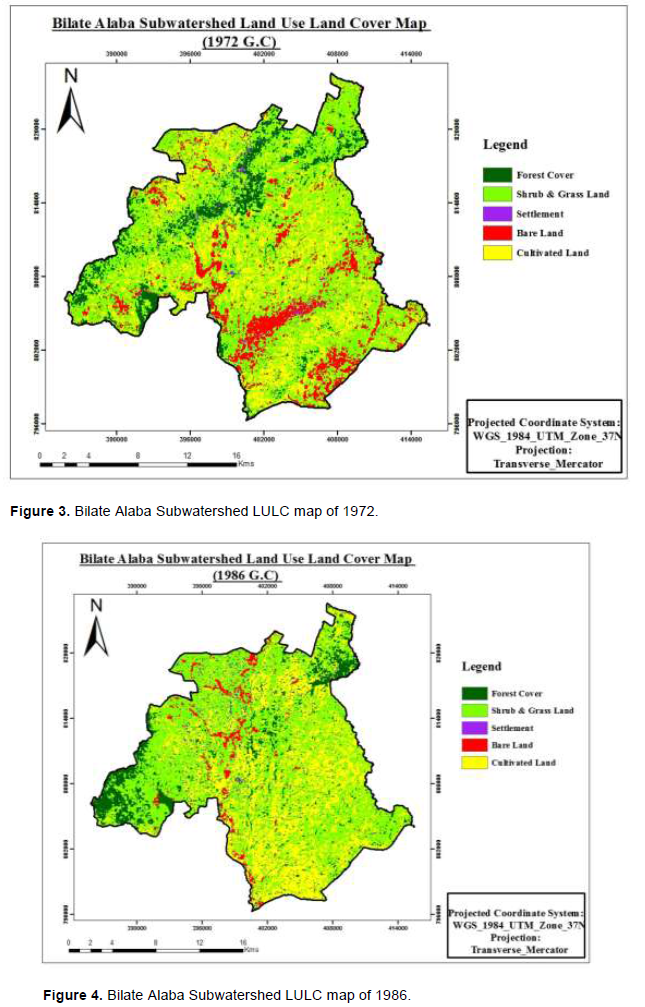
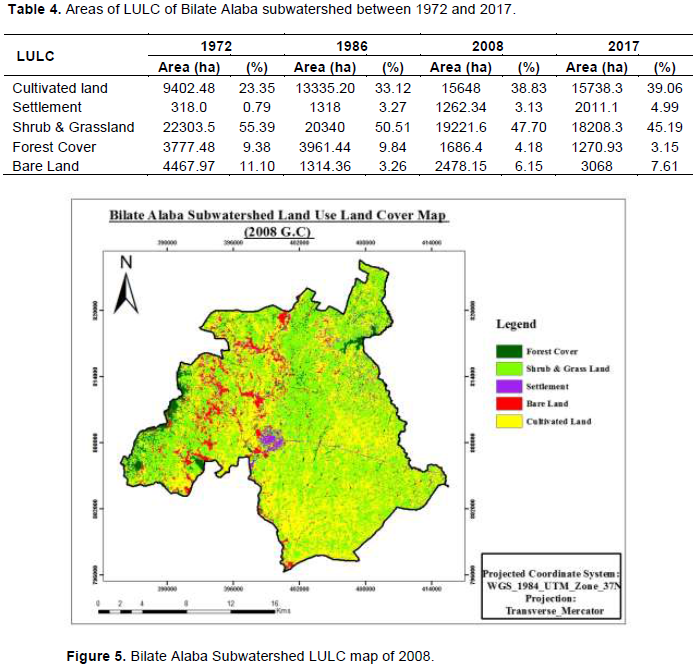
Generally, there were five LULC classes identified; cultivated land, forest land shrub and grassland, bare land and settlement (Figures 3 and 4). The largest coverage of sub-watershed was the shrub and grassland in all years (Figures 3, 4, 5 and 6); while in terms of the categories of shrub and grass land and cultivated land encompassed the biggest of the sub-watershed. Cultivated land increased from 23.1% (9402.48 ha) in 1972 to 33.79% (13745.20 ha) in 1986, to 38.82% (15648 ha) in 2008 to 39.14% (15728 ha) in 2017. The settlement was also overspread followed the similar trend as cultivated land, and its area became highest in 2017 compared with the land cover in 1972 (Table 4 and Figure 3).
On the contrary, the forest land reduced from 9.28% in 1972 to 9.48% in 1986 to 4.16% in 2008, auxiliary to 3.15% into 2017. Similarly shrub and grassland declines from 55.39% in 1972 to 50.51% in 1986 to 47.70% in 2008, further to 45.19% in 2017. Nevertheless, settlement and bare land showed incoherent styles of changes (Table 4, Figures 4, 5 and 6). Similar result obtained by (Zeleke and Hurni, 2001; Tolessa et al., 2017b; Meshesha et al., 2016; Gashaw et al., 2017; Alemu et al., 2015) forest land was shrinking, while settlement and agricultural land increased significantly whereas Bewket (2002), Fentahun and Gashaw (2014) found the opposite, in terms of magnitude for changes. Zeleke and Hurni (2001) reported an increase in cultivated lands by 38% in 38 years (1957-1995). Similarly, Belay (2002) reported an increase in croplands only by 5.5% within the interval of 1957-2000; an increase in of forest land at the expense of cropland documented elsewhere in Ethiopia (Amare et al., 2011; Asmamaw et al. 2011).
Land use policy in Ethiopia has been changed remarkably since 1972 because there was a change of regime from feudal to the Derg regime (Reid et al., 2000). During Hail Selassie regime, he encouraged commercialization and mechanization of agriculture. Firms were easily accessed tractors and fertilizers on loan basis (Kibret et al., 2016). However, the state was owned land in the Military regime and it was communal property (land reform) with the promotion of cooperatives in the villagization programme across the country resulted in depletion of natural resources and cultivation of land became increased, forests were cleared, lands highly degraded. When Ethiopian People Revolutionary Democratic Front (EPRDF) took power after the downfall of military regime was kept the same land policy which encouraged smallholders to put extra forest area to cultivation to produce high value-crops for possible markets and agro-processing plants (Dejene et al., 2013) favored mixed economy. Rural land utilization proclamation was effective in SNNPR since 2007 focused on citizens had got land certificates and given the use right based on the federal level government land use policy; there were no significant changes in land management’s by farmers after the effect of the proclamation (SNNPR, 2007) farmers had strong fear lead to conflicts due to land registration (Zerga, 2016).
Ecosystem services values of land uses
ESV of shrub and grassland land use was decreased, while cultivated land increased (Table 5). Considering ecosystem service value changes across the different intervals, 1972-1986, 1986-2008, 2008-2017 and 1972-2017, shrub and grassland ecosystem services decreased while cultivated land use ecosystem service increased.
It was observed there was a rising trend in forest land use ESV from 1972 to 1986, then a decline for 1986- 2017; general trend showed a decreasing tendency. Considering ESV values across land use classes, Shrub and grassland use system had the highest value in all study years (1972-2017). Ecosystem services value was reduced from US$ 35.23 million in 1972 to US$ 25.87 million in 2017, with the net loss of US dollar of 9.37 million (Tables 5 and 6) which was 26.6% in the sub-watershed.


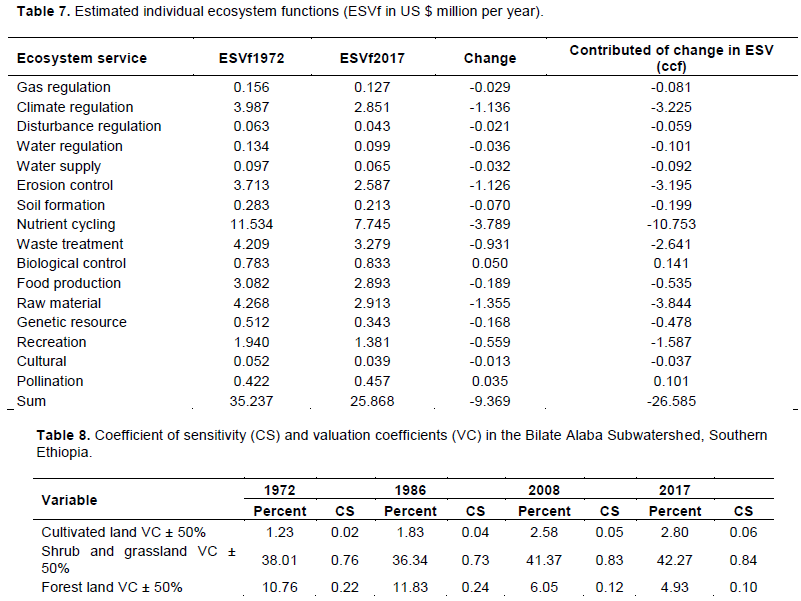
Regarding to individual ecosystem service functions, nutrient cycling (US$ 3.789 million), climate regulation (1.136 million), and raw material (US$ 1.355 million), and erosion control (US$ 1.126 million) were reduced, whereas biological control (US$ 0.05 million) and pollination (US$ 0.035 million) were gained in ESV (Table 7). The average ESV of the land use in sub-watershed was lower than other results such as in Dendi District (Tolessa et al., 2018), Gedeo–Abaya, Southern Eastern escarpment (Temesgen et al., 2018) and Munessa-Shashemene landscape (Kindu et al., 2016) whereas higher than in Chillimo forest (Tolessa et al., 2017b) and Andassa watershed upper Nile basin (Gashaw et al., 2018).
The coefficients of sensitivity (CS) of these investigations were smaller than one in all land uses. The value of the ESV coefficients of selected land uses 50% adjustment results shown in (Table 8), CS varied from a small of 0.02-0.06 for cultivated land to a larger of 0.73-0.84 used for shrub and grassland. CS for shrub and grassland was the highest since relatively larger coverage in addition to 2nd highest service value. The results of all analyses indicated that the ESVs calculated for the sub-watershed was fairly inelastic in relation to changes ESV coefficients, which also suggests the estimation of the ES value is reliable since all the CS values are less than one.

LULC changes were influenced ecosystems services, the ecosystem service value of the sub-watershed was reduced over the analysis years due to the decline of important components of the sub-watershed especially forest, shrub and grassland, which is similar to the findings of Eshetu and Högberg (2000), Li et al. (2007) and Yirsaw et al. (2017). With regard to individual ecosystem functions, the raw material, nutrient cycling, and cultural services were reduced in the sub-watershed, which agreed with the results of Tolessa et al. (2017a), Hu et al. (2008) and Kindu et al. (2016). The robustness test carried out in sensitivity analysis confirmed that ESV calculated was reliable, agreed with the findings of Li et al. (2007), Hu et al. (2008) and Tolessa et al. (2017b). However, the global database may underestimate the current potential land use practices by smallholders (Costanza et al., 1997).
Even though there were significant improvements of ecosystem services in developed nations, there was a huge loss of certain ecosystem services in developing countries, for example, in Ethiopia, due to land use changes derived from natural to agricultural (Haines-Young et al., 2012). Monitoring and quantification of each watershed functions in rural areas could help to understand the benefits and minimize associated losses to the natural ecosystem (Nelson et al., 2009). To diminish the cost of ground data collection which is expensive, estimation of ESV using LULC change and established global database is an alternative way, moreover, getting real data about land use in rural areas is challenging.
CONCLUSION AND RECOMMENDATIONS
There is a substantial influence of LULC data on ecosystem services at the local and global level to indicate how many services lost through human cultivation in both space and time. The ecosystem services reduced due to deforestation and overgrazing might have an effect on the livelihoods of local communities and hence the need for improving land for sustainable production is vital. Regards the major LULC change observed in the last 45 years (1972-2017), cultivated land and settlement land expanded by 67.38 and 532% respectively whereas forest land, shrub land and grassland declined by 66.35 and 18.36% respectively over the analysis period.
ESV decreased by 26.6%, among the ecosystem functions identified biological control (0.05%) was the highest positive value as compared to other, while other remaining services had negative value indicated decreasing trend; nutrient cycling, provision of raw materials, climate regulation and erosion control were major contributors for the loss of ESV indicated that the study area needs proper soil fertility management together with soil conservation measures. The CS values selected land use types (cultivated, forest and shrub and grassland) were less than one implied the estimation is robust. CS for shrub and grassland use has the highest among all land uses. It was estimated about US$ 9.37 million loss of service in 45 years has revealed of ecological degradation. The agricultural development under current pattern should take into financial related losses occurred at ordinary settings whether lost or transformed; crop production systems should have appropriate land use plan incorporating to protect forest, shrub and grassland having bigger ESV.
Many tropical countries land use policies encourage the alteration of woods to crop production outcome of the loss of important ESs (Lira et al., 2012), moreover, the current investment policy put most natural forest/shrub areas converted to agro-processing industries affecting the natural setup of ecology and this also practiced in the sub-watershed. The need for appropriate intervention of rural land policies and active participation of smallholders for the long-term management of land assets (forest, shrub and grassland) is crucial to prevent the degradation of the ecological resources.
The authors have not declared any conflict of interests.
REFERENCES
|
Alemu B, Efrem G, Zewdu E, Habtemariam K (2015). Land Use and Land Cover changes and associated driving forces in North Western lowlands of Ethiopia. International research journal of agricultural science and soil science 5(1):28-44.
|
|
|
|
Amare B, Hurni H, Gete Z (2011). Responses of rural households to the impacts of population and land-use changes along the Eastern Escarpment of Wello, Ethiopia. Journal geography research 65:42-53.
|
|
|
|
|
Anderson JR, Hardy EE, Roach JT, Witmer RE (1976). A land use and land cover classification system for use with remote sensor data, Geological Survey Professional Paper 964:1-27.
Crossref
|
|
|
|
|
Asmamaw L, Mohamed A, Lulseged T (2011). Land use/cover dynamics and their effects in the Gerado catchment, northeastern Ethiopia. International Journal Environment Study 68:883-900.
Crossref
|
|
|
|
|
Bewket W (2002). Land cover dynamics since the 1950s in Chemoga Watershed, Blue Nile Basin, Ethiopia. Mountain research and development 22:263-269.
Crossref
|
|
|
|
|
Belay T (2002). Land-Cover/Land-Use Changes in the Derekolli Catchment of the South Welo Zone of Amhara Region, Ethiopia. Eastern Africa Social Science Research Review 18(1):1-20.
Crossref
|
|
|
|
|
Bryan BA (2013). Incentives, land use, and ecosystem services: synthesizing complex linkages. Environmental science and policy 27:124-134.
Crossref
|
|
|
|
|
Costanza R, de Groot R, Sutton P, Van der Ploeg S, Anderson SJ, Kubiszewski I, Farber S, Turner RK (2014). Changes in the global value of ecosystem services. Global environmental change 26:152-158.
Crossref
|
|
|
|
|
Costanza R, d'Arge R, De Groot R, Farber S, Grasso M, Hannon B, Limburg K, Naeem S, O'neill RV, Paruelo J, Raskin RG, Sutton P, Belt MV (1997). The value of the world's ecosystem services and natural capital. Nature 387:253-260.
Crossref
|
|
|
|
|
Daily G, Alexander S, Ehrlich P, Goulder L, Lubchenco J, Matson P, Mooney H (1997). Ecosystem services: benefits supplied to human societies by natural ecosystems. Ecology society of America 2:2-16.
|
|
|
|
|
De Groot R, Brander L, Van Der Ploeg S, Costanza R, Bernard F, Braat L, Christie M, Crossman N, Ghermandi A, Hein L (2012). Global estimates of the value of ecosystems and their services in monetary units. Ecosystem services 1(1): 50-61.
Crossref
|
|
|
|
|
De Groot RS, Wilson MA, Boumans RM (2002). A typology for the classification, description and valuation of ecosystem functions, goods and services. Ecological economics 41(3):393-408.
Crossref
|
|
|
|
|
Dejene T, Lemenih M, Bongers F (2013). Manage or convert Boswellia woodlands? Can frankincense production payoff? Journal of arid environments 89:77-83.
Crossref
|
|
|
|
|
Eshetu Z, Högberg P (2000). Reconstruction of forest site history in Ethiopian highlands based on 13C natural abundance of soils. Journal of the Human Environment 29(2):83-89.
Crossref
|
|
|
|
|
FAO (1998). The Soil and Terrain Database for northeastern Africa: Crop Production System Zones of the IGAD subregion (scale 1: 1 M). Land and Water Digital Media Series (2).
|
|
|
|
|
Fentahun T. Gashaw T (2014). Evaluation of land use/land cover changes in Bantnek watershed, Ethiopia. Civil and Environment research 6(2).
|
|
|
|
|
Gashaw T, Tulu T, Argaw M, Worqlul AW (2017). Evaluation and prediction of land use/land cover changes in the Andassa watershed, Blue Nile Basin, Ethiopia. Enviroment System Research 6:17.
Crossref
|
|
|
|
|
Gashaw T, Tulu T, Argaw M, Worqlul AW, Tolessa T, Kindu M (2018). Estimating the impacts of land use/land cover changes on Ecosystem Service Values: The case of the Andassa watershed in the Upper Blue Nile basin of Ethiopia, Ecosystem Services, Elsevier 31:219-228.
Crossref
|
|
|
|
|
García-Llorente M, Iniesta-Arandia I, Willaarts BA, Harrison PA, Berry P, del Mar Bayo M, Castro AJ, Montes C, Martín-López B (2015). Biophysical and sociocultural factors underlying spatial trade-offs of ecosystem services in semiarid watersheds. Ecology and Society 20(3):39.
Crossref
|
|
|
|
|
Haines-Young R, Potschin M, Kienast F (2012). Indicators of ecosystem service potential at European scales: mapping marginal changes and trade-offs. Ecological Indicators 21:39-53.
Crossref
|
|
|
|
|
Hu H, Liu W, Cao M (2008). Impact of land use and land cover changes on ecosystem services in Menglun, Xishuangbanna, Southwest China. Environmental monitoring and assessment 146:147-156.
Crossref
|
|
|
|
|
IPMS (2005). Alaba pilot learning woreda diagnosis and program design.
View
|
|
|
|
|
Jensen J (2007). Remote sensing of the environment: an earth resource perspective: Pearson Prentice Hall. Upper Saddle River, NJ.
|
|
|
|
|
Kibret KS, Carsten M, Georg C (2016). Assessment of land use and land cover change in South Central Ethiopia during four decades based on integrated analysis of multi-temporal images and geospatial vector data. Remote Sensing Applications Society and Environment 3:1-19.
Crossref
|
|
|
|
|
Kindu M, Schneider T, Teketay D, Knoke T (2016). Changes of ecosystem service values in response to land use/land cover dynamics in Munessa–Shashemene landscape of the Ethiopian highlands. Science of the Total Environment 547:137-147.
Crossref
|
|
|
|
|
Li Q, Zhang X, Liu Q, Liu Y, Ding Y, Zhang Q (2017). Impact of land use intensity on ecosystem services: An example from the agro-pastoral ecotone of central inner mongolia. Sustainability 9(1030):1-11.
Crossref
|
|
|
|
|
Lira PK, Tambosi LR, Ewers RM, Metzger JP (2012). Land-use and land-cover change in Atlantic forest landscapes. Forest Ecology and Management 278:80-89.
Crossref
|
|
|
|
|
Li R-Q, Dong M, Cui J-Y, Zhang L-L, Cui Q-G, He W-M (2007). Quantification of the impact of land-use changes on ecosystem services: a case study in Pingbian County, China. Environmental monitoring and assessment 128:503-510.
Crossref
|
|
|
|
|
Lobo G (2001). Ecosystem functions classification. Ecological Economics and Environmental Management Centre (ECOMAN).
|
|
|
|
|
Millennium Ecosystem Assessment (MEA) (2005). Ecosystems and Human Well-being: Synthesis. Millennium Ecosystem Assessment, Island Press, Washington, DC.
|
|
|
|
|
Meshesha TW, Tripathi SK, Khare D (2016). Analyses of land use and land cover change dynamics using GIS and remote sensing during 1984 and 2015 in the Beressa watershed northern central highland of Ethiopia. Model Earth System Environment 2(4):168.
Crossref
|
|
|
|
|
Meshesha DT, Tsunekawa A, Tsubo M, Ali SA, Haregeweyn N (2014). Land-use change and its socio-environmental impact in Eastern Ethiopia's highland. Regional environmental change 14(2):757-768.
Crossref
|
|
|
|
|
Nelson E, Mendoza G, Regetz J, Polasky S, Tallis H, Cameron D, Chan KM, Daily GC, Goldstein J, Kareiva PM (2009). Modeling multiple ecosystem services, biodiversity conservation, commodity production, and tradeoffs at landscape scales. Frontiers in Ecology and the Environment 7(1):4-11.
Crossref
|
|
|
|
|
Polasky S, Nelson E, Pennington D, Johnson KA (2011). The impact of land-use change on ecosystem services, biodiversity and returns to landowners: a case study in the state of Minnesota. Environmental and Resource Economics 48(2):219-242.
Crossref
|
|
|
|
|
Power AG (2010). Ecosystem services and agriculture: tradeoffs and synergies. Philosophical Transactions of the Royal Society of London, Biological Sciences 365:2959-2971.
Crossref
|
|
|
|
|
Reid RS, Kruska RL, Muthui N, Taye A, Wotton S, Wilson CJ, Mulatu W (2000). Land-use and land-cover dynamics in response to changes in climatic, biological and socio-political forces: the case of southwestern Ethiopia. Landscape Ecology 15(4):339-355.
Crossref
|
|
|
|
|
SNNPR (2007). SNNPR Rural Land Administration and Utilization Proclamation. 110/2007.
View
|
|
|
|
|
The Economics of Ecosystems and Biodiversity (TEEB) (2010). The Economics of Ecosystems and Biodiversity: Ecological and Economic Foundation. Earthscan, Cambridge, Washinton.
|
|
|
|
|
Temesgen H, Wu W, Shi X, Yirsaw E, Bekele B, Kindu M (2018). Variation in Ecosystem Service Values in an Agroforestry Dominated Landscape in Ethiopia: Implications for Land Use and Conservation Policy. Sustainability 10:1126.
Crossref
|
|
|
|
|
Tolessa T, Gessese H, Tolera M, Kidane M (2018). Changes in Ecosystem Service Values in Response to Changes in Landscape Composition in the Central Highlands of Ethiopia. Environmental Processes 5:483-501
Crossref
|
|
|
|
|
Tolessa T, Senbeta F, Abebe T (2017a). Land use/land cover analysis and ecosystem services valuation in the central highlands of Ethiopia. Forests, Trees and Livelihoods 26(2):111-123.
Crossref
|
|
|
|
|
Tolessa T, Senbeta F, Kidane M (2017b). The impact of land use/land cover change on ecosystem services in the central highlands of Ethiopia. Ecosystem services 23:47-54.
Crossref
|
|
|
|
|
Tsegaye D, Moe SR, Vedeld P, Aynekulu E (2010). Land-use/cover dynamics in Northern Afar rangelands, Ethiopia. Agriculture, ecosystems & environment 139:174-180.
Crossref
|
|
|
|
|
Yirsaw E, Wu W, Shi X, Temesgen H, Bekele B (2017). Land use/land cover change modeling and the prediction of subsequent changes in ecosystem service values in a coastal area of China, the Su-Xi-Chang Region. Sustainability 9(1204):1-17.
Crossref
|
|
|
|
|
Zeleke G, Hurni H (2001). Implications of land use and land cover dynamics for mountain resource degradation in the northwestern Ethiopian highlands. Mountain research and development 21(2):184-191.
Crossref
|
|
|
|
|
Zerga B (2016). Land Resource, Uses, and Ownership in Ethiopia: Past, Present and Future. International Journal of Scientific Research and Engineering 2:17-24.
|
|