Full Length Research Paper

ABSTRACT
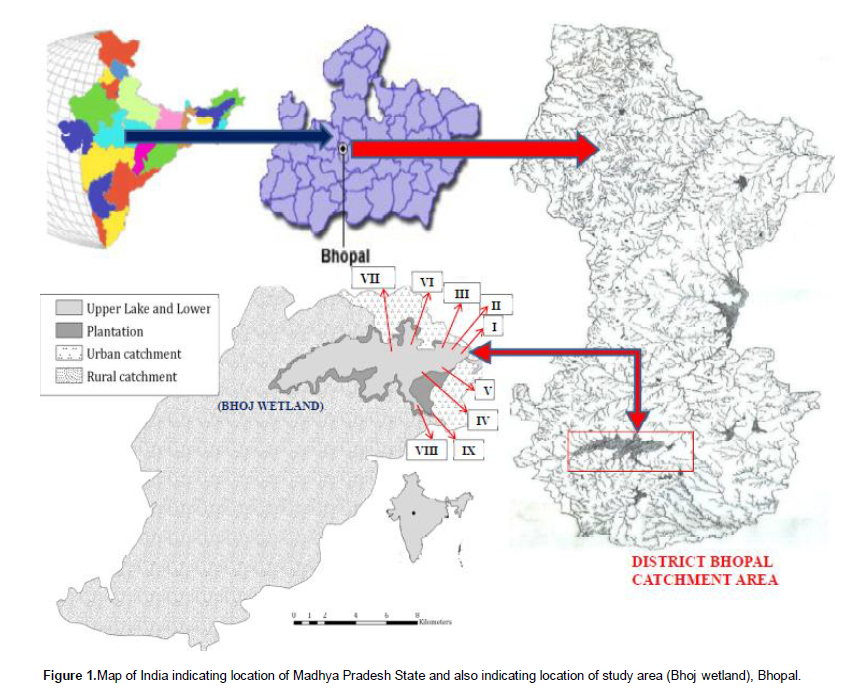
Bhopal, the capital city of the state of Madhya Pradesh, India is famous for its numerous lakes. The Bhoj Wetland is a wetland of international importance (Ramsar Site). In the two years of study period, a total of 82 zooplankton species were recorded from February 2008-January 2010. Out of which 66 species were recorded in the 1st year (2008-2009), and 70 species documented during the 2nd year (2009-2010). The zooplankton population belongs to five major groups namely: Rotifera (46%), followed by Cladocera (34%), Protozoa (10%) and Copepoda and Ostracoda contributing 6 and 4%, respectively. With regards to Rotifera, in the major peak of June 2009 (38 species), was dominated by the various species of Brachionus and Keratella. The population density data revealed that cumulative site mean density ranged from 84 to 1579 Ind. l-1, with an overall mean of 399 Ind. l-1. The 24 months of mean site density indicated a major peak of 1579 Ind. l-1, in June 2009, with 47 and 43% contribution from Copepoda and Rotifera. However, among Copepoda, Cyclops and Nauplius larvae were major contributors to this peak and among Rotifera, Brachionus caudatus and Keratella tropica were dominant contributors. The comparative cumulative mean data on zooplankton in Bhoj Wetland indicate that during the 1st year, the diversity was 31 species and 30 species in the 2nd year. The mean density, during the 1styear was 276 Ind.l-1 that increased to 468 Ind.l-1 in the 2nd year. This variation in density during two years may be attributed low water volume caused by drought conditions in the second year. Bhoj wetland is under eutrophic state as a result of human stress in the catchment area. Further, increase of plant nutrients in the wetland waters is deteriorating its ecological condition.Hence, it is imperative to focus on preservation of these endangered habitats to achieve ecological sustainability.
Key words: Zooplankton, diversity, density, indicator species, BhojWetland.
INTRODUCTION
Water is one of the basic needs of mankind and is vital to all forms of life, it exist in lentic and lotic habitats. Tropical wetlands have played an important role for humankind (Junk, 2002; Bhat et al., 2014). These are characterized by a large number of ecological niches and harbour a significant percentage of world’s biological diversity. Wetlands are among the most productive ecosystems in the world (Thomas and Deviprasad, 2007). Wetlands are highly productive systems which support diverse plant and animal communities. They are shallow and can warm up quickly, and aquatic vegetation can thrive, because light frequently penetrates to the bottom of the water column. The aquatic vegetation creates ideal habitat for invertebrates, fish and waterfowl. Wetlands are highly variable systems, differing in water flow, depth, extent and type of vegetation and available nutrients (Lougheed and Chow-Fraser, 1998). Zooplankters are the microscopic, free-swimming animalcule components of an aquatic ecosystem, which are primary consumers on phytoplankton. Zooplankton community is cosmopolitan in nature and they inhabit all freshwater habitats of the world. Zooplankton diversity and density refers to variety within the community (Jalilzadeh et al., 2008). Verma and Munshi (1987) have suggested that zooplankton provide the main food item of fishes and can be used as indicators of the trophic status of a water body.
Rotifers, cladocerans, copepods, protozoa and ostracods constitute the major groups of zooplankton. Zooplankton plays an important role in energy transfer and occupies a central position in the trophic link between primary producers and higher trophic levels (Tunde, 2009). The influence of environmental factors, chemical conditions of hydrogeology of aquatic ecosystem cause changes in the composition of zooplankton and influence their densities, and so, they are also termed as bioindicators of the physical and chemical conditions of aquatic environments. The members of zooplankton are important for their role in the aquatic food chain (Cadjoet al., 2007). The factors on the basis of bioindicators are evaluated through the qualitative and quantitative condition, relative success, community structure (composition) trophic structure or environmental heterogeneity and species interactions (Holyoaket al., 2005). According to Ferrar (1972), the primary productivity fluctuates with changes in environmental factors and grazing by zooplankton. Trivediet al. (2003) disclosed that places of low zooplankton population usually have rapidly multiplied phytoplankton population. Zooplankton distribution is non homogenous. Some are mainly found in the littoral waters while others are in selected limnetic waters. Hakanson et al., (2003) attributed this to food availability and avoidance of predators. The review of limnological literature indicates limited information available on the ecology, diversity and role in aquatic productivity of inland aquatic environs of India (Sharma and Sharma, 2008). The dominant species and their seasonality are highly variable in different ecosystem according to their nutrient status, age, morphometry and other location factors (Rajashekhar et al., 2009).
The objectives of this study are i) to study the fluctuations of zooplankton abundance of the Bhoj Wetland, ii) to understand the impact of pollution on zooplankton community in the Bhoj Wetland. In this investigation, the data of zooplankton density and diversity in a tropical wetland system (Bhoj Wetland) was studied for two years.
MATERIALS AND METHODS
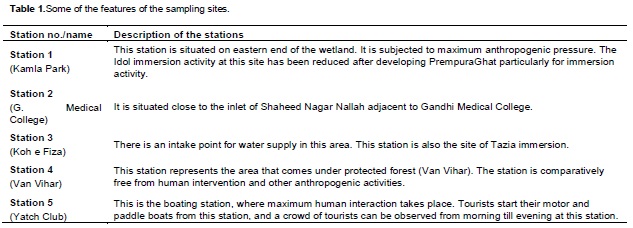
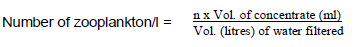
Water samples were collected on monthly basis for a period of two year. For the present study, nine sampling points in the Bhoj Wetland were selected and each point, taking into account the human activities such as washing, bathing, fishing and boating, etc. the outlets, inlets, morphometric features and growth of aquatic vegetation etc., and other important factors considered during the selection of the sampling sites (Table 1). The water samples were collected in one liter polyethylene canes of the surface waters by the boat between 8 am to 12 pm from the selected sites during first week of every month of the Bhoj Wetland. For the quantitative analysis of zooplankton, water was collected from the surface with minimal disturbance and filtered through a No. 25 bolting silk cloth, net of mesh size 63 µm. Ten liters of water were filtered and concentrated to 100 ml and were preserved by adding 2ml of 4% formalin simultaneously. The quantitative analysis of zooplankton was done by using Sedgwick-Rafter cell with dimensions of 50mm x 20mm x 1mm, following the method given in APHA (2000). 1 ml of concentrated sample was taken in a Sedgwick-Rafter counting cell and the entire contents were counted. The identification of aquatic biota (zooplankton) was done following the standard works and methods of Edmondson (1959), Needham and Needham (1962), Pennak (1978), Victor and Fernando (1979), Michael and Sharma (1988), Battish (1992) and Sharma (1999).The results are expressed as individuals/l (Wanganeo and Wanganeo, 2006).

C = Number of organisms recorded; A= area of field of microscope; D= depth of field (SRC depth) in mm;E = number of fields counted.
Shannon diversity index
This index is an index applied to biological systems derived from a mathematical formula used in communication area by Shannon-Weaver, 1947.
H’ = -Σ [(ni / N) x (lnni / N)]
H’: Shannon Diversity Index; ni: number of individuals belonging to i species; N: total number of individuals.
Simpson diversity index
Itisa diversity indices derived by Simpson in 1949 (Mandaville, 2002). Simpson index values (Δ) are between 0-1. But while calculating, final result is subtracted from 1 to correct the inverse proportion.
1 - Δ = [ Σ ni (ni -1) ] / N (N-1)
Δ : Simpson diversity index; ni: number of individuals belonging to i species; N: total number of individuals.
Margalef diversity index
It has no limit value and it shows a variation depending upon the number of species. Thus, it is used for comparison of the sites (Kocata?, 1992).
d = (S-1) / ln N
d: Margalefdiversity index; S: total number of species; N: total number of individuals.
Pielouevenness index
It was derived from Shannon index by Pielou in 1966. The ratio of the observed value of Shannon index to the maximum value gives the Pielou Evenness index result. The values are between 0–1. When the value is getting closer to 1, it means that the individuals are distributed equally (Pielou, 1966).
J’ = H’ / H’max
J’:Pielou evenness index; H’: the observed value of Shannon index; H’max:lnS; S: total number of species.
RESULTS AND DISCUSSION
Zooplankton dynamics
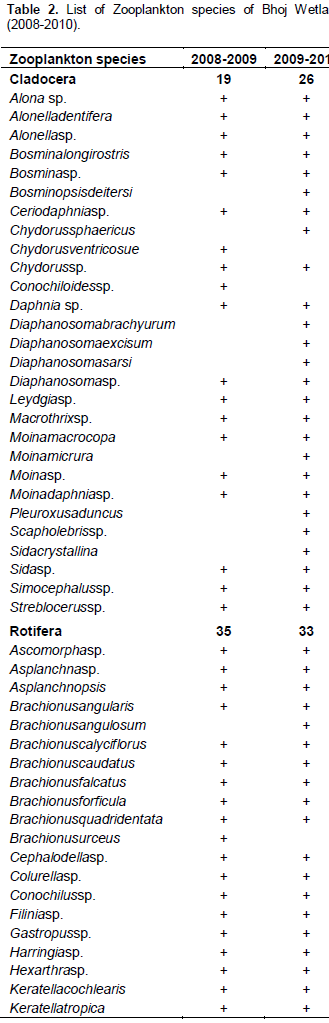
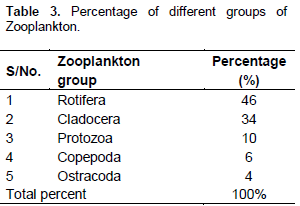
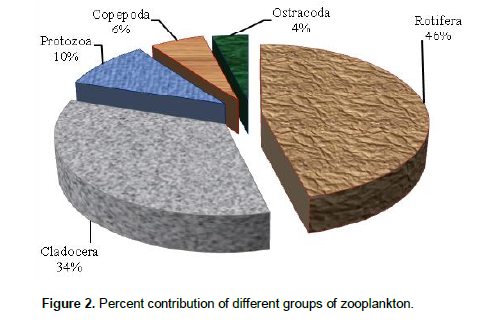
In the two years of study, a total of 82 zooplankton species were recorded from February 2008-January 2010. Out of which 66 species were recorded in the 1styear (2008-09), and 70 species documented during the 2ndyear (2009-2010) (Table 2). The above zooplankton population (82 species) belongs to five major groupsviz:Rotifera (46%), followed by Cladocera (34%), Protozoa (10%), and Copepoda and Ostracoda contributing 6 and 4%, respecttively (Table 3 and Figure 2).
Annual mean trends
Diversity: Studies on Zooplankton dynamics carried out for 24 months (from February 2008 to January 2010), revealed a total of 82 species in Upper basin of Bhoj Wetland. The present study indicated significantly higher zooplankton diversity as compared to earlier reports, Verma et al. (2009) recorded 36 species, Pani et al. (2000) reported 29 species. However, Agarker et al. (1994) reported higher diversity of 78 species from the same waterbody. Thecurrent study varying exhaustive, was able to record much higher zooplankton diversity during the period of 2008-2010. The cumulative site mean diversity ranged from 16 to 38 species with a mean value of 28. A major peak of 38 species was recorded in the June 2009 with two minor peaks of 36 species (January 2009) and 35 species (October 2009). Rotiferacontributed to this diversity to the tune of 47, 58 and 51% in three peaks recorded in June, January and October, respectively. The data further indicated that among Rotifera, the major peak of June 2009 (38 species) was dominated by the various species of Brachionusand Keratella, these species also dominated minor peaks recorded during January and October 2009 (Figure 3).
.png)
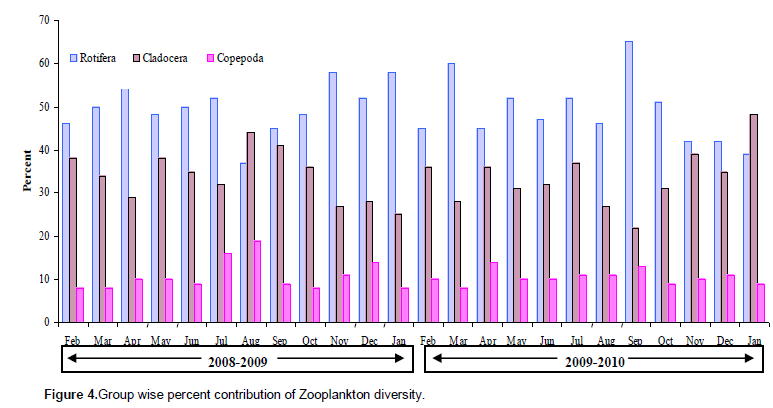
The monthly variability of Zooplankton groups in terms of species number showed significant changes. The Rotifera recorded ≥60 species in March 2009 and September 2009 and in remaining months, it was mostly within 40-60 species, while minimum of < 40 species was recorded in August 2008 and January 2010. The Cladocera, encountered >40 species on three occasions viz, August, September 2008 and January 2010, while in remaining months the species number ranged between 30-40, and <30 was noted in April, November, December and January 2008 and March, August and September 2009. The Copepoda was significantly different and the overall species were restricted to <20 in the study period (Figure 4).
Zooplankton group Dynamics: On the basis of mean percentage contribution of different zooplankton groups, during the present study, among the total of 82 species, Rotifera formed the highest number of species (46%) followed by Cladocera (34%), Protozoa (10%), Copepoda (6%) and Ostracoda (4%) (Figure 2).
In general, Rotifera registered highest number of species in terms of percentage during the period of study except in the month of August 2008 and January 2010. Cladocerans recorded second highest and followed by copepods. The maximum diversity and population density of rotifers recorded in the present study was mainly due to organic load and eutrophic condition. High rotifer population in the lake waters indicates enrichment due to direct inflow of untreated domestic sewage from adjacent area into the lake (Arora, 1966). Chandrashekhar (1998) recorded diversity of rotifers to be influenced by the different water quality and other chemical factors.
The most abundant zooplankton group during the study was rotifera, the group, across all stations was dominated by different species of Brachionus and Keratella, and these are found extensively in eutrophic waters as reported (Arora, 1966; Berzins and Pejler, 1989). The diversity patterns greatly depend on the water temperature and availability of food in the waterbody. Phytoplankton populations constituting the essential component of the rotifera dietary spectrum, increase with higher water temperature in summer that impacts species diversity in the wetland. Maximum Rotifera members in the wetland may be due to optimal nutrient and temperature conditions and favourable DO content, as reported by Subla et al. (1992) and Padmanabha and Belagali (2006) in their investigations.
The Brachionus has cosmopolitan distribution in India and during the present study, it was represented by (8) species namely: Brachionu sangularis, Brachionus angulosum, Brachionus calyciflorus, Brachionus caudatus, Brachionus falcatus, Brachionus forficula, Brachionus quadridentata and Brachionus urceus. Pejler (1977) and Fernando (1980) have also stressed that Brachionus was an important genera among tropical zooplankton community. Among the 8 species, B. caudatus was the most dominant, which is supported by the observations of Patil (1978),Isairasu and Mohandoss (1998) and Malathi (1999). Hutchinson (1967) observed that Brachionus species are very common in temperate and tropical waters, having alkaline pH. The dominance of Brachionushas been related to eutrophic nature and the presence of high organic matter in the water (Dadhich and Saxena, 1999; Sampaio et al., 2002). In other investigations Mageed (2008) and Uzma (2009) stated that presence of more than (5) species of Brachionusreflects eutrophication of water bodies. The Bhoj Wetland being a tropical water body is highly eutrophicand receives sewage and other agricultural effluents from the catchment records dominance of Brachionus.
Density: The population density data revealed that cumulative site mean density ranged from 84 to 1579 Ind. l-1, with an overall mean of 399 Ind. l-1. The 24 months of mean site density indicated a major peak of 1579 Ind. l-1, in June 2009, with 47 and 43% contribution from Copepoda and Rotifera (Figure 5). However, among Copepoda, Cyclops and Nauplius larvae were major contributors to this peak and among Rotifera, B. caudatus and Keratella tropica were dominant contributors. The two minor peaks of 828 and 744 Ind. l-1 were recorded in February 2009 and January 2010, respectively. Among Copepoda, Cyclops contributed significantly to the February 2009 and January 2010 peaks, to the tune of 61 and 81%.
.png)
It is reported that Copepoda are best adapted to eutrophic lakes (Gannon and Stremberger, 1978). In the present study, the high density of rotifers (43%) and of Copepoda (47%) provides a positive evidence of the progression of eutrophication. The significant density of copepod nauplii larvae in Bhoj Wetland was recorded during the warm period, indicating the role of high temperature in promoting the egg production and development. This is in agreement with Makino and Ban (2000) who reported that higher water temperature causes more rapid development and higher egg production while increased food density results in larger body size and higher egg production. Singh et al. (2002) reported that higher rotifer population occurs during summer and winter which might be due to higher trophic level of the lake, high summer temperature and low level of water in winter. In our investigation, Keratella and Brachionus are common rotifers with a wide range of tolerance to different physicochemical conditions. Cyclops is regarded as a strictly pollution sensitive copepod (Bhatti and Rana, 1987). However, in our study, they were common genera at all stations. The occurrence of nauplii throughout the study period in wetland indicated extended reproductive phase of the cyclopoid,which is in agreement with the reports of Sharma(2011) and Sharma and Sharma (2011). The Bhoj is typically tropical wetland, with rotifers recording highest density and dominated mainly by Brachionus and Keratella. The members of rotifera are reported as good indicators of eutrophication and pollution (Saksena, 1987) and eutrophic lakes have been noted to harbor high density of Brachionusand Keratella(Arora, 1966).
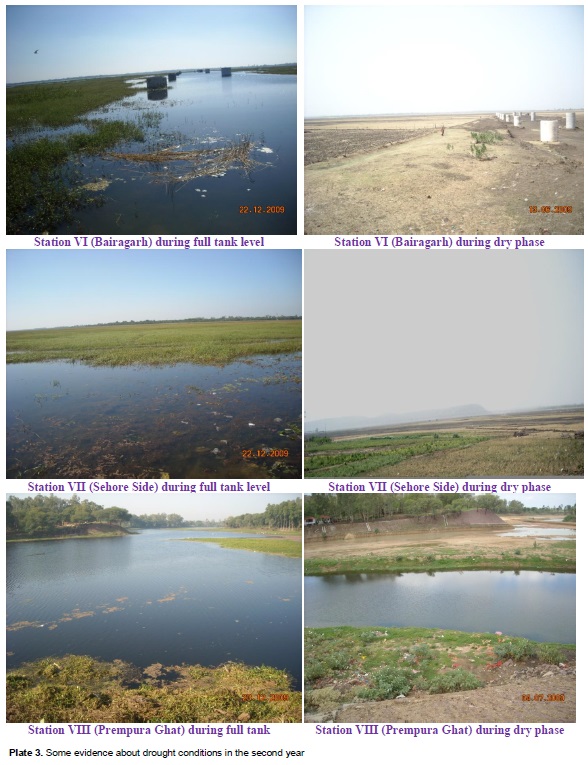
The comparative cumulative mean data on zooplankton in Bhoj Wetland indicate that during the 1styear, the diversity was 31 species and 30 species in the 2ndyear. The mean density during the 1styear was 276 Ind.l-1 that increased to 468 Ind.l-1 in the 2nd year. This variation in density during two years may be attributed to low water volume caused by drought conditions in the second year (Plate 1, 2, 3, 4). The maximum population density recorded in the 2ndyear also reflected a positive relationship with temperature, nitrate and phosphate concentrations. Similar observations were recorded by Paliwal (2005). The maximum population density of zooplankton in the 2nd year may also be attributed to greater availability of food namely: phytoplankton and suspended detritus. The factors like temperature, D.O play an important role in controlling the diversity and density of zooplankton (Edmondson, 1965; Baker, 1979). According to Kurbatova (2005) and Tanner et al.(2005), the pH more than 8 means highly productive nature of a water body, in the present study, the average pH recorded was 8.3, indicating water highly productive for zooplankton population.
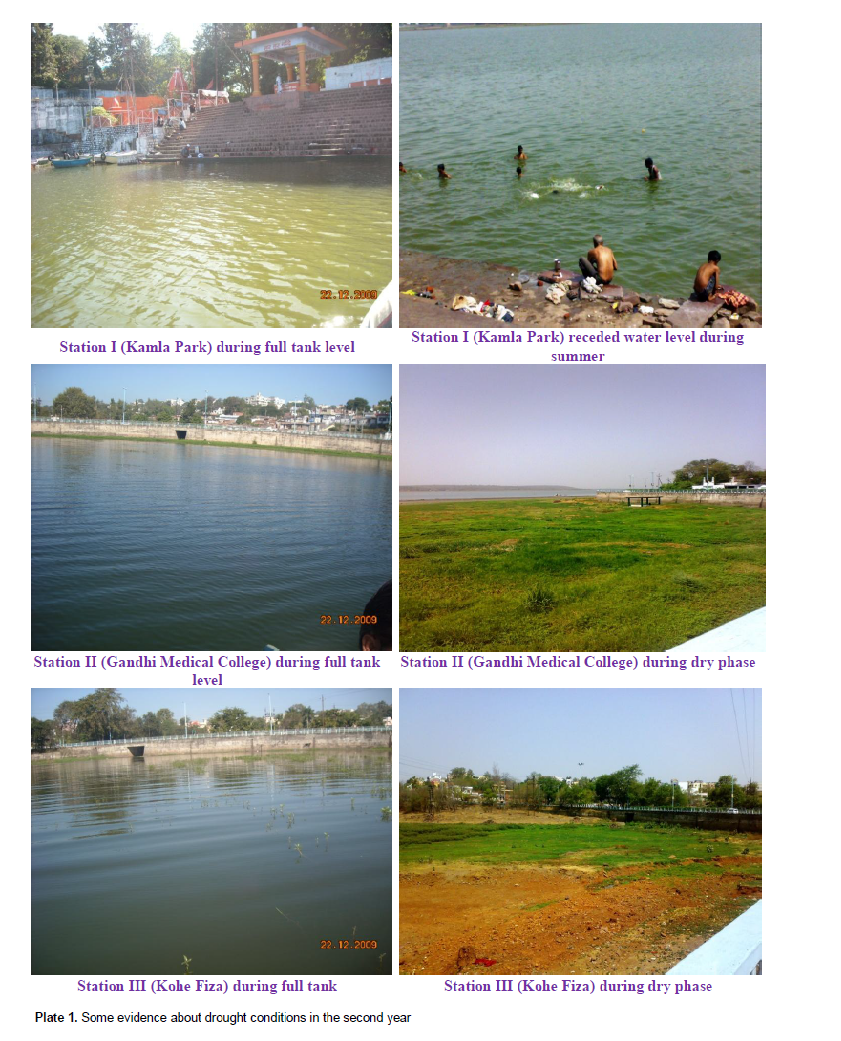
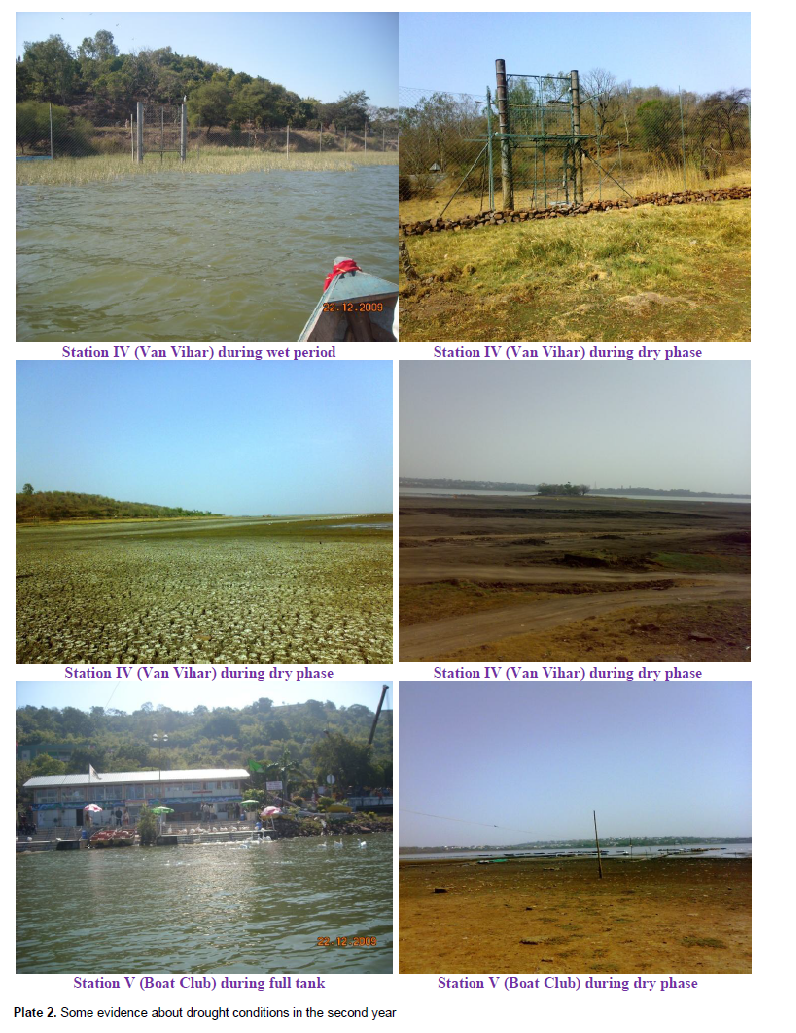
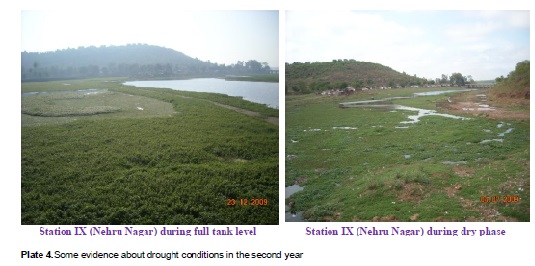
Comparison between diversity and density: Comparing diversity and density of zooplankton in the present study,the two seem to be positively related, the data revealed highest diversity of 38 species and density of 1579 Ind. l-1 in June 2009, In August 2008, a minimum diversity of 16 species correspondedwith a low density of 84 Ind.l-1. Drawing a comparison between two years on the cumulative mean trends, the data revealed that in the 1styear, the mean diversity was 27 and 28 in the second year; similarly the mean density in the 1styear was 281 Ind. l-1, which increased to 518 units l-1 in the second year (Figure 3). The diversity/density pattern was similar in both years, but their relative abundances varied. The variability in density during two years may be attributed to hydrological change in the second year, mainly caused by acute drought conditions (Plate 1, 2, 3, 4). In summer season, low flow of water brings stability to the ecosystem and more availability of food due to production and decomposition of organic matter. The high diversity and density of zooplankton recorded in June 2009 may be related to high phytoplankton density during this period. It is documented that nutrient availability influence the abundance of rotifer and Copepoda (Kumar et al.,2004). Overall, the diversity and density of zooplankton depends upon the nutrient status of water body and enabling water quality. Sarkar and Chowdhury (1999) reported that variability in temperature, total alkalinity, phosphate, nitrate and pH does influence the growth of zooplankton. Low zooplankton diversity and density during the rainy season has been attributed by Okogwu et al. (2010) to turbulence generated by the excess water flows.
Site variability
Diversity: In the first year (2008-2009), the species number from different stations, ranged from 20 to 40, a maximum of (40 species) encountered at station VIII (Prempura Ghat), and minimum of 20 species at station VII (Sehore Side). In the second year (2009-2010),a mini-mum of 16 species were recorded at station VII and maximum of 52 species at station VIII (Figure 6).The peak diversity recorded at station VIII in both years, was due to dominance of rotifers and cladocerans species. The higher nutrient status at station VIII resulting from decomposition of macrophytes enabling higher diversity as well as density of zooplankton. Maximum zooplankton peak obtained at station VIII (Prempura Ghat) in the wetland may be due to high nutrients like (nitrate =0.62mg/l and phosphate =0.27mg/l) and favourable temperature and DO conditions, similar trend has been reported by Padmanabha and Belagali (2006). The progressive decrease in the zooplankton diversity at station VII during the 1styear may be attributed to drought from January 2009 to June 2009 (Plate 3).
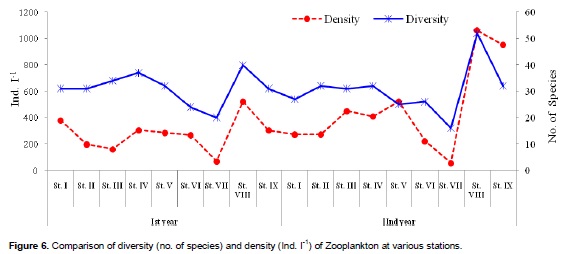
Density: The zooplankton density at nine stations recorded a minimum of 67 Ind.1-1 and a maximum of 520 Ind.1-1 with overall mean density of 276 Ind.1-1 in the 1st year, whilein the 2ndyear, a minimum of 56 Ind.1-1 and a maximum of 1059 Ind.1-1 was recorded with mean density of 468 Ind.1-1. The mean cumulative monthly density of different stations indicated major peaks of 520 and 1059 Ind. l-1 at station VIII in the 1stand 2nd year, respectively. Maximum contribution of 46 and 47% by Copepoda in the above peaks in both years was recorded. Among Copepoda, two major contributors were Cyclops (65 and 73%) and its Nauplius larvae (29 and 25%) in the 1stand 2ndyear, respectively (Figure 6). Joshi (1987) reported dominant population of Copepoda (Cyclops) throughout the year from Sagar Lake. Gupta (1989) reported Copepoda population throughout the year in Gulabsagar and Ganglooan water bodies of Jodhpur, this was attributed to enriched nature of waters. Syuhei-Ben (1994) stated that individual growth rate of Copepoda may also depend on temperature conditions. Gannon and Stemberger (1978) found that cladocerans and cyclopoid copepods are more abundant in nutrient enriched waters of the Great Lakes.
Two year comparison: Two years diversity/density data showeda positive relation, the station VIII recorded the maximum diversity/density (40 and 52 species and 520 and 1059 Ind. l-1) in the 1stand 2ndyear (Figure 6). The Cyclops and its nauplius larvae, dominated the zooplankton density peak. In diversity peaks, Brachionus (7 and 6 species) recorded maximum during the 1stand 2ndyear and Diaphanosoma (3 species) only in the 2ndyear. Among rotifers, the numerical superiority was found to be high in the case of Brachionus (7 species), which is considered typical and most frequent in tropical environment (Nogueira, 2001; Mulani et al., 2009). In the present investigation, Brachionus species was frequently observed at all stations. This species is considered the indicator of eutrophication (Sampaio et al., 2002). Nogueira (2001) reported that Brachionus species as indicator of sewage and industrial pollution. Jana and Pal (1984) reported the abundance of Diaphanosoma excisum in water bodies having high organic content. Therefore, presence of Diaphanosoma at all the stations in the present study can also be considered as an indication of increased organic content in the water,from sewage and other agricultural effluents.
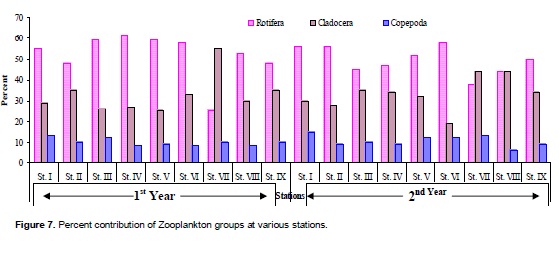
Among the different groups, Rotifera varied from 25 to 62% with lowest at station VII (Sehore side) and highest at station IV (Van Vihar) in the first and second year, it varied from 38 to 58% with minimum at station VII (Sehore side), and maximum at station VI (Bairagarh) respectively, (Figure 7). Across the overall station trend in zooplankton diversity was Rotifera > Cladocera > Copepoda. The highest rotifera species diversity was observed at stations IV and VI, characterized by dense well developed macrophyte stands, which provides shelter, varied niches and comparatively good quality water as evinced by the physicochemical properties of water (Robinson, 2004). The sufficient nutrient availability and other favourable conditions result in dominance of rotifers while lower diversity at station VII may be due to the acute drought conditions (Plate 3) and significant use of pesticides in the agricultural activities. Kasai and Hanazato (1995) reported that application of herbicides induced the decline in zooplankton density; similar trend with regard to fungicide has been recorded by Willis et al.(2004). High species diversity of rotifera has been recorded with the peaks of phytoplankton,this suggest that the increase in zooplankton production may be attributed to greater availability of food in the form of phytoplankton coupled with enabling temperature (Wadajo, 1982; Wadajo and Belay, 1984; Webber and Roff, 1995; Christou, 1998; Uyeet al., 2000). The Cladocera ranged from 25 to 55%, with a minimum at station V and maximum at station VII in the first year, while in second year, it ranged from 19 to 44% with minimum at station VI and maximum at station VII and VIII, respectively. The lower abundance and diversity of cladocerans found in the station VII may be explained as the grazing impact of planktivorous fishes (Wetzel, 1983; Arcifa et al., 1986; Basima et al., 2006; Jeppesen et al., 1998). However, Wetzel (2001) reported higher densities of cladocerans in littoral areas along with macrophytes.
Cladocerans feed on algae, small rotifers and copepod nauplii (Dodson et al., 2010). Rotifers and cladocerans strongly compete for the similar food resources (Kirk and Gilbert, 1990). The large cladocerans limit the abundance ofrotifera and thus, are usually the more competitively dominant taxa (Kirk and Gilbert, 1990). When different taxa compete for the same limited food resources, some populations may experience a decline due to the competition for food, feeding capabilities and reproduction capacity (Kirk and Gilbert, 1990). This situation may lead to a dormant or resting stage for the zooplankton rather than its complete decline (Wetzel, 1983).
Zooplankton diversity indices
In the present investigation, Shannon-Wiener diversity index ranged between the values of 2.215 to 2.682 in the 1styear (2008-09). The highest diversity index was found to be 2.682 at station VIII and a lowest 2.215 at station VII (Table 4). While in the second year, the values of Shannon-Wiener diversity index ranged from 1.703 to 2.614. The highest value was 2.614 at station II and a lowest 1.703 at station IX, respectively (Table 4). In general, the index reveals that upper basin of Bhoj Wetland is more diverse. Wilhm and Dorris (1968) found that the value of index decline sharply in polluted zones of the lake.
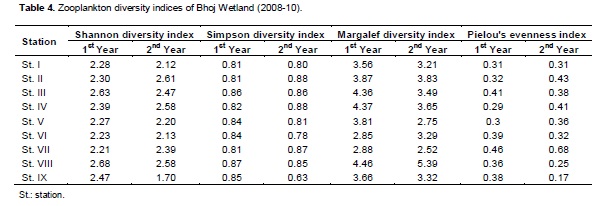
Simpson diversity index varied between the values of 0.812 to 0.872. The minimum value of 0.812 was recorded at station II and a maximum of 0.872 at station VIII. While in the 2ndyear of study, the diversity varied between 0.633 to 0.882 values. The minimum value was found to be 0.633 at station IX and a maximum of 0.882 at station IV, respectively (Table 4). Simpson’s index of diversity showed that the index of diversity was significantly higher. The Simpson index (low value) indicates an increase in dominance of fewer species in Baigul water bodies (Mishra et al., 2010). The index value ranges from 0 and 1, the higher the index value, the higher the diversity.
The evenness components of diversity values were found to range 0.296 to 0.458. The lowest value of 0.296 was found at station IV and the highest value of 0.458 was found at station VII, respectively (Table 4). While in the second year of investigation, the value varied between 0.171 and 0.682. The highest at station VII and a lowest at station IX was recorded.
The Margalef diversity index varied from 2.85 to 4.46 in the first year of study. The highest Margalef index was recorded at station VIII (4.46) and a minimum at station VI (2.85) while in the second year of study, the Margalef diversity index varied from 2.52 to 5.39. The minimum value (2.52) was recorded at station VII and the maximum (5.39) at station VIII (Table 4). Mukherjee (1997) reported that the higher species richness is characterized by larger food chain (Dumont, 1994).
Overall, Zooplankton species richness in the present study is quite high. The present study supports the idea that overall species richness is positively affected by the number of diverse habitats in the Bhoj Wetland. All the diversity indices (Shannon-weaver, Simpson diversity and Margalef diversity index) showed high diversity at station VIII (first year) and during the second year, Shannon diversity index was high at station II. Simpson diversity index was also high at same station and also at station IV. However, on the basis of Margalef diversity index, it was station VIII which recorded highest diversity. Applying evenness index of Pielou, the present values depict that the species are not evenly distributed.
Cluster analysis
Cluster analysis of Zooplankton
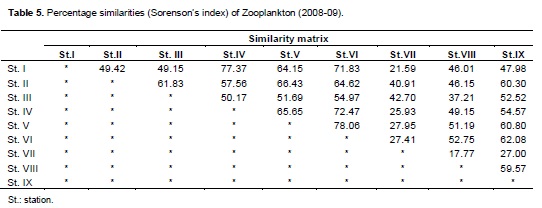
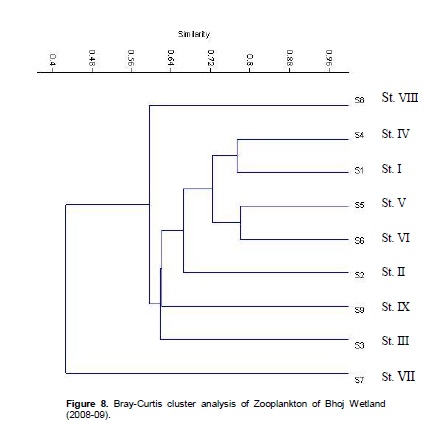
The Bray-Curtis Cluster analysis are shown in Table 5 and Figure 8. In the present study,for the similarity matrix, the highest value is 78.06 for station numbers V and VI and thus linked together at level 1. The second highest similarity value of 77.37% is between the stations I and IV, hence station I is linked to IV. Extreme differences in the zooplankton structure were detected between the sampling station VII and VIII. The zooplankton communities indicate similarities (Sorenson’s Index) ranging from 17.77 to 78.06% during first year of the study period. Wetland exhibited higher zooplankton similarity, that is, >50% similarity in maximum instances (58.3%). This wetland, however, showed a relatively wide community similarity range (50-78.06%) during 2008 - 2009.
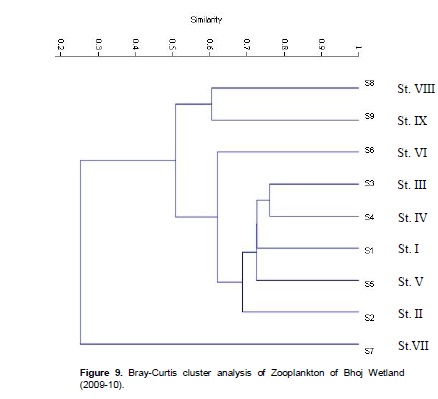
Bray-Curtis cluster analysis shows notable differences in annual cluster groupings in the sampled stations. In the second year of study, the Bray-Curtis cluster analysis indicated closer affinity in zooplankton between station III and IV and diverse composition of station VII and station VIII and IX communities during 2009 - 2010. During the second year, there was higher zooplankton similarity (4.75 - 68.42%). Majority of instances (25%) in the matrix how-ever indicate similarities between 50-68.42% during 2009-2010 (Table 6 and Figure 9).
Wetlands are dynamic ecosystems, continually undergoing natural changes due to infilling with sediments and nutrients. They sustain all life and perform some useful functions in the maintenance of overall balance of nature (ecosystem). Rapid urbanisation, burgeoning human population and their various activities have contributed to the decline of quality and number of wetlands, also socio-economic value of the wetlands has decreased. Hence, it is imperative to focus on preservation of these endangered habitats to achieve ecological sustainability.Zooplankton community was represented by five groups namely: Cladocera, Rotifera, Copepoda, Ostracoda and Protozoa. The copepods and rotifera population were found maximum throughout the study period, whereas rotifer had maximum in number of diversity during both years of the study. Thus, the wetland plays a very important role in maintaining the biodiversity. The presence of species indicative of eutrophic status condition in Bhoj wetland suggests that the ambient water has achieved a high trophic status on account of nutrient enrichment from its catchment area wherein varying types of anthropogenic activities were recorded as related to different socio-economic status of persons residing in its catchment area. It is concluded that the Bhoj wetland is under eutrophic state as a result of human stress in the catchment area. Further, increase of plant nutrients in the wetland waters is deteriorating its ecological condition.
CONFLICT OF INTERESTS
The author(s) have not declared any conflict of interests.
ACKNOWLEDGEMENTS
The author deem their heartfelt gratitude to Prof. Ashwani Wanganeo, Head, Department of Environmental Sciences and Limnology, Barkatullah University, Bhopal for providing necessary facilities and valuable time during the manuscript preparation. We are very thankful to reviewers whose suggestions and comments improve this manuscript.
REFERENCES
| Agarker MS, Goswami HK, Kaushik S, Mishra SM, Bajpai AK, Sharma US (1994). Biology, conservation and management of Bhoj wetland, Upper lake ecosystem in Bhopal.Bionat. 14:250-273. | ||||
| American Public Health Association (APHA) (2000). Standard methods for the examination of water and wastewater. APHA.21thed. Washington, DC. | ||||
|
Arcifa MS, Northcote TG, Froehlich O (1986). Fish-Zooplankton interactions and their effects on water quality of a tropical Brazilian reservoir. Hydrobiology 139:49-58. Crossref |
||||
|
Arora HC (1966). Rotifera as indicators of trophic nature of environments.Hydrobiology 27(1-2): 146-149. Crossref |
||||
|
Baker SL (1979). Specific status of Keratella cochlearis (Gosse) and Keratella alastrar (Rotifera: Brachionidae): Ecological considerations. Can. J. Zool. 7(9):1719-1722. Crossref |
||||
|
Basima LB, Senzanje A, Marshal B,Shick K (2006). Impact of land and water use on the plankton diversity and water quality in small man-made reservoirs in the Limpopo basin Zimbabwe: A preliminary investigation. Phys. Chem. Earth 31:821-831. Crossref |
||||
| Battish SK (1992).Freshwater zooplankton of India.Oxford and IBH Publishing Co. p. 233. | ||||
|
Berzins B, Pejler B (1989). Rotifer occurrence in relation to temperature.Hydrobiology 175:223-231. Crossref |
||||
| Bhat NA, Wanganeo A, Raina R (2014). The composition and diversity of net zooplankton species in a tropical water body (Bhoj wetland) of Bhopal,India.Int.J. Biodivers. Conserv.6(5): 373-381. | ||||
| Bhatti DS, Rana KS (1987).Zooplankton in relation to abiotic components in the Fort Moat of Bharatpur.Proc. Nat. Acad. Sci. Ind.57(B): 111. | ||||
|
Cadjo S, Miletic A,Djurkovic A (2007).Zooplankton of the Potpec reservoir and the saprobiological analysis of water quality.J. Desalination213:24-28. Crossref |
||||
| Chandrashekhar SVA (1998). Ecological studies on saroornagar communities. Ph D. Thesis (Unpublished), Osmania University, Hyderabad. | ||||
|
Christou ED (1998). Interannual variability of copepods in a Mediterranean coastal area (Saronikkos Gulf Aegean Sea). J. Mar. Syst. 15:523-532. Crossref |
||||
| Dadhich N, Saxena MM (1999).Zooplankton as indicators of trophical status of some desert aters near Bikaner. J. Environ. Pollut. 6:251-254. | ||||
|
Dodson SL, Caceres CE, Rogers DC (2010).Cladocera and Other Branchiopoda. In: Thorp, J and Covich, A, editors. Ecology and Classification of North American Freshwater Invertebrates.Elsevier. New York. pp. 773-827. Crossref |
||||
|
Dumont HJ (1994). On the diversity of cladoceran in the tropics.Hydrobiology 272:27-38. Crossref |
||||
| Edmondson NT (1965). Reproductive rates of planktonic rotifers related to food temperature in nature. Ecology 5:61-68. | ||||
| Edmondson WT (1959). Fresh water biology.2nd edition.John Willey and Sons. New York. pp. 127-169. | ||||
| Fernando CH (1980).The freshwater zooplankton of Srilanka, with a discussion of tropical freshwater zooplankton composition.Int. Revue gesHydrobiol. 65:85-125. | ||||
| Ferrar I (1972).Structure and dynamics of pelagic zooplankton in Lakes Bolsena, Bracciano and Vico (Central Italy).Mem.Ist. Ital. Idrobiol. 29: 209-227. | ||||
|
Gannon JE, Stemberger RS (1978). Zooplankton (especially Crustaceans and Rotifers) as indicators of water quality.Trans.Am. Micros. Soc. 97:16-35. Crossref |
||||
| Gupta S (1989). Pollution ecology of some ponds in urban vicinity of Jodhpur.Ph. D. Thesis (Unpublished) University of Jodhpur. p. 234. | ||||
| Hakanson L, BoulinVV,Ostapenia A (2003). The influence of Biomanipulation (fish removal) on the structure of lake food web, case studies using lake web- model. Int.J. Aquat. Ecol. 37:47-68. | ||||
| Holyoak M, Leibold MA, Holt RD (2005).Metacommunities, Spatial Dynamics and Ecological Communities. Chicago University Press, Chicago. | ||||
| Hutchinson GE (1967).A treatise on limnology, Vol. II, Introduction to lake biology and the limnoplankton. John Wiley and Sons, Inc, New York. London Sydeny.p. 115. | ||||
| Isaiarasu L, Mohandoss A (1998). Hydrobiological survey in ponds aroundSivakasi.The Proc. of Nat. Sym. on Envi.Biol. St. Xaviers College, Palayamkottai, India, 212. | ||||
| Jalilzadeh AKK, Yamakanamardi SM, Altaff K (2008). Abundance of zooplankton in three contrasting lakes of Mysore city, Karnataka state, India, Sengupta, M. and Dalwani R. (eds.) Proceedings of Taal 2007: The 12th World Lake Conference. pp. 464-469. | ||||
|
Jana BB, Pal GP (1984). The life history parameters of Diaphanosoma excisum (Cladocera), grown in different culturing media. Hydrobiology 118:205-212. Crossref |
||||
|
Jeppesen E, Sondergaard M, Jensen JP, Mortensen E, Hansen AM,Joergensen T (1998). Cascading trophic interactions from fish to bacteria and nutrients after reduced sewage loading: An 18-year study of a shallow hypertrophic lake. Ecosystem 1(3): 250- 267. Crossref |
||||
| Joshi G (1987). Diurnal studies of physico–chemical properties of limnological importance. Ph. D. Thesis (Unpublished). Vidhyalaya, Sagar, 204. | ||||
|
Junk WJ (2002).Long-term environmental trends and the future of tropical wetlands.Environ. Conserv.29:414-435. Crossref |
||||
|
Kasai F,Hanazato T (1995).Effects of the triazine herbicide, simetryn, on freshwater plankton communities in experimental ponds.Environ. Pollut.89: 197-202. Crossref |
||||
|
Kirk KL, Gilbert JJ (1990). Suspended clay and the population dynamics of planktonic rotifers and cladocerans.Ecology71:1741-1755. Crossref |
||||
| KocataÅŸ A(1992).EkolojiveÇevreBiyolojisi, EgeÜniv.Matbaası, Ä°zmir, 564. | ||||
| Kumar A, Tripathi S, Ghosh P (2004). Status of freshwater in 21 Century: A review. In: Water pollution, assessment and management, Kumar, A and Tripathi, G. (Eds.).Daya Publishers, Delhi.3: 520. | ||||
| Kurbatova SA (2005). Response of microcosm zooplankton to acidification; Izv.Akad.Nauk. Ser. Biol. 1 100-108. | ||||
|
Lougheed VL, Chow-Fraser P(1998). Factors that regulate the zooplankton community structure of a turbid, hyper-eutrophic Great Lakes wetland. Can. J. Fish.Aquat. Sci. 55:150-161. Crossref |
||||
| Mageed A (2008). Distribution and long-term historical changes of zooplankton assemblages in Lake Manzala (south Mediterranean Sea, Egypt).Egypt. J. Aquat. Res. 33(1): 183-192. | ||||
|
Makino W, Ban S (2000).Response of life history traits to food conditions in a cyclopoid copepod from an oligotrophic environment. Limnol.Oceanogr. 45: 396-407. Crossref |
||||
| Malathi D (1999). Ecological studies on lakeHussainSagar with special reference to the zooplankton communities - Ph. D. Thesis Osmania University, Hyderabad. | ||||
| Mandaville SM (2002). Benthic Macroinvertebrates in Freshwater–Taxa Tolerance Values, Metrics, and Protocols, Project H-1. (Nova Scotia: Soil & Water Conservation Society of Metro Halifax). | ||||
|
Michael RG, Sharma BK (1988).INDIAN CLADOCERA.(Crustacea: Branchiopoda: Cladocea).Fauna of India and adjacent countries.Zool. Sur. India p.261. PMid:3196451 |
||||
| Mishra A, Chakraborty SK, Jaiswar AK, Sharma AP, Deshmukhe G, Mohan M (2010). Plankton diversity in Dhaura and Baigul reservoirs of Uttarakhand.Indian J. Fish.57(3): 19-27. | ||||
| Mukherjee B (1997). Environmental Biology, Tata McGraw Hill Publishing Company Limited, New Delhi. | ||||
| Mulani SK, Mule MB, Patil SU (2009). Studies on water quality and zooplankton community of the Panchgangariver in Kolhapur city. J. Environ. Biol. 30: 455-459. | ||||
| Needham GT, Needham PR (1962).A guide to study of fresh water biology.Pub.Holden-Day. San Fransisco, USA. 106. | ||||
|
Nogueira MG (2001). Zooplankton composition dominance and abundance as indicators environmental compartmentalization in Jurumirim reservoir (Paranapanema river), Sao Paulo, Brazil. Hydrobiology 455: 1-18. Crossref |
||||
| Okogwu IO, Christopher DN, Florence AO (2010).Seasonal variation and diversity of rotifers in Ehomalake, Nigeria.J. Environ. Biol. 31: 533-537. | ||||
| Padmanabha B, Belagali SL (2006). Comparative study on population dynamics of rotifers and water quality index in the lakes of Mysore. J. Nat. Environ. Pollut. Technol. 5: 107-109. | ||||
| Paliwal AK (2005). Seasonal variation in freshwater protozoans in Kali-Nadi, District Etah, U.P. India, Pawar, S. K and J. S. Pulle (eds). Daya Publishing House, Delhi, Ecology of Plankton.p. 294. | ||||
| Pani S, Bajpai AK, Dubey A, Misra SM (2000). Evaluation of water quality of Bhoj wetland through matrics determination with reference to threatened fish Mahseer, Bhopal. In: Proc. Nat. Workshop Biodivers. Conserv.Aquat.Res. pp. 96-108. | ||||
| Patil SG (1978).Plankton ecology of a few water bodies from Nagpur. Ph. D. Thesis submitted to University of Nagpur. | ||||
| Pejler B (1977). On the global distribution of the family Brachionidae (Rotatoria).Arch. Hydrobiol. Suppl. 53: 255-306. | ||||
| Pennak RW (1978). Freshwater invertebrates of the United State.2nd Ed., John Willy and Sons, New York, U.S.A. pp. 803. | ||||
|
Pielou EC (1966).The Measurement of Diversity in Different Types of Biological Collections. J. Theor. Biol. 13: 131-144. Crossref |
||||
| RajashekharM, VijaykumarK,Zeba P (2009).Zooplankton diversity of three freshwater lakes with relation to trophic status, Gulbarga district, North-East Karnataka, South India.J. Syst. Biol. 1: 32-37. | ||||
| Robinson C (2004). Evaluating the applicability of the Wetland Zooplankton Index (WZI) to Georgian Bay Wetlands, Final Report for Biology, 4F06. | ||||
|
Saksena ND (1987). Rotifera as indicators of water quality.ActaHydrochim.Hydrobiol. 15: 481-485. Crossref |
||||
|
Sampaio EV, Rocha O, Matsumura T,Tundisi JG (2002). Composition and abundance of zooplankton in the limnetic zone of seven reservoirs of the Paranapanema River, Brazil. Braz. J. Biol. 62:525-545. Crossref |
||||
| Sarkar SK,ChowdhuryB (1999).Limnological Research in India. 1st Edn.,Daya Publishing House. pp. 108-130. | ||||
| Shannon EH, Weaver W(1947).The mathematical theory of communication.University of Illinois Press, Urbana. | ||||
| Sharma BK (1999). Freshwater Rotifers (Rotifera: Eurotatoria) Zoological Survey of India. State Fauna Series 3, Fauna of West Bengal, Part 11: 341-468. | ||||
| Sharma BK (2011). Zooplankton communities of DeeporBeel (a Ramsar site), Assam (N. E. India): ecology, richness, and abundance.Trop. Ecol. 52(3): 293-302. | ||||
| Sharma BK, Sharma S (2011). Zooplankton diversity of Loktak Lake, Manipur, India.J. Threatened Taxa3(5): 1745-1755. | ||||
| Sharma S, Sharma BK(2008). Zooplankton diversity in floodplain lakes of Assam.Records of the Zoological Survey of India, Occasional Paper No. 290: 1- 307. | ||||
| Singh SP, Pathak D,Singh R (2002). Hydrobiological studies of two ponds of Satna (M.P) India. Ecol. Environ. Conserv. 8: 289-292. | ||||
| Subla BA, Wanganeo A, Raina R, Vishen N, Zutshi DP (1992). Studies on zooplankton of Jammu and Kashmir State. In S. Nath (ed.). Rec. Adv. Fish Ecol. Conserv. pp. 33-49. | ||||
|
Syuhei B (1994). Effect of temperature and food concentration on post- embryonic development, egg production and adult body size of calanoid copepod Eurytemoraaffinis.J. Plankton Res. 16(6): 721-735. Crossref |
||||
| Tanner CC, Craggs RJ, Sukias JP, Park JB (2005). Comparison of maturation ponds and constructed wetlands as the find stage of an advanced pond system. Water Sci. Technol. 51: 307-314. | ||||
| Thomas M, Deviprasad AJ (2007). Phytoplankton diversity in wetlands of Mysore district.Asian J. Microbiol.Biotechnol. Environ. Sci. 9:385-392. | ||||
| Trivedi RK,Guruna V, Das BK, Rout SK (2003).Variations of plankton population of two hill streams of the Darjeeling District, West Bengal. Environ. Ecol. 21:50-53. | ||||
|
Uye S, Shimazu T, Yamamuro M, Ishitobi Y,Kamiya H (2000). Geographical and seasonal variations in mezozooplankton abundance and biomass in relation to environmental parameters in lake Shinji-Ohashi River-Lake Nakaumibrackisw water system Japan. J. Mar. Syst. 26(2): 193-207. Crossref |
||||
| Uzma A (2009). Studies on plankton communities of some eutrophic water bodies of Aligarh. M.Sc. Thesis (Unpublished), Fisheries and Aquaculture Unit, Department of Zoology, Aligarh Muslim University (AMU), Aligarh, India. | ||||
| Verma N, Bajpai A,Dwivedi SN (2009). Planktonic biodiversity of Bhoj wetland, Bhopal. J. Appl. Sci. Environ. Manage. 13(4): 103-111. | ||||
| Verma PK, Munshi D (1987). Plankton community structure of Badua reservoir, Bhagalpur (India). Trop. Ecol. 28: 200-207. | ||||
| Victor R, Fernando CH (1979). The fresh water Ostracoda (Crustacea: Ostracoda) of India. Records of the zoological survey of India 74(2): 147-242. | ||||
| Wadajo K (1982). Comparative limnology of lakeAbiata and lake Langano in relation to primary and secondary production M.Sc. Thesis (Unpublished) Addis Abeda University Ethiopia. p. 162. | ||||
|
Wadajo K, Belay S (1984). Species composition and seasonal abundance of zooplankton in two Ethiopian Rift Valley lakes, Abiata and Langano.Hydrobiology 113: 129-136. Crossref |
||||
| Wanganeo A, Wanganeo R (2006). Variation in zooplankton population in two morphologically dissimilar rural lakes of Kashmir Himalayas. Proc. Nat.Acad. Sci. India 76(B)III: 222-239. | ||||
|
Webber MK, Roff JC (1995).Annual biomass and production of the oceanic copepod community off Discovery Bay Jamaica. Mar. Biol. 123:481-495. Crossref |
||||
| Wetzel RG (1983). Limnology. Philadelphia: Saudens College Publishing. pp. 457-767 | ||||
| Wetzel RG (2001). Limnology:Lake and River Ecosystems. 3rd ed. Academic Press N.Y.1006. | ||||
|
Wilhm JL, Dorris GT (1968). Biological parameters for water quality criteria.Bioscience 18:477-481. Crossref |
||||
|
Willis KJ, Van PJ, Den B, Green JD (2004). Seasonal variation in plankton community responses of mesocosms dosed with pentachlorophenol. Ecotoxicology 13:707-720. Crossref |
||||
Copyright © 2024 Author(s) retain the copyright of this article.
This article is published under the terms of the Creative Commons Attribution License 4.0


