ABSTRACT
This study investigates the economic value of Hawassa Amora-Gedel recreational park and determines the factors that affect the public’s willingness to pay for the quality improvement of the recreational park. A contingent valuation method was applied to measure public willingness to pay (WTP) for the quality improved recreational park. Based on random sampling technique, 390 visitors were selected to determine people’s preferences on the park improvement. The Heckman selection model was used to analyze the factors affecting people’s participation in the park improvement and the valuation of the quality improved recreational park. The analysis of the determinants of WTP shows that education, duration of the park users in the watershed, income, urban residents and multiple uses of the recreational park influence the park improvement positively. The valuation of the recreational park in terms of entrance fee shows that visitors are willing to pay Birr 25.77 (US$1.43) per person when the quality of the recreational park is improved, which is five times higher than the current charge for a single visitor on the status quo.
Key words: Contingent valuation method, Heckman selection model, recreational park, willingness to pay.
Lake Hawassa has given the natural beauty to Hawassa city, which was established in 1956 with the authorization of Emperor Hailesilassie with the appropriate master plan for tourist attraction along the shore of the lake. Amora-Gedel recreational park is one of the amenity values that Lake Hawassa benefits the society. The recreational park was given the name “Amora-Gedel” with the reference to the mass of Marabou storks that exist at the park, where “Amora” is synonymous to Marabou stork (Leptoptilos crumenifer) and “Gedel” to downstream location. So, “Amora-Gedel” refers to the site for large number of Marabou storks. The park was earlier occupied by Princess Tenagne Teferi, who was the daughter of Emperor Hailesilassie. After 1974 it has been reserved as main recreational park for Hawassa people under Hawassa municipality.
The unique birds, beautiful wild lives in the recreational park, and the impressive and breath taking view of the sun set over the lake are some of the special memories of the recreational park. Large number of congregatory waterbirds occurs on the lake around the park, with 20,000 birds counted along less than 25% of the
shoreline. Some wild animals that are unique to Ethiopia such as Colobus monkey and others add values to the recreational park. However, this recreational park has not been well managed and the majority of the visitors have not been satisfied with the status quo services provided at the recreational park. The aesthetic quality of the park is assumed to be valuable to society, yet few policy makers incorporate the value of the biodiversity it supports and the recreational opportunities it provides into the resource management. The decisions on the park management without incorporating the economic value of the recreational park have resulted in the resource degradation.
The benefits of investments in the recreational park improvement are not all appreciated locally as society realizes the benefit of the resource services only after it has disappeared. This limits the ability of users to invest in resource conservation. Lost recreational opportunities are understood only after the park ecosystem has been degraded. This calls for a necessary policy for the resource management on the basis of environmental valuation. Valuation forms a key exercise in economic analysis and provides important information for conservation of resources. The basic aim of valuation is to determine people’s preferences how much they are willing to pay for, and how much better or worse off they would consider themselves to be as a result of changes in the supply of different goods and services. It, therefore, provides a means of quantifying the benefit that people receive from natural resources, the costs associated with their loss, and the relative profitability of resource uses which are compatible with its conservation. Attaching monetary values to recreational park goods and services aims to make them directly comparable with other sectors of economy when activities are planned and decisions are made. According to Mokhtari and Hosseinfar (2013), it is necessary to analyze the recreational parks from the economic and social point of view so as to control the balance of human-environment relationships for sustainable benefits of the recreational resources. Therefore, the idea behind assigning an economic value on the recreational benefits before ecosystem-altering decisions are made is to recognize the potential costs up front and thereby put park-related decisions on a more economically sound footing.
Unfortunately, integrated information about economic values of the recreational parks which is important for their conservation has been limited in the region. Those who would estimate the benefit of controlling the resources degradation face a dilemma because the studies that have valued local recreational parks are of limited use in determining the resources quality policy changes due to unreliable data. Unreliable results on the economic value of the recreational parks due to lack of quality and sufficient data needed for research have, therefore, contributed little value to the management of local recreational parks. This study differs from previous studies on Lake Hawassa in quantifying the resource use with reference to recreational value in monetary terms so as to reduce its degradation more effectively. Hence, it contributes to sustainable resource use providing the necessary economic information of the lake as a source of recreational benefits to develop socially acceptable, environmentally sound and financially feasible resource management. The objective of this study was to analyze the economic value of quality improved recreational park and the factors determining the visitors’ willingness to pay for the recreational park improvement. The improvement program includes establishment of zoo site and manage the wild animals in the recreational park. When the recreational park is improved, the visitors are supposed to pay for the scenic value of the park. Therefore, are the beneficiaries willing to pay for the improvement of the resource quality? If yes, what are the determinants of their willingness to pay for the quality improvement? This study is limited to the use value of the lake as recreational benefit. The other use values of the lake such as fish products, potential irrigation water, and the non-use value such as the existence value and bequest value of the lake have not been considered in this study.
The remaining part of the study is organized as follows. Section two presents some reviews of theoretical and empirical literature about the recreational use of water resources and their economic valuation. With the aim of ensuring the sustainable use of resource, this section overviews the empirical literature on most widely used technique (contingent valuation) of environmental valuation in terms of recreational value describing the strength and limitation of the contingent valuation method over travel cost method in the application for recreational park. This section also briefly presents some facts about the Heckman selection model describing how it minimizes the selection bias. Section three elaborates the methodology followed in the valuation of the recreational park. This section presents the Heckman selection model with a brief discussion on why this model has been preferred to other models. Section four presents the descriptive and empirical analyses with the help of the Heckman selection model (two-step) to determine the probability of participation and the valuation of participants in support of the proposed improvement. Finally, conclusions are provided based on the results of this specific study.
Recreational use of water resources and economic valuation
Rivers, streams, wetlands, lakes and reservoirs host a vast array of aquatic ecosystems that provide many benefits to humans (National Research Council, 2004). The various recreational services provided by lakes and rivers like fishing, swimming, boating, hunting, picnicking, or nature appreciation in general are all enhanced by the body of water’s natural beauty (Corrigan et al., 2007). The recreational opportunities provided by these resources generate positive impact to local economies through spending on materials and supplies by users and visitors. For example, sales that occur due to tourism like camping fees, restaurant sales, and cultural goods shopping centers increase the wellbeing of the local community (Otto et al., 2012). According to Othman and Jafari (2019), recreational parks help reduce stress and the anxieties of urban life and foster community relations, balancing the built and natural environment and therefore contribute to the overall well-being of the urban community. So, expanding and improving outdoor recreation opportunities is a no-lose proposition for residents as increased access to recreation opportunities enhances quality of life and health of the users (Otto et al., 2012).
Water resources play an important role as recreational destinations which contribute to the increase in tourism industry (Malan, 2010). These activities rely solely on the environmental quality of the lakes. That means the recreational uses of lakes are affected by changes in water quality. Water pollution caused by industrial effluents and municipality sewage may have severe consequences for the aquatic ecosystems as well as the tourism sectors, which rely on the water resources as a source of income and revenue generation. Yaping (1998) states that improvement of water quality increases demand for recreation in lakes with people willing to pay a higher price for better quality of environmental services.
The valuation task is complicated by the fact that the aesthetic value of lakes and rivers are nonmarket goods in that they are not provided by the interaction of buyers and sellers in a market (Corrigan et al., 2007). Since the services that the ecosystems provide and how they are affected by human actions are imperfect and difficult to quantify, the resources continue to be depleted and degraded at an unsustainable rate (National Research Council, 2004; Birol et al., 2006). Lack of available data in applying valuation methods in developing countries like time-series data on resource use productivity or socio-economic statistics on visitors to natural resource amenities can result in the valuation relying on rough approximations rather than accurate data and uncertainty as to whether the sample surveyed is representative of the population as a whole (UNEP, 1998). To implement the most efficient social and economic policies that prevent the excessive degradation and depletion of environmental resources, it is necessary to establish their full value, and to incorporate this into private and public decision-making processes.
Economic values are usually distinguished as use and non-use values. Use value is further classified into direct and indirect use values. Direct use values of water resources can be extracted, consumed or directly enjoyed. It is therefore known as extractive or consumptive use value (Hawkins, 2003). Direct use values of water resources include the consumption of fish for food, water for drinking, cooking and washing, irrigation, recreation and tourism. Indirect use of water resource services includes energy production and nutrient recycling. Non-use values are often intangible and include the value of leaving opportunities for future generations (bequest value) and the value from knowing that the resources exist, which is known as existence value. For water resource goods and services that are traded in the market place and whose prices are not distorted, market prices can be used as indicators for economic values. Often, however, most of goods and services do not have a market price and shadow pricing techniques can be applied to determine their economic values (Schuyt and Brander, 2004). Among several shadow valuation methods that economic theory distinguishes, a well-known method is contingent valuation, which directly obtains consumers’ willingness to pay for a change in the level of environmental good, based on a hypothetical market.
Contingent Valuation Method (CVM) and its advantage over Travel Cost Method (TCM)
Contingent Valuation (CV) is the most widely accepted stated preference method used for estimating total economic value, including all types of non-use values (Hajkowicz and Okotai, 2006). The purpose of the contingent valuation method is to elicit individuals' preferences, in monetary terms, for changes in the quantity or quality of nonmarket environmental resources, which have the characteristics of non-excludability and non-divisibility (Perman et al., 2003; Birol et al., 2006). In conducting the contingent valuation surveys, acknowledgement of all stakeholders, careful survey design and administration, and post survey debriefings (particularly for examining the reasoning behind irrational responses) help improve the process of valuation of environmental resources (Duberstein and de Steiguer, 2004). To conduct a CV survey, special attention needs to be paid to the design and implementation of the survey. Focus groups, consultations with relevant experts, and pretesting of the survey are important pre-requisites. Decisions need to be taken regarding how to conduct the interviews; what the most appropriate payment bid vehicle is for example an increase in annual taxes, a single-one-off payment, a contribution to a conservation fund, among others as well as the WTP elicitation format. The survey may be conducted through face-to-face interviews, telephone or mail surveys. In developing countries, face-to-face interviews are considered the most appropriate because of high rates of illiteracy and defective telephone networks. Fortunately, personal interview is the best approach for reducing sampling bias (McClelland et al., 1993; Turner et al., 2004; Birol et al., 2006).
The contingent valuation estimates of Sauk river chain of Lakes watershed and Lake Margaret in central Minnesota yield mean WTP for Margaret of US$267 and for Sauk of US$17 (Welle and Hodgson, 2011). The findings reflect that the substantially higher WTP for Margaret respondents is driven by the higher level of recreation, the higher proportion of lakeshore ownership in the watershed, greater confidence in the effectiveness of the policy and higher average income. The analysis demonstrates that the watersheds are different in terms of how property owners in the watershed relate to the impaired lakes. The Margaret-Gull Chain has a high degree of surface water as percentage of watershed acreage compared to the Sauk, and consequently a high proportion of lakeshore owners relative to the population of property owners in the watershed. The Margaret-Gull Chain also has many highly-valued lake properties owned by people with high income and a large amount of recreational use by lake owners and visitors. The water quality improvement fee on water utility use of US$30, which was the focal point of the discussion, would mostly accepted by property owners. The findings imply that mean WTP would exceed the $30 amount for many households, so total benefits would be expected to exceed costs. While these revenues would be collected from all water utility customers, those closest to the improved surface waters would stand to benefit more than their costs (Welle and Hodgson, 2011).
The advantage of using Contingent valuation technique over Travel Cost Method (TCM) in valuation of water resources is its ability to capture both use and non-use values. Perman et al. (2003) explains the advantages of CVM over TCM as its answers go directly to the theoretically correct monetary measures of utility changes. This technique is enormously flexible in that it can be used to estimate the economic value of virtually anything. For example, using other valuation methods like hedonic pricing and travel cost method will underestimate the benefits people obtain from improved water resources as they measure only use values. In practice, getting more information close to reality through revealed preferences derived from observed behavior is a difficult task in non-market resources. The Travel cost approach assumes that various factors affecting visitors’ travel costs, including both direct costs and opportunity costs of visitors’ time, influence the length and frequency of visitation to a given destination. However, the travel cost approach has limitations particularly in applications to multiple destination trips and large number of local visitors with negligible travel cost to the site.
Using travel cost method, researchers may find income inversely related to demand and conclude that recreational park use is an inferior good. However, this conclusion contradicts the case where outdoor recreation is considered to be a luxury good. Such an inverse relationship may be a result of a large number of local visitors who use the recreational park frequently but whose demand for recreation in the park is somewhat irrelevant to income due to the short distance to the site. Contingent valuation, therefore, provides more meaningful results in such cases where travel cost method understate the value the residents place on the recreational park due to the negligible travel cost they incur when visiting the park. In the valuation of improved water quality for recreation in East Lake, Yaping (1998) applies both contingent valuation and travel cost methods. The multivariate analysis of travel cost method reveals income and education are insignificant factors affecting demand. Furthermore, travel cost method shows that income is inversely related to demand for East Lake, which implies that the lake is inferior good. However, the East Lake is still regarded as a luxury good (Yaping, 1998) whereas, the contingent valuation method of the same lake shows that education and income are significant at 1% level. The comparison of the values from TCM and CVM shows that the net addition of consumer surplus due to quality improvement with TCM is RMB¥18.09/m2 at swimming level while the total WTP in the recreational area with CVM is RMB¥21.41/m2 if water becomes clean enough for swimming (Yaping, 1998). This finding reflects that CVM value is higher than that from TCM.
Despite the strengths of this technique over others regarding its ability to estimate both values (use and non-use) and evaluate irreversible changes, contingent valuation method is criticized for its limitations in addressing full services and functions of the environmental resources. CVM is also criticized for its lack of validity and reliability (Mathews, 1999; Birol et al., 2006). As this technique is survey-based and all relevant stakeholders are not included in valuing resource for reaching effective resource management, outcomes of contingent valuation may, however, be less accurate (Duberstein and de Steiguer, 2004). In addition, since the contingent survey instrument is of a hypothetical market, the data is criticized for its bias, some of which are hypothetical bias and strategic bias (Birol et al., 2006; Krantzberg and de Boer, 2006).
Hypothetical bias is caused by the hypothetical market nature of the contingent valuation. Hypothetical bias is created when respondents are not capable of knowing the environmental resource values without participating in a market in the first place in spite of their well preparation to reveal their true values (Turner et al., 2004) whereas, strategic bias means that people purposively state a higher or a lower price than what they are willing to pay; in this way the resource will be either underestimated or overestimated and someone else will bear the over- or underestimated cost (Bulov and Lundgren, 2007). For instance, respondents may deliberately understate their WTP when they believe that the actual fees they will pay for provision of the environmental resources will be influenced by their response to the CV question. Conversely, realizing that payments expressed in a CV exercise are purely hypothetical, respondents may overstate their true WTP hoping that this may increase the likelihood of a policy being accepted (Birol et al., 2006). In the social sciences, bias in the estimated effects from any given study is very difficult to rule out, no matter how intuitively appealing the methodology. There is, unfortunately, no statistical silver bullet. Fortunately, sometimes the Heckman selection Model as an approach is applied to observational data for the purpose of estimating an unbiased causal effect (Briggs, 2004).
Heckman selection model for resource valuation
When the population of the study area is quite large with no boundaries, sampling can only define the scope that is selected by the researchers. It is possible to insert irrelevant variables or not to include associated variables in the sample, which may cause sample selection bias. Heckman’s two-step model explicitly resolves potential sample selection bias (Zhang et al., 2014). The Heckman two-step model examines the two steps leading to respondents’ decisions in a single model while distinguishing the influence of different factors between these two steps. That means it investigates the factors influencing willingness to pay along with payment level in a single model. It also prevents the disturbance of respondents whose WTP is zero.
In contingent valuation of Cheimaditida wetland, the mills inverse ratio, which is significantly different from zero, confirms the sample selection bias. The regression of the estimated inverse mills ratio against the parameters of the valuation equation produced an R2 value of 0.10 which indicates an insignificant level of correlation. Thus the two-step model is appropriate for estimating the participation and valuation decisions for the proposed improvement of Cheimaditida wetland (Birol et al., 2006).
In Heckman two-step model, all explanatory variables must be contained in the first stage, while the second stage must contain fewer variables than the first stage (Baum, 2006). That means, Heckman model should include at least one variable in the first stage that is different from the variables included in the second stage. Based on this principle, Zhang et al. (2014) incorporate eight explanatory variables in the first stage and four explanatory variables in the second stage. The finding of CVM with Heckman’s two-step model shows that farmers have positive WTP with their average annual WTP being US$64.39/household and income, residential location; arable land area and contracted water area are significantly related to payment levels for Poyang Lake Wetland (Zhang et al., 2014).
The Heckman model can help social work research by providing researchers with methods of detecting and correcting sample selection bias (Cuddeback et al., 2004). In other words, the application of Heckman's sample selection model shows efficiency and robustness of controlling for selection bias through a two-stage process (Gou, 2009). This model allows using information from non-supporting individuals to improve the estimates of the parameters in the regression model. Hence, the Heckman selection model provides consistent, asymptotically efficient estimates for all parameters in the model. Generally, the selection equation is estimated by maximum likelihood as an independent probit model to determine whether to participate and pay using information from the whole sample of supporters and non-supporters. A vector of inverse Mills ratios (estimated expected error) can be generated from the parameter estimates. The WTP amount, y, is observed only when the selection equation equals 1 (i.e. individuals support the program) and is then regressed on the explanatory variables, x, and the vector of inverse Mills ratios from the selection equation by ordinary least squares. Therefore, the second stage reruns the regression with the estimated expected error included as an extra explanatory variable, removing the part of the error term correlated with the explanatory variable and avoiding the bias.
In studying the relation between a dependent variable (WTP) and a set of explanatory variables, the Heckman model is explained as a proportion of the observations falls on WTP = constant a, and no observations are found below the known constant a. For instance, the WTP amount ranges from US$20 to US$100 and some respondents prefer to remain neutral, which literally WTP = 0. Therefore, respondents whose WTP is below US$20 are not observed. Consequently, the estimation of the parameters is violated. One way to deal with the case of observations found below a known constant is just making an assumption that it has originated from censoring of some latent variables. The simplest way of expressing the relation between WTP and the latent variable is using the Tobit model (Tobin, 1958), which is an extension of the Probit model.

This Tobit model was later generalized by Heckman who introduced further a latent variable to take account of selection effects (Jonsson, 2008). There is a separate latent variable doing the censoring in Heckman model that is different to the variable determining the outcome equation. This difference also requires taking account of the correlation between the disturbances in the selection and outcome equation.
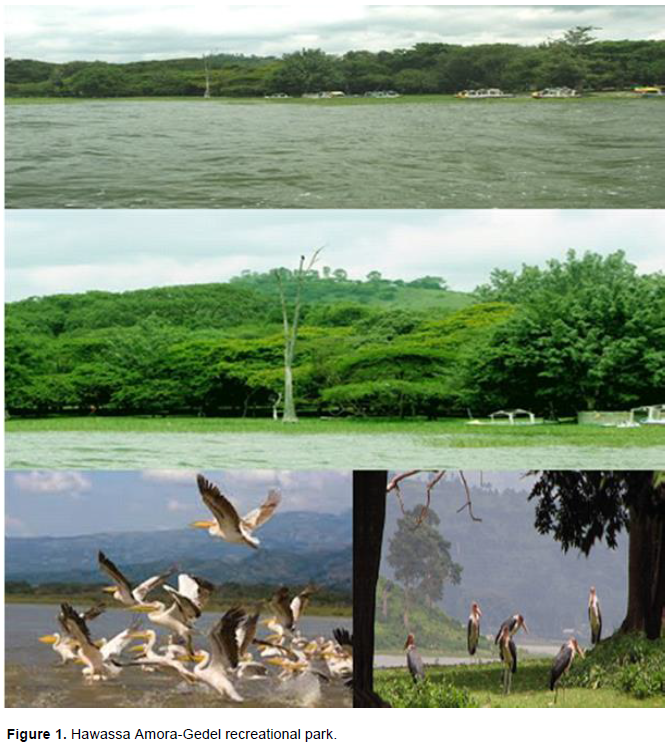
Description of the study area
The recreational park (Figure 1) is located in Hawassa city along the lake side of Hawassa in the southern Ethiopia with the geographical location of 6°33’ – 7°33’N and 38°22’ – 39°29’E. Hawassa catchment has elevations ranging from 1692 to 1742 meter above sea level. The surface area of Lake Hawassa on average is 93.5 km2 with maximum depth of 32.2 m and the average depth of 13.6 m. The seasonal variation of the lake water level ranges from 0.09 to 1.57 m with an average of 0.66 m (Halcrow, 2009). Unlike other closed lakes with alkaline characteristics, Lake Hawassa is one of the few fresh closed lakes with its electrical conductivity of 802 μS/cm, and pH=8.6 (Tenalem et al., 2007). The freshness of the lake water could be justified as water from Lake Hawassa catchment can flow to lakes of lower altitude of the Ethiopian rift valley, for example Lake Ziway, Langano, Abyata, Shala, Abaya and Chamo through the subsurface when the hydrological condition permits (Yemane, 2004).
Survey design and development
A contingent valuation survey instrument was designed as the scenario informs the change in the recreational park under valuation. It explains clearly how that change would come about; how it would be paid for; and the larger context that is relevant for considering the change. The question was phrased using the payment vehicle of entrance fee for quality improved recreational park. The design was to ensure the values expressed by the respondents would be those held for the recreational park management. Based on random sampling technique, 390 respondents were selected from the recreational park users using the formula: n > 104+m (Green, 1997), where n = sample size, and m = the parameters that are expected to affect the willingness to pay for the park quality improvement. In addition, for regression equations using six or more predictors, an absolute minimum of 10 participants per predictor variable is appropriate. However, if the circumstances allow, a researcher would have better power to detect a small effect size with approximately 30 participants per variable (Van Voorhis and Morgan, 2007). To make the sample representative of the whole population, the sample size obtained using the above formula was critically examined in line with the proportionality of the sample to total population. The questionnaire was designed to consist three sections. The first section was about the respondents’ knowledge, attitudes, and perception about the resource and its environmental problems, which provide an explanation of the environmental issue of interest together with information on the change in quality. The second section was about the contingent valuation scenario created for the resource improvement program and the respondents’ willingness to pay in support of the proposed improvement. The third section was about the respondents’ socio-economic characteristics like information on the respondents’ educational level, income, and other socio-economic and demographic characteristics, which enable analysis and verification of the validity of responses on willingness to pay given by respondents.
Empirical model specification
When the population of the study area is quite large with no boundaries, sampling can only define the scope that is selected by the researchers. It is possible to insert irrelevant variables or not to include associated variables in the sample, which may cause sample selection bias. Heckman’s two-step model explicitly resolves potential sample selection bias (Zhang et al., 2014). The model examines the two steps leading to respondents’ decisions in a single model while distinguishing the influence of different factors between these two steps. That means it investigates the factors influencing willingness to pay along with payment level in a single model. It also prevents the disturbance of respondents whose WTP is zero. It is a two equation model: the regression model and the selection model.
Socio-economic characteristics of the recreational park visitors
From the total respondents, 78.2% were males while 21.8 were females (Table 1). The employment status reflects that the respondents participate in various economic activities like employment in governmental or non- governmental organization, self-employment, and agricultural activities. The majority of the respondents were married and the family size of the respondents ranges from 1–12 with the average size of 4.4. The educational background reveals two-third of the respondents attained secondary or tertiary levels. About 55% of the respondents were in the youth age category while only 4.6% were in the age range between 51 and 87 years. The residential location of the respondents reveals that 61.8% were from urban areas while 38.2% from rural areas.
Responses of the visitors to the contingent valuation of the recreational park
The majority of the respondents expressed their willingness to participate in the recreational park improvement in order to provide the services at the maximum potential. About 80% stated their monetary contribution for the park improvement in terms of entrance fee ranging from Birr 5 to Birr 50, with the average value of Birr 24. From the respondents who expressed their willingness to participate in the park quality improvement, 70% stated the entrance fee
ranging from Birr 20 to Birr 30, with the modal value of Birr 30 (Figure 2). The visitors who stated higher entrance fee were found to be of higher educational level and higher annual income earners with relatively small family size. The respondents who were not satisfied with the current status of the recreational park reflected their willingness to participate in the park improvement stating relatively higher entrance fee. The majority of the respondents who expressed their willingness to participate in the quality improvement were in the age range of 20 to 35 years. The mean willingness to pay for this age range was Birr 23.59 while for the age group higher than 35 years the average value of the entrance fee was Birr 24.64 though the variation of the average entrance fees of the two age groups is not statistically significant.
However, about 20% of the respondents preferred to remain neutral in the park quality improvement program. The reasons for not to participate in the quality improvement program was that these respondents were not able to afford any contribution at the time of the survey instrument. These respondents were found to earn low annual income and administer large family size. About 63% of them were also found to reside at distance more than 20 km from the recreational park. These respondents might have less access to the resource due to the travel costs to the recreational park.
Econometric analysis of contingent valuation for recreational park
The Heckman selection method was implemented in determining the factors affect the visitors’ participation in the park quality improvement and the valuation of the improved recreational park with the payment vehicle of entrance fee. The contingent valuation results show that education, agricultural land owners, visitors who stayed longer in the watershed, income, multiple users of the park and urban residents positively influence the participation in the park quality improvement while those who were satisfied with the status quo, older visitors and those who administer large family size are less likely to participate in the resource quality improvement.
The valuation of the recreational park reveals households with a number of visits per year, male households, married visitors, educated households, employees with reference to farmers, agricultural land owners with reference to no asset owners in the watershed, visitors who stayed longer in the watershed, households with higher annual income and urban residents are willing to pay higher amount for the improved recreational park while the households who are satisfied with the current services and older households attach lower monetary value to the recreational park. The significant Mill’s inverse ratio that was generated from the model as additional explanatory variable indicates that there was selection bias. The Heckman selection model was therefore applied to correct such selection bias.
The measure of the overall significance of the model with the null hypothesis that all coefficients were zero was rejected at 1% of significance level in favor of the hypothesis that at least one of the coefficients was different from zero. The pseudo R2 was 0.5166 (Table 2), which reflected that 51.66% of the variation in the participation was explained by the variables included in the model. The adjusted R2 (0.4911) reveals the variation in the valuation was explained by the explanatory variables by 49.11%. The overall significance level of Heckman selection (probit) at 1% implies that the model was acceptable to explain the variation in participation for the park quality improvement by the explanatory variables.
Freqvisit
Freqvisit stands for the frequency of visit. The households with a number of visits per year are found to be positive and significant at 1% level. It can be explained as the households who expressed their motivation to participate in the resource improvement are likely to pay higher value for the improved recreational park. Tameko et al. (2011) also found frequency to be significantly correlated with willingness to pay. It implies that those who visit the urban park regularly are more willing to pay for the implementation of the management plan.
Satisfaction
It is negative and significant at 1% level in the participation and valuation of the recreational park. The households who were satisfied with the current services of the recreational park are less likely to participate in the quality improvement and also found to attach lower amount for the improved recreational park. This implies that those who have identified the poor services of the recreational park are willing to pay for the improvement. Yaping (1998) observed the positive and significant impact of visitors’ judgment-on-quality on willingness to pay for the quality improvement.
Gender
It is positive and significant at 1% level. It implies that males are willing to pay higher monetary amount for the improved recreational park as compared to females. This can be explained as males have more access to outdoor activities and make decisions on finance to manage resources as compared to females. Tameko et al. (2011) explained the positive and significant coefficient of gender as more males are more willing to pay for the urban park improvement than females.
Age
It is negative and significant at 1% level, which implies that youths are more likely to participate in resource quality improvement and attach higher amount for the improved recreational site as compared to older people. The negative sign for age is consistent with the finding of Khan (2006) who explained as age appears to be an important determinant of demand for park visitation and inversely related. That is, as age increases, participation in the proposed improvement and valuation of the park decrease. Corrigan et al. (2007) explained the negative and significant effect of age in the study of aesthetic values as the youngest visitors have more free time and are more likely to visit attractive resources. Tameko et al. (2011) explained the negative and significant effect of age on willingness to pay as the older the respondents are the less they are likely to pay for the improved recreational park. McKean et al. (2005) also reflected age to negatively and significantly affect the water-skiing activity. However, Adili and Robert (2016) find positive and significant influence of age on the number of days a visitor stays in the park, and justifies as older visitors spent more days for recreation at Kilimanjaro National Park compared to middle aged and younger visitors.
Marstat
Marstat stands for the marital status. It is significant at 1% significance level on the valuation of the recreational park. The positive and significant effect of marital status on the valuation reflects that married individuals can help each other in covering other costs and then make decision on water resource improvement program as compared to unmarried individuals. Married couples may consider the bequest value of the resource and attach higher amount for the improved recreational park as compared to singles.
Famlsize
Famlsize refers to family size. It is negative and significant at 1 percent of significance level for the participation. Households with large family size are less likely to participate in the park improvement program as compared to households who administer small family members. Herath (1999) also found family size to be negative and significantly influence the WTP for the recreational values of Lake Mokoan in Victoria. This finding is again consistent with that of Moges (1999) in the analysis of willingness to pay for Lake Tana recreational site.
Education
The positive sign and significant effect of education on participation and valuation of the recreational park reveal educated people have better understanding on both use and non-use values of natural resources and ensure their motivation to participate in the improvement program. Educated people can easily realize the poor quality of non-marketable goods and the consequences of inadequate waste management and hazardous chemicals released from the industries and domestic wastes. People with higher educational level give much attention to recreational sites understanding that the scenic beauty has uncountable benefits to refresh mind stressed with various activities. Therefore, education positively and significantly influences the participation in the quality improvement and valuation for the improved recreational park. Corrigan et al. (2007) stated that willingness to pay increases with educational attainment in the study of aesthetic values of lakes and rivers.
Employment status (Gov/NGO employee or self-employed)
Employees are more likely to pay higher amount for the recreational park with reference to farmers. Most of the time farmers value natural resources in terms of the major uses they benefit like irrigation. The employees give more attention to the recreational value of the resource in addition to irrigation and hence reflect their willingness to pay high amount for the improved recreational park.
Agricland
Agricland stands for agricultural land. It is significant at 10 percent level for participation and 1% significance level for the valuation of the improved recreational park. Households who owned permanent asset like agricultural land are positively and significantly influence the participation on the resource quality improvement and valuation of the improved recreational park with reference to households who have no land in the watershed.
Duration
It is positive and significant on both participation and valuation of the recreational park. Households who stayed longer period in Hawassa watershed are more likely to participate in the quality improvement and attach higher value for the improved recreational park. This can be due to the fact that these people have realized the difference between the current and previous quality level of the park, and hence are motivated to improve the quality of the recreational park.
Income
The coefficient associated with income is positive and significant at 1% level on participation in the park improvement and the valuation of the improved recreational site. The income effect reflects the visitors’ ability to pay higher monetary value for the resource improvement. Corrigan et al. (2007) find positive and significant effect of income on the determination of aesthetic quality of water resources. In the analysis of economic valuation of recreational use value of Kilimanjaro National park, Adili and Robert (2016) find positive and significant influence of income on the number of days a visitor stays in the park. According to Khan (2006), and Tameko et al. (2011), the positive and statistically significant impact of income on the willingness of visitors to pay is in conformity with the theory that the more the income of the users of the park increases, the more they are willing to pay for an improvement of the park.
Usetype
Usetype stands for uses of the park. It is positive and significant at 1% level in the participation of the resource improvement. Households who benefit in multiple uses of the resources like leisurely walk, academic excursion, reading in the park, fish consumption, boating, and beauty scenery are likely to participate in the improvement program. Tameko et al. (2011) indicate the different activities that the visitors undertake at the recreational park like marriage, snapping pictures, and friendly discussion have positive and significant impact on the willingness to pay. It means that the more the respondents undertake various activities in the park the more they are willing to pay for the improvement program.
Location
It has positive sign for participation and valuation of the improved park with the significance level of 5% and 1% levels for participation and valuation, respectively. It implies that urban residents are more likely to participate in the park management program expressing their willingness to pay high amount for the improved recreational site as compared to the rural residents. This finding is consistent with that of Radam et al. (2009) in the analysis of willingness to pay for the conservation of ecotourism resources at Gunung Gede Pangrango national park.
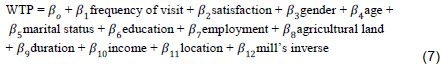
Parametric WTP estimates for the recreational park
To estimate WTP, researchers use parametric and non-parametric approaches depending on their objectives. In non-parametric approach, mean WTP can be calculated using the average value that the respondents state in support of the proposed project. However, this approach provides less economic information to extrapolate the estimated value to the whole population. Whereas, the parametric approach considers the socio-economic characteristics of respondents in the calculation of mean WTP. These socio-economic characteristics are common to the whole society of the study area. Hence, the mean WTP estimated using the parametric approach is more reliable than the non-parametric approach. Considering the significant variables, the regression equation for parametric mean WTP can be written as:

Incorporating the coefficients and their respective mean values into the WTP equation, the parametric mean value for single entrance is calculated to be Birr 25.77 per person. The comparison between the parametric and non-parametric approach (Birr 24) shows that the parametric mean value is higher than the non-parametric value. Tameko et al. (2011) also found higher parametric mean WTP as compared to non-parametric approach in the valuation of improved urban park in Cameroon. This finding is also consistent with that of Hite et al. (2002) in willingness to pay for water quality improvements in the case of precision application technology. Therefore, the entrance fee to Amora-Gedel recreational park is preferably the value of parametric approach, which is Birr 25.77 per person.
Potential revenue for the quality improvement of the recreational park
The result of the survey instrument reflects the family size is 4.3 per household. UN estimates that the urban population of Ethiopia is growing at an average rate of 3.5% per year (Angel et al., 2013). The population of Hawassa watershed, which had been 502,096 in 2007 (CSA, 2007), was estimated to be 684,305 in 2016. Taking the average family size of the survey instrument, the households of the study area was estimated to be 159,140.
The revenue at various WTP level is calculated using the total households who can pay at least that amount. For instance, household who is able to pay Birr 20 can pay at least the amount less than Birr 20. To carry out such estimation, cumulative frequency of households is computed and then multiplied with respective average willingness to pay and frequency of households visit the recreational park in a year (Table 3). The revenue expected to be collected from the quality improved recreational park varies from Birr 598,433.92 to Birr 43,908,366.77 (Table 3) based on the entrance fee and the number of visitors who are able to pay the fixed entrance fee. The highest revenue can be collected at the entrance fee of Birr 21.05. However, only 64.6% of the total households are willing to pay the entrance fee of Birr 21.05.
As it can be seen (Table 3), the expected revenue increases irregularly as the entrance fee increases to Birr 21.05, where the possible revenue reaches maximum (Birr 43,908,366.77) and then decreases when the entrance fee increases further to Birr 48.65 (Figure 3). This implies that the maximum revenue is expected from the quality improved recreation park when the entrance fee is fixed at Birr 21.05, which gives the possible revenue of Birr 43,908,366.77. The implication of the rise of revenue when the entrance fee increases up to Birr 21.05 is that in inelastic range of demand curve total revenue increases with the rise of entrance fee. Conversely, in elastic range of demand, which is from Birr 21.05 to Birr 48.65, total revenue increases with decreasing of the entrance fee.

Elasticity refers to the responses of households to the change of entrance fee. In inelastic demand curve (from point A to point B in Figure 4), the number of households changes by a smaller percentage than does the entrance fee; whereas, in elastic demand curve (from point B to point C in Figure 4), the number of households changes by a larger percentage than does the entrance fee. The demand curve (Figure 4) has a negative slope like most of economic goods. For normal goods the demand curve is negatively sloped indicating that price increase affects the households’ ability to pay within their limited income, keeping other factors constant.
Comparison of demand and revenue curves on the change of an entrance fee (WTP) reflects the relationship between elasticity and expected revenue from the recreational park. Table 4 summarizes the characteristics of the average WTP (entrance fee) elasticity of demand and the impact on total revenue.
The consumer surplus (CS) is the difference between the price consumers are willing to pay and the actual price they do pay. If the monetary value for the improved recreational park is set to respective average WTP, the consumer’s surplus is calculated by summing up each of the areas (A1 to A10) (Figure 5). The sum of all the areas under the demand curve is Birr 69,088,644.90 (Table 5). The total consumer surplus is determined using the difference between the maximum amount the households are willing to pay (Birr 69,088,644.90) and the product of the mean WTP (Birr 25.77), the number of households who are able to pay that amount (75,342) and the average number of visits of those households per year (22 times). Therefore, the value of the consumers’ surplus becomes Birr 26,572,928.58.
The majority of the households vote in support of the recreational park improvement program with the mean value of Birr 25.77 per person for single entrance. The educated households, those who have agricultural land with reference to residential land, the households who stayed relatively longer period in Hawassa watershed, individuals with higher annual income, households who benefit in multiple uses of the lake, and urban residents are more likely to participate in the park improvement program while the households who are satisfied with the current services of the recreational park, older people, and households who administer large family size are less likely to vote in support of the recreational park improvement program.
The valuation of the recreational park reflects that households with a number of visits, males, married individuals, people with more years of education, employment status with reference to farmers, households who have agricultural land with reference to no land ownership in the water shade, those who stayed more than ten years in the watershed, households with high annual income and urban residents are willing to pay high value for the recreational park improvement. Whereas, those who are satisfied with the current status of the lake and services provided in the recreational park, and older people are less likely to pay for the quality improvement of the recreational park.
The authors have not declared any conflict of interests.
REFERENCES
|
Adili ZY, Robert NH (2016). Economic valuation of recreation use value of Kilimanjaro National Park, Tanzania. Journal of Ecosystem and Ecography 6(4).
Crossref
|
|
|
|
Angel S, de Groot D, Martin R, Fisseha Y, Taffese T, Lamson-Hall P (2013). The Ethiopia Urban expansion initiative: Interim Report - 2. New York University (NYU STERN)
|
|
|
|
|
Baum CF (2006). An Introduction to Modern Econometrics Using Stata; Stata Press: College Station, TX, USA.
|
|
|
|
|
Birol E, Karousakis K, Koundouri P (2006). Using economic valuation techniques to inform water resources management: A survey and critical appraisal of available techniques and an application. Science of the Total Environment 365:105-122.
Crossref
|
|
|
|
|
Briggs DC (2004). Causal Inference and the Heckman Model. Journal of Educational and Behavioral Statistics 29(4):397-420.
Crossref
|
|
|
|
|
Bulov S, Lundgren T (2007). An Economic Valuation of Periyar National Park: A Travel Cost Approach. Economics C-UPPSATS. Lule University of Technology. Available at:
View
|
|
|
|
|
Corrigan JR, Egan KJ, Downing JA (2007). Aesthetic values of Lakes and Rivers. The United States Environmental Protection Agency and the City of Clear Lake, IA, USA.
|
|
|
|
|
Central statistical Agency (CSA) (2007). Third National Population and Housing Census: SNNPR socio-economic and demographic data based on rural-urban and male-female. Population Census Commission. Ethiopia.
|
|
|
|
|
Cuddeback G, Wilson E, Orme JG, Orme TC (2004). Detecting and Statistically Correcting Sample Selection Bias. Journal of Social Service Research 30(3):19-33.
Crossref
|
|
|
|
|
Duberstein JN, de Steiguer JE (2004).Contingent Valuation and Watershed Management: A Review of Past Uses and Possible Future Applications. School of Renewable Natural Resources, University of Arizona. Tucson, USA.
|
|
|
|
|
Gou S (2009). Heckman Sample Selection Model and Its Applications to Social Work Research. SSWR Society for Social Work and Research. Available at:
View Heckman Sample Selection model.
|
|
|
|
|
Green SB (1997). How many subject does it take to a regression analysis? Multivariate behavioral research 26:499-510.
Crossref
|
|
|
|
|
Hajkowicz S, Okotai P (2006). An economic valuation of watershed pollution in Rarotonga, the Cook Islands. Marfleet Printing Co. Ltd., Apia, Samoa. Available at website:
View
|
|
|
|
|
Halcrow Group Limited and Generation Integrated Rural Development (GRID) (2009). Rift Valley Lakes Basin Integrated Resources Development Master Plan Study Project. Phase III. Addis Ababa, Ethiopia: The Federal Democratic Republic of Ethiopia Ministry of Water Resources.
|
|
|
|
|
Hawkins K (2003). Economic Valuation of Ecosystem Services. University of Minnesota. US state of Minnesota. USA.
|
|
|
|
|
Herath G (1999). Estimation of community values of lakes: A study of lake Mokoan in Victoria, Australia. Economic Analysis and Policy 29(1).
Crossref
|
|
|
|
|
Hite D, Hudson D, Intrapapong W (2002). Willingness to pay for water quality improvements: The case of precision application technology. Journal of Agricultural and resource Economics 27(2):433-449
|
|
|
|
|
Jonsson R (2008). When does Heckman's two-step procedure for censored data work and when does it not?. Statistical Research Unit, University of Gothenburg, Sweden. Available at:
View
|
|
|
|
|
Khan H (2006). Willingness to pay for Margalla Hills National Park: Evidence from the Travel cost method. The Lahore Journal of Economics 11(2):43-70.
Crossref
|
|
|
|
|
Krantzberg G, de Boer C (2006). A Valuation of Ecological Services in the Great Lakes Basin Ecosystem to Sustain Healthy Communities and a Dynamic Economy. McMaster University.
|
|
|
|
|
Malan H (2010). Wetland ecosystem service and their valuation: A review of current understanding and practice, wetland valuation. Journal of Ecological Economics 440(9):95-110.
|
|
|
|
|
Mathews LG (1999). Estimating Water Quality Benefits by Combining Revealed and Stated Preference Methods: an application in the Minnesota River. Paper prepared for the 1999 AAEA Annual meeting Nashville, Tennesse USA.
|
|
|
|
|
McClelland G, Schulze W, Lazo J (1993). Additional Explication of Methods for Measuring Non-Use Values: A Contingent Valuation Study of Groundwater Cleanup. Center for Economic Analysis, University of Colorado, Boulder, CO 80309.
|
|
|
|
|
McKean JR, Johnson D, Taylor RG, Johnson RL (2005). Willingness to pay for Non Angler recreation at the Lower Snake River reservoirs. Journal of Leisure Research 37(2):178-194
Crossref
|
|
|
|
|
Moges S (1999). Economic valuation of environmental goods as outdoor recreation. A contingent valuation approach: A case study of Lake Tana, Ethiopia. M.Sc Thesis, Department of Economics, Addis Ababa University, Ethiopia.
|
|
|
|
|
Mokhtari R, Hosseinifar SM (2013). Economic and Social value of recreational facilities in urban areas by using Travel Cost Method (Case study: Amirkola urban park, Mazandaran province, Iran.
|
|
|
|
|
European online Journal of Natural and Social Sciences 2(4):549-555.
|
|
|
|
|
National Research Council (2004). Valuing ecosystem services: Towards better environmental decision-making. National Academies press, Washington DC. Available at: www.nap.edu
|
|
|
|
|
Othman J, Jafari Y (2019). Economic valuation of an urban Lake Recreational Park: Case of Taman Tasik Cempaka in Bandar Baru Bangi, Malaysia. Sustainability 11:3023.
Crossref
|
|
|
|
|
Otto D, Tylka K, Erickson S (2012). Economic value of outdoor recreation activities in Iowa. Doris Duke charitable foundation. Available at: www.ddcf.org
|
|
|
|
|
Perman R, Yue Ma, McGilvray J, Common M (2003). Natural Resource and Environmental Economics. 3rd edition. Pearson Higher Education, under the Addison Wesley imprint.
|
|
|
|
|
Radam A, Nuva R, Shamsudin MN, Shuib A (2009). Willingness to Pay towards the Conservation of Ecotourism Resources at Gunung Gede Pangrango National Park, West Java, Indonesia. Journal of sustainable development 2:2.
Crossref
|
|
|
|
|
Schuyt K, Brander L (2004). The economic values of the world's wetlands. The Swiss Agency for the environment, forests and landscape (SAEFL). Gland/Amsterdam, The Netherlands.
|
|
|
|
|
Tameko AM, Bonfouet HP, Sikod F (2011). The economic valuation of improved urban parks: A case study of Warda park. Journal of sustainable development 4:1.
Crossref
|
|
|
|
|
Tenalem A, Becht R, Leishout AV, Yemane G, Dagnachew L, Onyando J (2007). Hydrodynamics of topographically closed Lakes in the Ethio-Kenya Rift: The case of Lakes Awassa and Naivasha. Journal of Spatial Hydrology 7(1): 81-100.
|
|
|
|
|
Tobin J (1958). Estimation of Relationships for Limited Dependent Variables. Econometrica 26:24-36.
Crossref
|
|
|
|
|
Turner RK, Georgiou S, Clark R, Brouwer R, Burke J (2004). Economic valuation of water resources in agriculture. FAO Water Reports 27, Food and agriculture organization of the United Nations. Rome.
|
|
|
|
|
United Nations Environment Programme (UNEP) (1998). Environmental Valuation: A Worldwide Compendium of Case Studies. In: Abaza H, McCracken JR (eds). Environmental Economics Series (26):1-14.
View
|
|
|
|
|
Van Voorhis CRW, Morgan BL (2007) Understanding power and rules of thumb for detecting sample sizes. Tutorials in quantitative methods for psychology 3(2):43-50.
Crossref
|
|
|
|
|
Welle PG, Hodgson JB (2011). Property owners' willingness to pay for water quality improvements: Contingent valuation estimates in two central Minnesota watersheds. Journal of Applied Business and Economic 12(1):81-94.
|
|
|
|
|
Wooldridge J (1999) Econometric Analysis of Cross Section and Panel Data. MA: MIT Press.
|
|
|
|
|
Yaping D (1998). The value of improved water quality for recreation in East Lake, Wuhan, China: Application of Contingent valuation and Travel cost methods. Economy and Environment Program for Southeast Asia.
|
|
|
|
|
Yemane G (2004). Assessment of the Water Balance of Lake Awassa Catchment. A Thesis submitted to the International Institute for Geo-information Science and Earth Observation, ITC, Netherlands.
|
|
|
|
|
Zhang N, Kong F, Xiong K (2014). Determinants of farmers' willingness to pay and its level for ecological compensation of Poyang Lake wetland, China: A household-level survey. Sustainability ISSN 2071-1050. Available at:
View.
Crossref
|
|