Full Length Research Paper

ABSTRACT
An attempt was made to use remote sensing technique to analyze some structural components of the metamorphic basement complex of the Ikare area in the SW Nigeria. Multiple data sets coupled with application of directional filtering techniques were used to extract linear features from Landsat ETM+ image with a view to improving on already produced regional structural map of the area and also determine a fast and cost effective approach to lineament mapping when handling multiple datasets. Band 7 (2.080 - 2.35) µm of the ETM+ image was used as a single band to visually extract linear feature while Principal Component Analysis (PCA) technique was employed in generating a multi-band enhanced image used to extract linear features. Four standard directional filters, Sobel (NS, EW, NW_SE and NE_SW) were further applied to enhance visual interpretation. The result shows that the area was affected by both ductile and brittle deformations at a regional scale, at least two episodes of deformations. A first episode of deformation (D1) produced the NW - SE tight to isoclinal fold in style (F1) and a second episode of deformation (D2) which affected the axial trace of the first episode to produce a N - S gentle to open fold (F2). Furthermore, the result shows that spatial domain filtering significantly improves the amount of lineaments that can be mapped and single band analysis is a rather fast and cost effective method of lineament extraction.
Key words: Lineament mapping, directional filters, Ikare,
INTRODUCTION
The term lineament was originally defined by Hobbs (1904) as significant lines of landscape that reveal the hidden architecture of the rock basement. Lineaments are mapable linear surface features which differ distinctly from the patterns of adjacent features and presumably reflect subsurface phenomena (O’Leary et al., 1976).
They are generally manifested by topography (including straight stream segments), vegetation, or soil tonal alignments (Lattman and Parizek, 1964). Lineament mapping and analyses have gained popularity with the increasing availability of satellite and high-altitude aircraft images. The conclusion of Boyer and McQueen (1964) that remotely sensed linear features are largely a reflection of rock fractures, emphasized by vegetation and topography, has been evidenced by successful use of lineament analysis in exploration for oil and gas traps, and to select drilling locations for maximum porosity in tight formations (Peterson, 1980; Mah et al., 1995). The extraction of lineaments and lineament density assessment from satellite imagery contributed immensely to the delineation of fracture and fault zones in South India (Gurugnanam et al., 2014).
On the application of remote sensing and Geographic Information System (GIS) in mapping structural features in geology, a significant progress in the field of application of various geological themes such as mineral exploration, groundwater, geophysical investigations geo-hazards and geo-environment has been made. Suzen and Toprak (1998) investigated the probable contribution of different filtering techniques, particularly spatial domain filtering, when applied to different data sets in the generation of lineament maps for geological purpose. They concluded that the spatial domain filtering analysis with single band input seems to be the most cost effective and less time consuming method for regional lineament analysis.
Chan and Sousa (2002) carried out a regional analysis by remote sensing, using Landsat thematic mapper scenes for identification, extraction and delineation of regional and local lineaments in the Precambrian bedrock based on geomorphic and image tone evidences in North Brazil with the aim of using the method as a guide to interpret potential metallogenic targets areas in the State of Paraiba. They concluded that a large number of mineral bearing pegmatite of the region are controlled by major lineaments and associated minor lineaments.
Rajesh (2004) made an overview of the application of Remote Sensing and GIS in mineral resources mapping and concluded that GIS allows for more effective integration and analysis of large numbers of georeferenced spatial data with different attributes and formats. Furthermore, structural analysis of satellite imagery and aerial photographs can generate large population of interpreted linear features. This population can be reduced through lineament interpretation, based on the identification of features which are geologically significant, within a GIS; thus allowing the lineament vectors to be registered immediately (Haryono et al., 2016).
According to Frei et al. (2006), in Africa, remote sensing studies can contribute significantly to geological projects and to sustainable development of the continent. Vast regions in Africa are in need of basic topographic and geologic maps, and in many parts of the continent, remote sensing data are often the only available, most effective and efficient way for the extraction of new geological information.
From the foregoing review, it is obvious that a lot of work has been carried out variedly worldwide on the subject matter with a lot of interesting and positive results. Structural analyses are conducted on regional scales, to provide a comprehensive look at the extent of faults, lineaments and other structural features. Geologic features are typically large (kilometric scale) and applications therefore require small-scale imagery to cover the extent of the element of interest. The importance of regional lineament mapping and the applications within a GIS environment cannot be over-emphasized, yet regional lineament mapping on the scale at which this present work is focused has never been done in Ikare area. This work therefore aims at improving on the already mapped and documented different structural elements that are present in the study area. It is envisaged that the integrated results of this study will be used to produce an improved detailed structural map of the area. Furthermore, in-depth analysis of lineament feature of an area is the key to the correct location of borehole and availability of portable water.
Study area and geological setting
The Nigerian Basement lies to the south of the Tuareg shield. Evidence from the eastern and northern margins of the west African Cratons indicates that the Pan-African belt evolved by plate tectonic processes which involved the collision between the passive continental margin of the west African Craton (the Birrimia) and the active continental margin (Pharusian belt) of the Tuareg Shield (the Dahomea) about 600 Ma ago (Black et al., 1979; Caby et al., 1981). The collision at the plate margin is believed to have led to the reactivation of the internal region of the belt and the Nigerian Basement lies in the reactivated part of the belt (Ajibade et al., 1987). Nigeria is underlain in nearly equal proportions by both crystalline and sedimentary rocks. The crystalline rocks can be further subdivided into three groups:
i) The Basement complex,
ii) The Younger Granite and
iii) The Tertiary – Recent volcanic rocks.
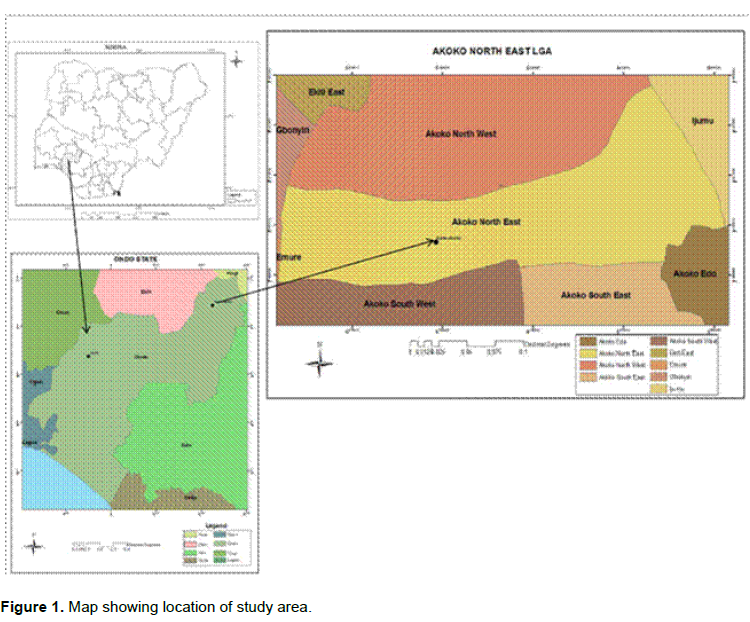
Ikare area and its environ lies within the boundaries of Ondo State, southwestern Nigeria (Figure 1). It is bounded by latitudes 7°25' N and 7°36' N and longitudes 5°35' E and 5°50' E. It covers a total surface area of about 400 km2. Main towns in the area are Akungba, Supare, Iwaro-Oka, Ogbagi, Arigidi, Boropa and Ugbe with Ikare town situated in the centre. The geology of the study area is shown on 1:250,000 published geological map, Akure sheet 61 to be underlain by undifferentiated migmatite-gneiss-quartzite complex (Dempster, 1966). Members of the migmatite–gneiss-quartzite complex (MGQC) form the most abundant rock group of the Nigerian Basement Complex and underlie approximately 30% of the total surface area of Nigeria (Rahaman 1988). Ikare area is underlain by the Migmatite gneiss- quartzite Complex (MGQC) which is a heterogeneous rock group made up of migmatitic and granitic gneisses; basic schists; relict metasedimentary calcareous, quartzitic and granulitic rocks. These groups of rocks account for well over 90% of the Basement Complex outcrop in Ikare area (Rahaman and Ocan, 1988). According to Rahaman and Ocan (1988), about four major rock units were recognized within this complex in Ikare area, these are: Quartzo-feldspathic gneisses, Pelitic gneisses, Basic and Ultrabasic rocks and the Felsic components.
The area of study is characterized by derived savannah vegetation. The valleys in the southwestern part of the area (between Supare and Akungba) are thickly vegetated. Shrubs and grasslands are also prominent vegetation types especially between Boropa and Arigidi areas. The dense network of footpaths shown on the topographic maps opened up the relatively difficult areas. The area has good rock exposures and some outcrops on some of the ridges can be traced over a distance of 1 km. Outcrops of 0.5 km by 1.0 km in the area are common, especially in and around Ikare town.
METHODOLOGY
Digital image analysis
The materials used for this study can be classified into two: Hardware and Software; hardware includes scanner, personal computers, GPS (Global Positioning System), topographic maps and geologic maps. The software used was mainly ILWIS (version 3.3 Academic) and ArcView GIS, version 3.2a. The topographic maps used consist of sheet 245 Ikole SW and Ikole SE at a scale of 1: 50,000 and sheet 265 Owo NE and Owo NW at a scale of 1: 50,000 while the geological map is Akure Sheet 61, 1: 250,000 series of the geological survey of Nigeria.
The radiometric characteristic of the satellite image Landsat ETM+ used is given in Table 1. It also has a swath width of 185 km and full scene coverage of (170 x 183) km.
Sources and methods of data collection
The main digital image Landsat ETM+ 2002 with six bands - Band 1 (0.45-0.52) um; Band 2 (0.53-0.61) um; Band 3 (0.63-0.69) um; Band 4 (0.76-0.90) um; Band 5 (0.55-0.75) um; Band 7 (2.08-2.32) um; which is the primary data, was acquired from Regional Centre for Training in Aerospace Survey (RECTAS) Library. Secondary data used consists of four topographic maps and a geological map obtained from the Department of Geology, Obafemi Awolowo University, Ile-Ife.
Data preparation
The digital image has been radiometrically and geometrically corrected and rectified before acquisition. The image has been georeferenced and resampled. The coordinate system used was Universal Traverse Mercator (UTM), covers Ikare and its environ and has the following characteristics;
Projection: Universal Traverse Mercator (UTM)
Datum: WGS 1984
Ellipsoid: WGS 84
Ellipsoid Parameter: a= 6378139.000, 1/f= 298.57222
Zone: 31
Before the analog topographic and geologic maps were scanned, grid lines were drawn on them manually to highlight the latitudes and longitudes on the maps for georeferencing purposes. The scanned maps were Ikole SE, Ikole SW, Owo NE, Owo NW and Akure sheet 61. The resultant maps were saved as tiff image and then imported to ILWIS environment for further processing.
Data extraction
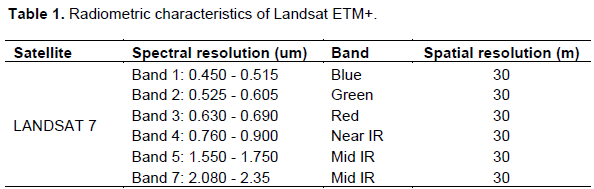
After importing the scanned tiff images of the four adjoining topomap sheets into ILWIS, latitude and longitude values of some ground control points were converted into UTM coordinates. At least 6 points were used to georeference each of the topomaps using four corner grid readings and two GPS reading. Georeference corners was created for each scanned map and then resampled. The final outputs are the resampled images which were finally glued together in ILWIS to produce a composite map named Ikare_Composite (Figure 2). The same approaches were followed to georeference and resample the Akure Geologic map.
Digitizing
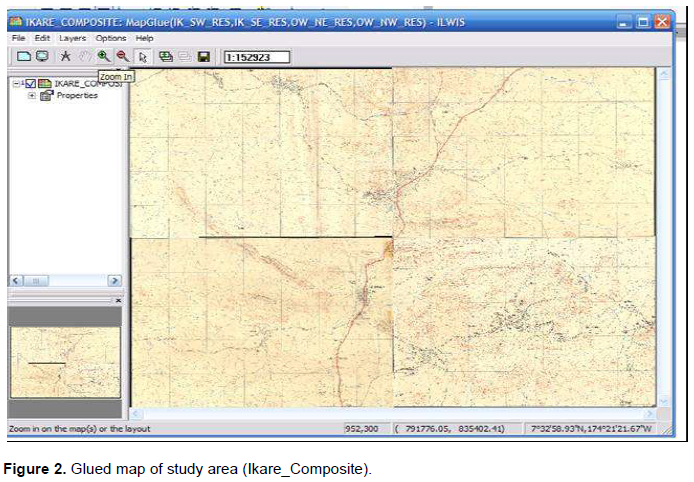
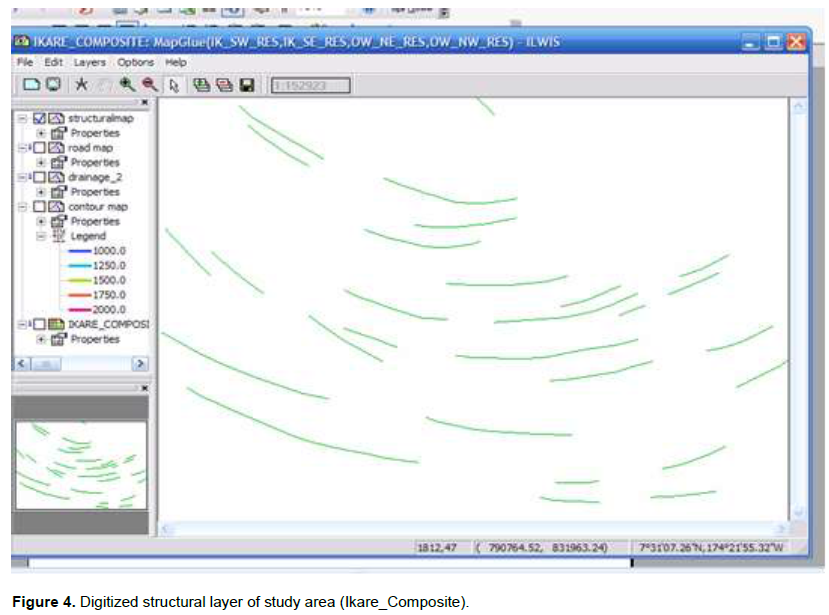
On-screen digitizing was done in ArcView environment. Layers created from Ikare_composite were drainage and structural geology layers. The layers were later imported back to ILWIS as shown in Figures 3 and 4.
Data processing
Option for digital image processing methods stems from two principal application areas: improvement of pictorial information for human interpretation, and processing of scene data for autonomous machine (computer) perception. Digital image processing may be explained as the manipulation (with the purpose of improving the pictorial qualities) and interpretation (that is, detection/identification of features and judging their significance) of digital images with the aid of digital computer.
Digital image processing
On the ETM+ satellite image, since it has undergone image restoration and rectification before acquiring it, image enhancement techniques such as linear contrast stretching and filtering were carried out in ILWIS. Linear contrast stretching was carried out on each of the six bands and a map list of the contrast stretch image was made (etm_1-7_stretch_sub). This maplist was used to produce a sub map of the area.
Single and multiband analysis
To achieve one of the aims of this study, lineament mapping was carried out on different data sets (single band and multiband). A linearly enhanced band 7 was used as a single band for lineament mapping. Band 7 of the ETM+ image was first spectrally enhanced by equalizing the histogram and thereafter, linear stretching was applied to the histogram. Band 7 was selected because of its greater wavelength in which the effect of moisture and contrast loss due to atmospheric haze is minimal.
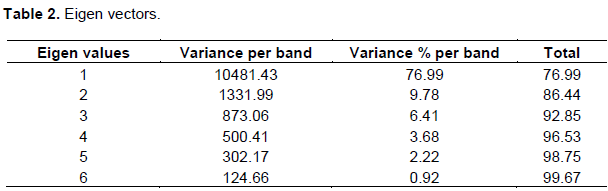
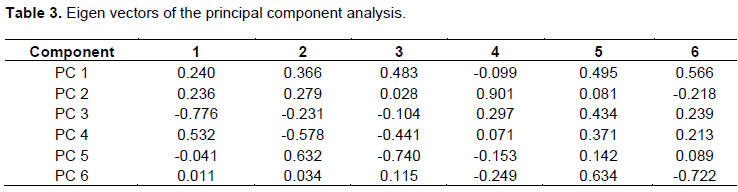
To improve the image further, a multiband enhancement was carried out on the maplist through principal component analysis (PCA). The principal component analysis was used in order to remove redundancy present in the six bands and also to achieve maximum information and minimum computation time. The input for Principal Component Analysis consists of a map list with raster maps from which the covariance matrix was calculated. The output of the principal component analysis operation include:
i) an output matrix denoting the transformation coefficients (calculated from the covariance matrix),
ii) an output map list containing the set of transformed raster maps (also called the components).
In the PCA, all the six Eigen values and Eigen vectors are calculated (Tables 2 and 3).
Colour composite
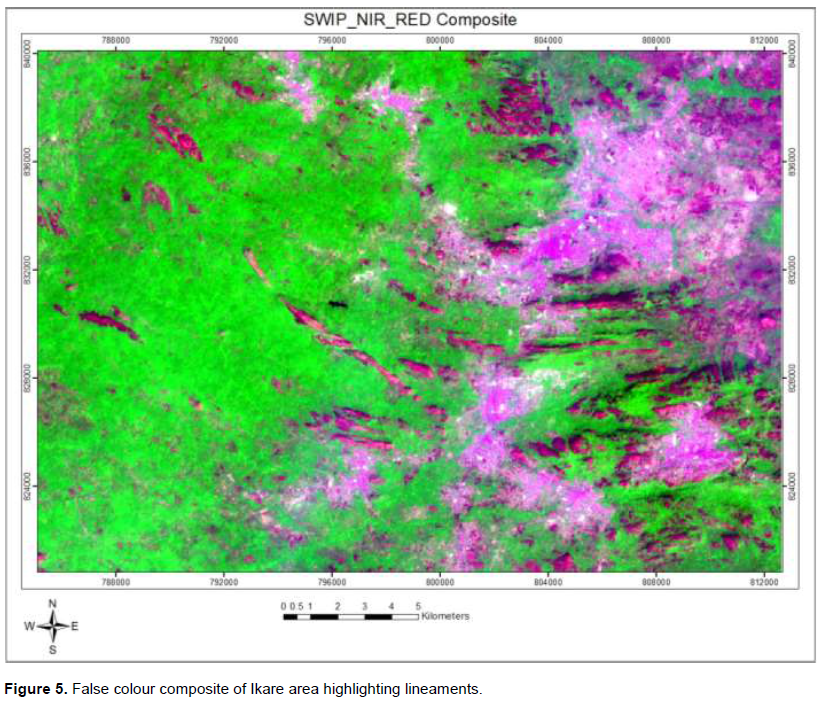
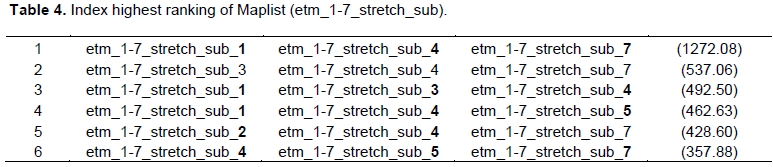
Rather than making hundreds of combinations from the different available bands, the Optimum Index factor (OIF) was calculated. The Optimum Index Factor (OIF) is a statistic value that can be used to select the optimum combination of three bands in a satellite image with which you want to create a colour composite (Figure 5). The optimum combination of bands out of all possible 3-band combinations is the one with the highest amount of information (= highest sum of standard deviations), with the least amount of duplication (lowest correlation among band pairs). As shown in Table 4, the best combination of bands is that of (1, 4 and 7).
Spatial domain filtering
After the visual interpretation and lineament derivations of the original band 7 and the PCA, further processing by filtering technique was carried out on the single band. The principal objective of enhancement technique is to process a given image so that the result is more suitable than the original image for a specific application. Since the main interest is to highlight linear features which are edges, the spatial domain method was adopted. The spatial domain refers to the aggregate of pixels composing an image and the methods are procedures that operate directly on these pixels. Spatial domain methods are applicable in both image smoothing and image sharpening.
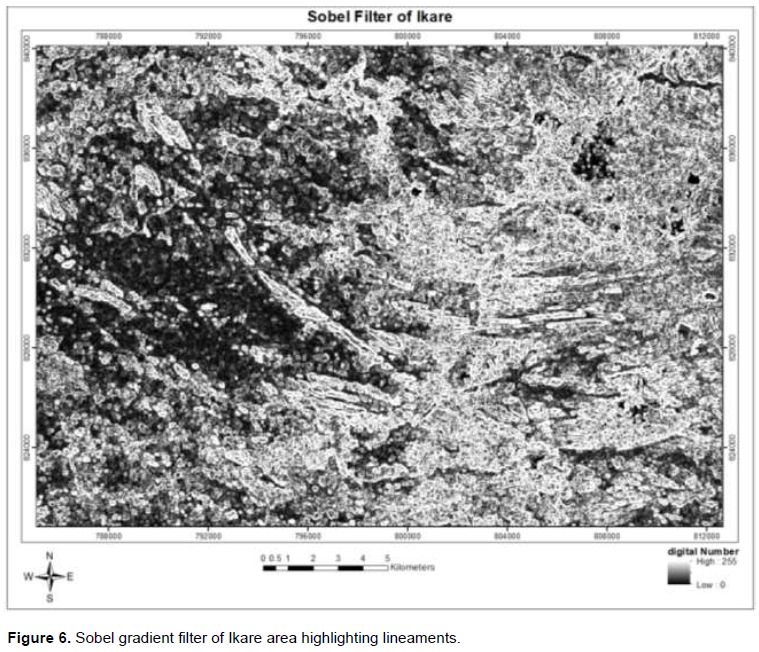
The specific application for this work is linear feature mapping. Smoothing operations were used primarily for diminishing spurious effects that may be present in a digital image as a result of a poor sampling system or transmission channels. On the other hand, sharpening techniques are useful primarily as enhancement tools for highlighting edges in an image. Gradient filters are normally used for sharpening images and four of the standard gradient filters in ILWIS which enhance linear features in different directions are therefore employed in this work. These are N-S, E-W, NE-SW and NW-SE. Because band 7 was selected earlier for given reasons and to also see the effect of filtering, the same band 7 was used for filtering as shown in Figure 6.
RESULTS AND DISCUSSION
One of the most important factors contributing to lineament and structural pattern of an area is the drainage pattern. Figure 3 shows the result of the drainage pattern analysis of the study area. It can be interpreted to be a combination of dendritic and rectangular (angular) drainage pattern. The large streams form a rectangular pattern, while the intervening blocks are dissected by insequent tributaries which constitute local or isolated dendritic patterns. The import of such drainage pattern is that it is structurally controlled. The major streams are running in an EW direction, this follows the general strike direction of the area which is NW SE.
The results of single band and multi-band lineament extractions and the subsequent application of filters in the spatial domain (high pass directional Filters) as presented were extracted manually through visual interpretation and digitizing drainage layers. Though there could be bias in manual interpretation of lineaments, it will also prevent unnecessary extraction of linear features such as roads and other man made features that are of no geological importance.
Lineament extraction from a multi-band image but with the principal component analysis calculated and lineaments from a linearly stretched single band image is presented in Figures 7 and 8 respectively. The statistics of the two analyses shows that the image with the principal component analysis is better enhanced for interpretation than the single band as shown in Table 5.
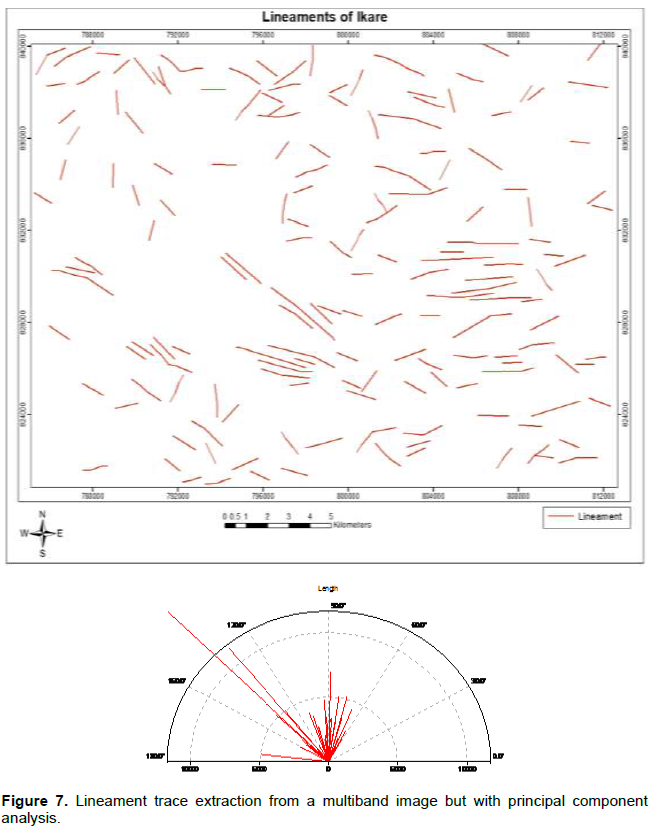

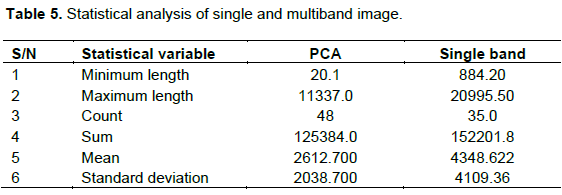
Though the lineaments in the PCA extraction appear shorter in length and discontinuous, they are more in numbers. A total of forty-eight (48) and thirty-five (35) linear features were picked multiband and single band respectively. The result of applying directional filters to further enhance the interpretation of the multi-band and single band images show that there is no significant change in the major trend direction of NW-SE but the frequency and the number of the lineaments extracted increased considerably.
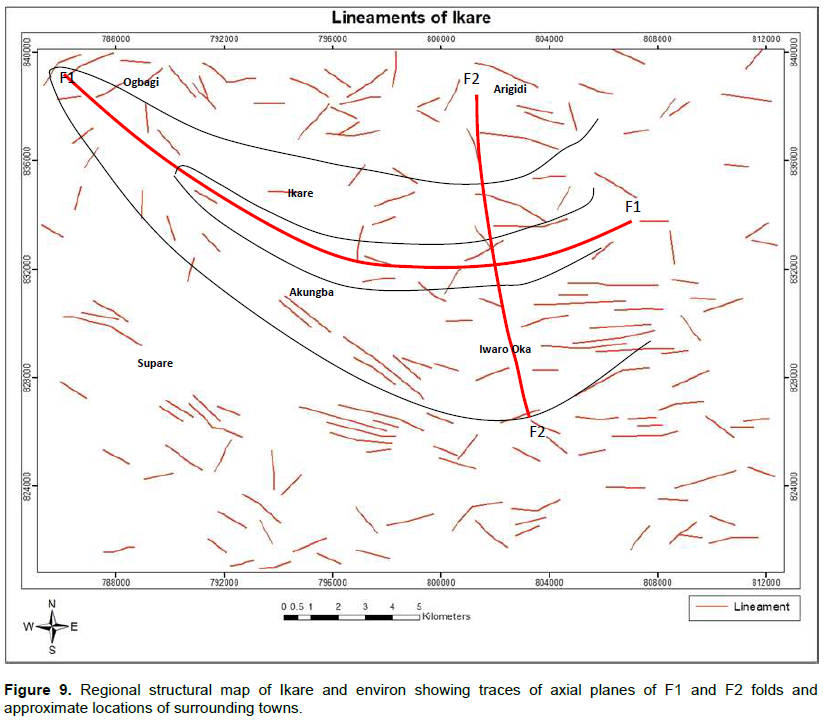
A synthesis of lineament mapping from all the filtered images from this study and lineament mapping from digitized previous geologic maps shows that the major trend of the linear feature are in the NW-SE direction. Also, it is evident that the area has been affected by both ductile and brittle deformation. Brittle deformation results in fracturing of rocks which may give rise to joints and faults. On the other hand, important effects of ductile deformation may give rise to folds and shear zones. Long trace of folded linear feature can be traced in the study area shown in Figure 9. The area must have experienced at least two episodes of deformation on a regional scale. The first episode of deformation (D1) produces the NW SE trending folds, which is tight to isoclinal in style. The second episode of deformation (D2) affected the axial trace (F1) of the first episode to produce an open to gentle fold with (F2) as the axial trace. This structural attitude of the study area is in consonance with the widely accepted theory of the tectonic history of the basement complex of Nigeria. Most often than not, it is rare to encounter the F1 fold in the field when mapping. It is either overprinted or too large in scale to be seen.
CONCLUSION
This work is aimed at contributing to the proper understanding of the tectonic history of the area of study. It also aimed at single and multi-band analysis of satellite imagery with a view to know the effect of filtering technique, especially in the spatial filtering domain.
Results from this study have shown that Ikare area has undergone at least two stages of regional deformation. The first deformation D1 produced the tight isoclinals fold which is axial planar to the second episode of deformation D2 that produce a gentle to open fold with an almost NS axial plane. Terrain analysis of the area also showed that as movement up the north shows increase in topographic elevation of the area. Three levels of classification based on the elevation of the area is proposed, lowland or flood plains followed by plateau, high plateau, high mountain and very high mountain. Furthermore, spatial domain filtering analysis with single band seems to be time saving and cost effective method of lineament extraction.
In conclusion, result from this work has improved on the already published geological map of the area in terms of regional structural analysis. The lineaments traced show a quite similar pattern compare to the published data of the area. However, in terms of total number and length, the traceable lineaments are much greater than already published data. This work has also demonstrated the efficacy of directional filters to improve visualization of lineament mapping.
CONFLICT OF INTERESTS
The authors have not declared any conflict of interests.
REFERENCES
|
Ajibade AC, Woakes M, Rahaman MA (1987). Proterozoic crustal development in the Precambrian regime of Nigeria. In: Kroner, A. (ed.), Proterozoic Lithospheric Evolution. Geodynamic Series 17. American Geophysical Union pp. 259-271. |
|
|
Black R, Ba H, Ball E, Bertrand JM, Boullier AM, Caby R, Davidson I, Fabre J, Leblanc M, Wright LI (1979). Outline of Pan-African geology of Adrar des Iforas (Republic Of Mali) Geologische Rundschau, 68(2):543-564. |
|
|
Boyer R, McQueen J (1964). Comparison of mapped rock fractures and air photo linear features. Photogrammetric Engineering and Remote Sensing 30(4):630-635. |
|
|
Caby R, Bertrand JM, Black R (1981). Pan-African Closure and Continental Collision in the Hoggar-Iforas Segment, Central Sahara, In: Krooner, A. (Ed.), Precambrian Plate Tectonics. Elsevier pp. 407-434. |
|
|
Chan CL Sousa Jr, MdA (2002). Regional Structural Analysis by Remote Sensing for Mineral Exploration, Paraiba State, Northeast Brazil. Geocarto International 15(1):70-77. |
|
|
Dempster AN (1966). 1:250,000 Nigerian Geologic Survey. Sheet 61 Akure. G.S.N. |
|
|
Frei M, Abdel Salam MG, Baghdadi NN (2006). Remote Sensing Application to Geological Problems in Africa. Journal of African Earth Sciences 44(2):7-10. |
|
|
Gurugnanam B, Suaresh M, Kalaivanan K (2014). Extraction of Lineament and Lineament Density Assessment from Satellite Data in Kollo hill, Tamil Nadu, South India. International Journal of Scientific Research 15(7):1365-1367. |
|
|
Haryono E, Widartono BS, Lukito H, Kusumayuda SB (2016). A Comparison of lineament and fracture trace extraction from Landsat ETM+ panchromatic band and panchromatic aerial photograph in Gunungsewu Karst area, Java-Indonesia. IOP Conference Series: Earth and Environmental Science 47 012026 |
|
|
Hobbs WH (1904). Lineaments of the Atlantic border region. Geological Society of America Bulletin 15:483-506. |
|
|
Lattman LH, Parizek RR (1964). Relationship between fracture traces and the occurrence of groundwater in carbonate rocks. Journal of Hydrology 2:73-91. |
|
|
Mah A, Taylor GR, Lennox P, Balia L (1995). Lineament analysis of Landsat Thematic Mapper Images, Northern Territory, Australia. Photogrammetric Engineering and Remote Sensing 61:761-773. |
|
|
O'Leary DW, Freidman JD, John HA (1976). Lineament, linear, lineation: Some proposed new definitions for old terms. Geological Society of America Bulletin 87:1463-1469. |
|
|
Peterson R (1980). Lineament analysis for oil and gas exploration and production in Wyoming. AAPG Bulletin 64:764. |
|
|
Rahaman MA (1988). Recent advances in the study of the basement complex of Nigeria. In: PO Oluyide, WC Mbonu, AE Ogezi, IG Egbuniwe, AC Ajibade, AC Umeji (eds.). Precambrian Geology of Nigeria. Geological Survey of Nigeria, Kaduna pp. 11- 41. |
|
|
Rahaman MA, Ocan OO (1988). Nature of granulite facies metamorphism in Ikare area, southwestern Nigeria. In: Oluyide PO, Mbonu WC, Ogezi AE, Egbuniwe IG, Ajibade AC Umeji AC (eds), Precambrian Geology of Nigeria, Geological Survey of Nigeria pp. 157-163. |
|
|
Rajesh HM (2004). Application of remote sensing and GIS in mineral resource mapping. Journal of Mineralogical and Petrological Sciences 99:83-103. |
|
|
Suzen ML, Toprak V (1998). Filtering of satellite images in geological lineament analyses: an application to fault zone in turkey. International Journal of Remote Sensing 19(6):1101-1114. |
|
Copyright © 2024 Author(s) retain the copyright of this article.
This article is published under the terms of the Creative Commons Attribution License 4.0


