ABSTRACT
The high resolution aeromagnetic data over part of middle Benue trough was interpreted quantitatively using Spectral depth analysis and Source Parameter Imaging (SPI) of the magnetic source rocks to determine the sedimentary thickness for hydrocarbon maturation and accumulation. The study area is bounded with longitudes 09°00′ - 10°00E and Latitudes 08°30′ - 09°30′N with an estimated total area of 12,100 km2. The regional/residual separation was carried out using polynomial fitting with order one. The pre-process grids dx, dy and dz from residual grid was used as an input grid to calculate the source parameter imaging. The same residual map was subdivided into nine blocks for spectral analysis. The result from source parameter imaging reveals maximum sedimentary thickness of 2.21 km at the extreme southern part of the study area which corresponds to part of Kwolla and Shendam. Minimum depth of 0.05 km is obtained at the northwestern part of the study area which corresponds to Pankshin. The result from spectral analysis also shows similar maximum depth of 2.54 km in the same area as SPI and minimum depth of 0.51 km area as SPI and minimum depth of 0.51 km. Since the sedimentary thickness of 3.0 km and above is only sufficient for hydrocarbon maturation and accumulation, then the result from this present study might not be sufficient enough for hydrocarbon maturation and accumulation but might be good for hydrocarbon gas accumulation.
Key words: Aeromagnetic data, hydrocarbon, maturation, polynomial fitting, spectral analysis.
Recent interest in the inland basins in Nigeria for petroleum and mineral deposits necessitated the need to study one of the prominent basins which has received little attention from researchers, for some time now. Exploration work has been going on in the inland basins of Nigeria with the aim of expanding the national exploration and production base; thereby adding to the proven reserves asset, even though it has been frustrated because of the poor knowledge of their geology. In view of increased efforts to explore for new reserve, the high resolution aeromagnetic data over part of Middle Benue Trough was used to evaluate the depth to magnetic basement in the study area for possible hydrocarbon accumulation. This present study is based on reconnaissance survey and two depth estimating methods were adopted to determine the sedimentary thickness over part of middle Benue Trough for possible hydrocarbon potential in the area. The methods are source parameter imaging and spectral depth analysis. The results from these two methods, that is, source parameter imaging and spectral depth analysis would be used to suggest areas with the presence of hydrocarbon potential.
Location and geology of study area
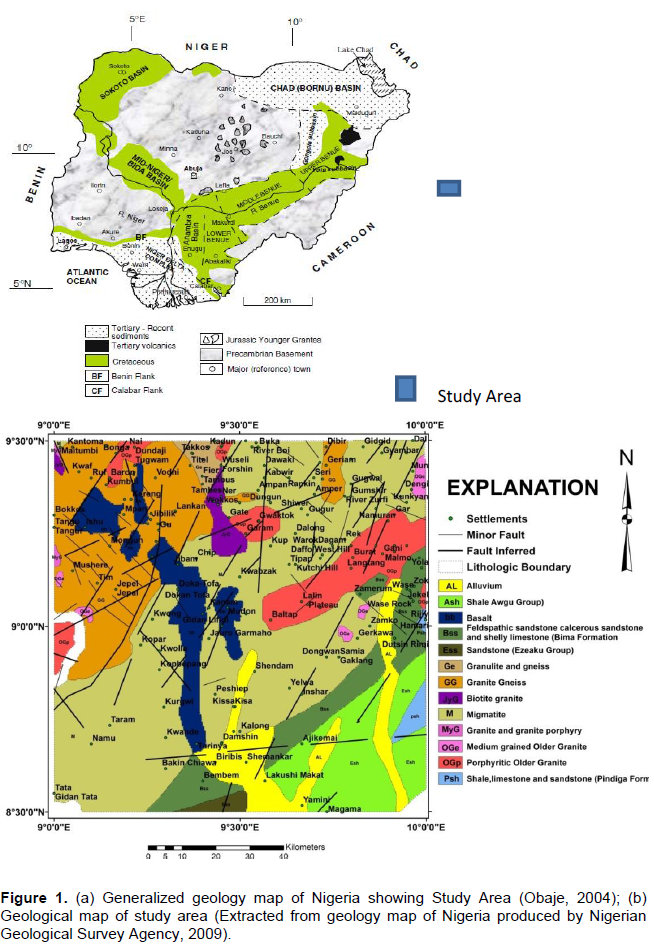
The study area is located in the Middle Benue Trough Nigeria and it lies within Latitude 08.50° N– 09.50° N and Longitudes 09.00° E and 10.0° E. Figure 1a shows the generalized geology map of Nigeria showing the study Area (Obaje, 2004). The tectonic evolution of the Benue Trough originated from the separation of the African Continent from the South American Continent in the Aptian (Grant, 1970). This separation led to the development of the triple junction (RRF) characterized by South Atlantic Margin, the Gulf of Guinea, and the Benue Trough. Benue Trough failed to develop into rift thereby creating an aulacogen (Olade, 1975). The Benue Trough is part of the long stretch arm of the Central African rift system originating from the early Cretaceous rifting of the Central West African basement uplift (Samuel et al., 2011). The trough has been categorized into three different zones and they are the Lower Benue Trough at the southern part, the Middle Benue Trough at the center, and the Upper Benue Trough at the Northern part. The geology of the Middle Benue Trough is characterized by the presence of thick sedimentary cover of varied composition whose age ranges from Albian to Maastrichtian (Obaje, 2004). The Asu-River Group of marine origin is the oldest deposited sediment in this area followed by Ezeaku Formation, keana/Awe Formation, Awgu Formation and Lafia Sandstone which is the youngest sediment (Obaje, 2004). More on this geology could be found in the work of Cratchley and Jones (1965), Burke et al. (1972), Offodile (1976), Osazuwa et al. (1981), and Offoegbu (1985). Figure 1b shows the geological map of the study area (extracted from geology map of Nigeria, produced by the Nigeria Geological Survey Agency 2009).
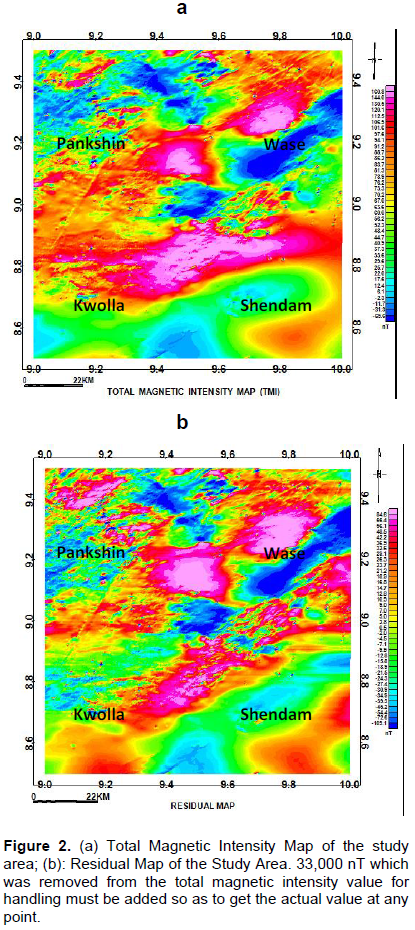
Four high resolution aeromagnetic maps (HRAM) with sheet numbers 191, 192, 221, and 212 and their respective locations Pankshin, Wase, Kwolla, and Shendam were acquired, assembled and interpreted. These maps were obtained as part of the nationwide airborne survey carried out by Furo and sponsored by the Nigerian Geological Survey Agency in the year 2009. The data were obtained at an altitude of 100 m along a flight line spacing of 500 m oriented in NW-SE and a tie line spacing of 2000 m. The maps are on a scale of 1:100,000 and half-degree sheets contoured mostly at 10 nT intervals. The geomagnetic gradient was removed from the data using the International geomagnetic Reference Field (IGRF). The total area covered was about 12,100 km2. The actual magnetic intensity value of 33,000 nT which was reduced for handling purpose must be added so as to get the actual value of the magnetic intensity at any point. This dataset are intensive, detailed and significant for the objectives of this research work because it has eliminated many errors usually associated with the old data sets of 1970s.
The first step taken was to assemble the four maps covering the study area which was in different sheets and the next step was to re-gridded the maps using Oasis Montaj software to produce the total magnetic intensity map (TMI) of the study area (Figure 2a). The TMI was subjected to regional/residual separation using polynomial fitting with order one. The residual map (Figure 2b) shows both positive and negative magnetic intensity values and it ranges from -109.1 to 84.6 nT.
Estimation of depth to magnetic source using SPITM
Theory and result
Thurston and Smith (1997), developed source parameter imaging and used it to estimate the depth from the local wavenumber of the analytical signal. The depth is displayed as an image which makes it better than other depth estimating methods. The SPITM method (Thurston and Smith, 1997) works for two models: a dipping thin dike and a sloping contact. The local wavenumber has maxima located over isolated contacts and depths can be estimated without assumptions about the thickness of the source bodies. Solution grids using the SPI technique show the edge locations, depths, dips, and susceptibility contrasts.
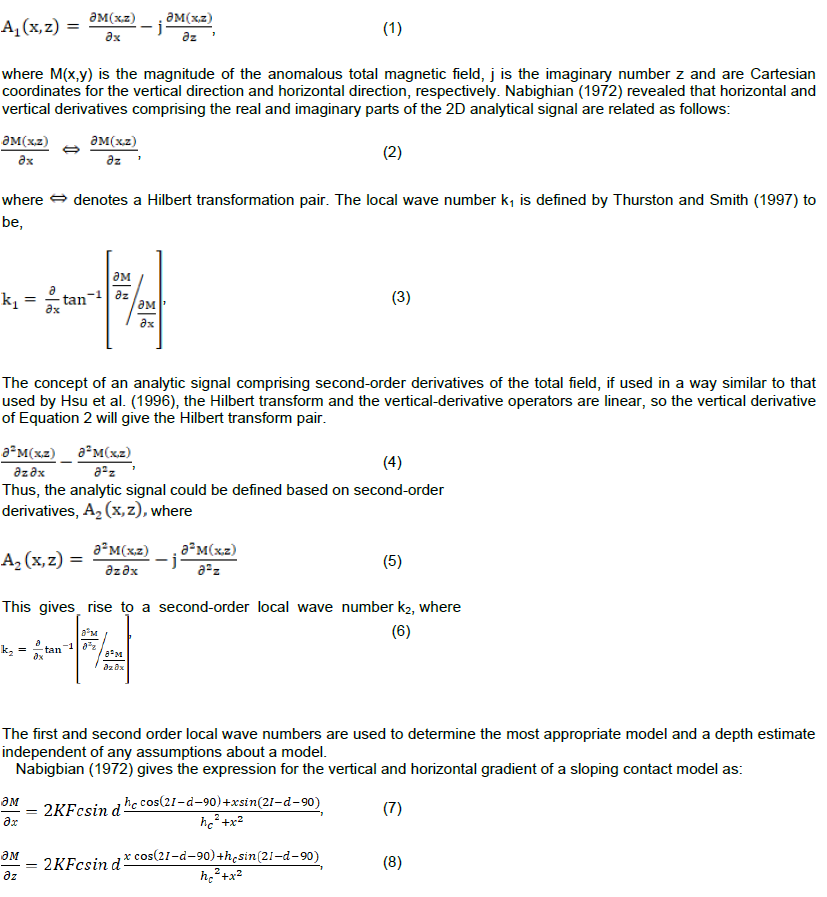
The analytical signal A1(x, z) is defined by Nabighian (1972) as:
where K is the susceptibility contrast at the contact, F is the magnitude of the earth’s magnetic field (the inducing field), , is the angle between the positive x-axis and magnetic north, i is the ambient-field inclination, d is the dip (measured from the positive x-axis), hc is the depth to the top of the contact and all trigonometric arguments are in degrees. The coordinate system has been defined such that the origin of the profile line (x = 0) is directly over the edge.
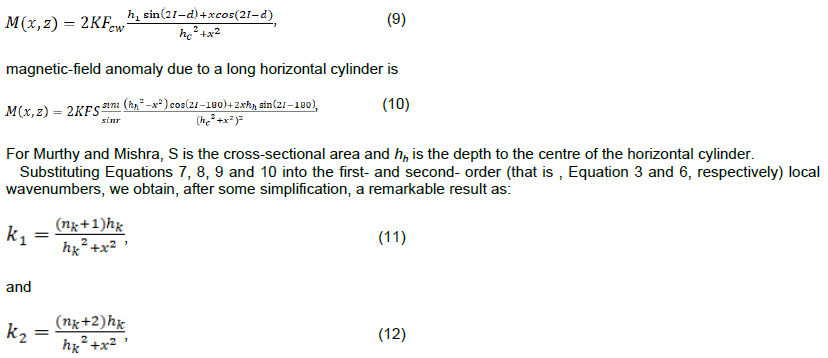
The expression for the magnetic-field anomaly due to a dipping thin sheet is Reford (1964), where w is the thickness and h1 the depth to the top of the thin sheet. The expression for the
where is the SPI structural index (subscript k = c, t or h) and nc =0 nt = 1 and nh = 2 for the contact, thin sheet and horizontal cylinder models, respectively. From Equations 14 and 15, it is evident that the first- and second-order local wave number are independent of the susceptibility contrast, the dip of the source and the inclination, declination, and the strength of the earth’s magnetic field.
Estimation of depth to magnetic source using spectral analysis
The statistical spectral analysis of the residual field data was used to determine the depths to the buried magnetic sources within the subsurface of the study area. Spector and Grant (1970) developed a 2-D spectral depth determination method (Salako and Udensi, 2013). Their model assumes that an uncorrelated distribution of magnetic sources exists at a number of depth intervals in a geologic column. The Fourier transform of the potential field due to a prismatic body has a broad spectrum whose peak location is a function of the depth to the top and bottom surfaces and whose amplitude is determined by its density or magnetization (Salako and Udensi, 2013).
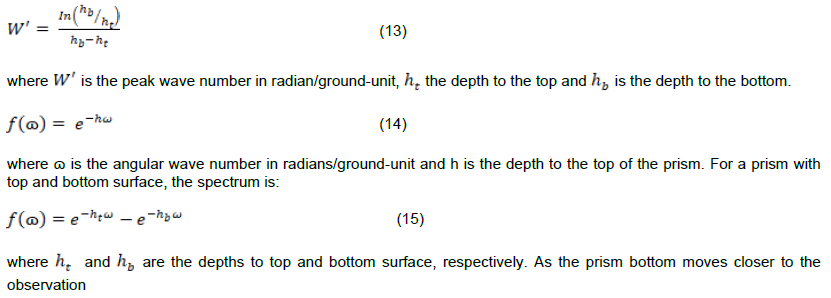
The peak wave number ( ) can be related to the geometry of the body according to the following expression.
point at surface, the peak moves to a higher wave number. When looking at the spectrum, it is important to note that the amplitude of a deep prism does not exceed the amplitude of the same prism at shallow depth at any wavenumber. The effect of increasing the depth is to shift the peak to lower wavenumbers.
Because of this characteristic, there is no way to separate the effect of deep sources from shallow sources of the same type by using wavenumber filters. The sources can only be distinguished if the deep sources have greater amplitude or if the shallow sources have less depth extent. When considering a line that is long enough to include many sources, the log spectrum of this data can be used to determine the depth to the top of a statistical ensemble of sources using the relationship.
where h is the depth in ground-units and k is the wavenumber in cycles/ground-unit. The depth of an ‘ensemble’ of source can be determined by measuring the slope of the energy (power) spectrum and dividing by 4 . A typical energy spectrum for magnetic data may exhibit three parts: a deep source component, a shallow source component, and a noise component.
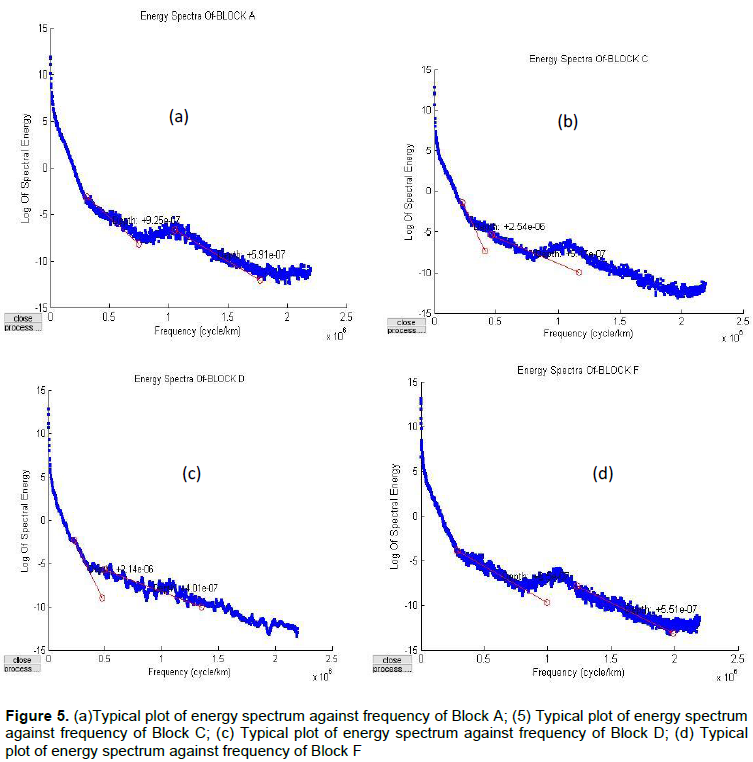
In this study, the graph of each energy spectral was obtained with Matlab software purposely designed to accept the longitude and latitude values alongside with its respective magnetic values for each of the nine spectral blocks label (A –I) where the log of spectral energy plotted against frequency.
The pre-processed grids horizontal derivative in x-direction (dx), horizontal derivative in y-direction (dy) and first vertical derivative (dz) from residual grid was used as an input grid to calculate the source parameter imaging (Figure 3). This process was carried out using the algorithm in the Oasis Montaj software. SPI method makes the task of interpreting magnetic data significantly easier as shown by the SP images generated from residual field data of the studied area (Figure 3)
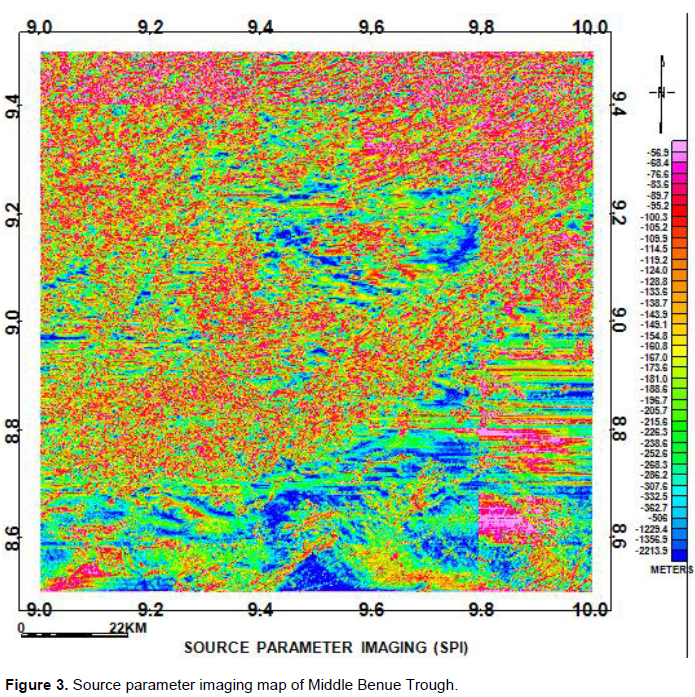
The colour legend in Figure 3 shows varied colours that represent the depth estimates to magnetic source rock/body within the study area, and could also portray the undulations in the basement surface. The negatives in the numbers on the legend signify depth. The light blue to deep blue colours at the end of the legends shows areas of highest sediments or deep lying magnetic bodies. The upper colours (purple and orange) at the other end of the SPI legends show areas of shallower sediment or near surface lying magnetic bodies.
The result of source parameter imaging of the aeromagnetic data of the study area revealed maximum depth (deep blue coloured) of 2.21 km which can be found at the extreme southern part of the study area which corresponds to part of Kwolla and Shendam, while the minimum depth (pink colour) of 0.056 km could also be found at extreme northeastern and northwestern part of the study area which also correspond to Pankshin and Wase. The deep blue colour represents areas with deep lying magnetic bodies hence with highest sedimentary cover of depth of 2.21 km could be viewed as the magnetic basement depth of the studied area which might probably enhanced hydrocarbon maturation and accumulation.
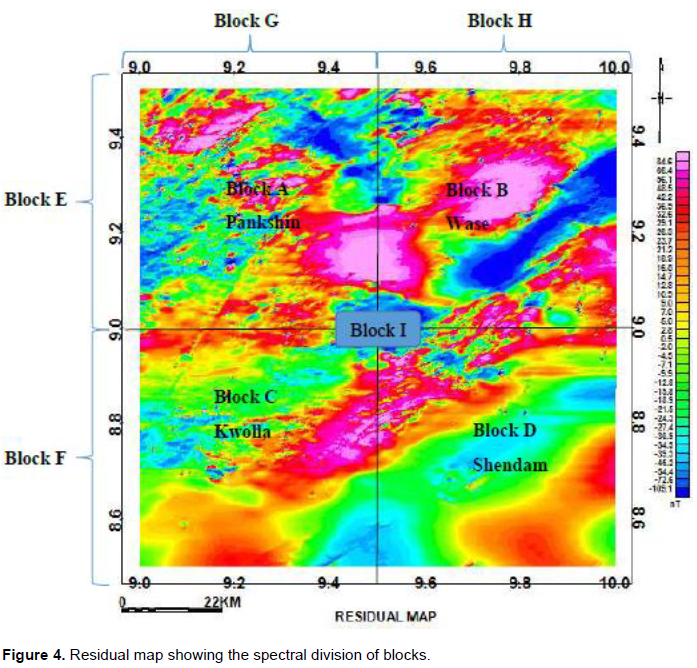
The residual map (Figure 4) produced from this study was also divided into nine 9 blocks (A-I) of overlapping
magnetic sections. Six of the divisions (Block A, Block B, Block C, and Block D) covered 3,025 km2 and three others (Block E, Block F, Block G, and Block H) covered 6,050 km2, while Block I covers the entire study area with total area of 12,100 km2. The division of residual map into nine spectral sections was done with Oasis Montaj and the spectral energies were plotted. The *.SPC file obtained were exported into Microsoft Excel worksheets one after the other until the total number of nine spectral (*.SPC) energy files were later used as an input file into a spectral program plot (SPP) developed with Matlab. The total numbers of nine spectral energies were plotted in Matlab with the developed program. A typical plot of energy against frequency (wavenumber) is as shown in Figure 5a to d.
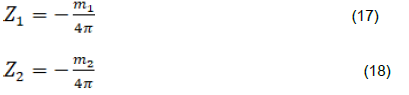
The program has been designed to determine the first and second magnetic source depth using the following equation:
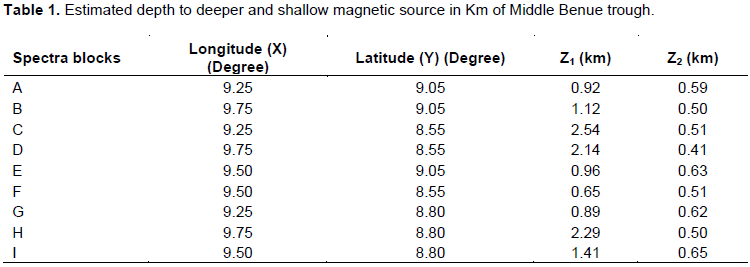
where m1 and m2 are slopes of the first and second segment of the plot, while Z1 and Z2 are first and second depths, respectively (Table 1).
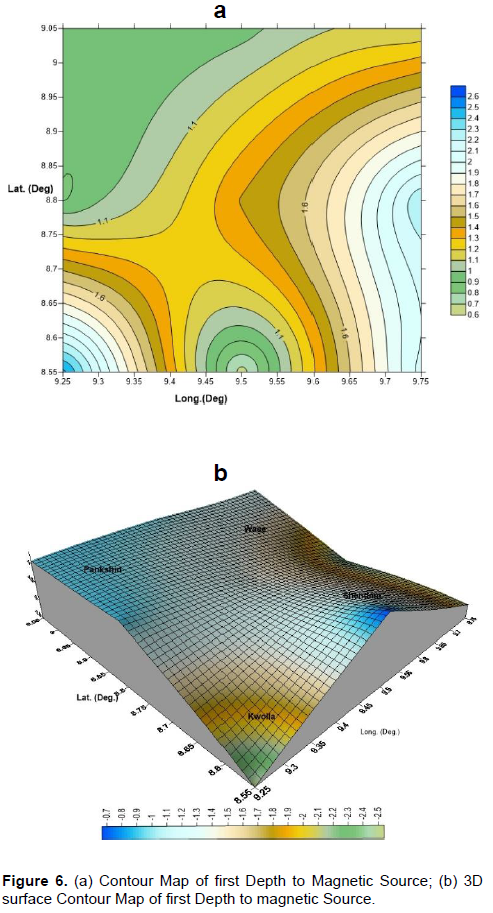
Figure 5a, b, c and d are the typical plots of spectrum energy against frequency and two layers can be observed with their respective depths and magnitude values. Figure 5b shows deeper depth of 2.54 km and agrees with the result of source parameter imaging with shallow depth of 0.51 km. Figure 5c also shows deeper depth of 2.14 km and shallow depth of 0.41 km. Figure 5a and d shows depths of 0.92 and 0.55 km, respectively. Table 1 shows the spectral blocks with respective longitude, latitude and depths. Figure 6a and b are the 6D surface contour map of depth to magnetic source and contour map of depth to magnetic source, respectively. The maximum sedimentary thickness 2.5 km is more pronounced at the extreme southwestern and southeastern part of the study area and this correspond
to part of Kwolla and Shendam town, respectively. The shallow depth is more pronounced at the northwestern part of the study area which corresponds to Pankshin.
With the availability of high resolution aeromagnetic data, the study of depth to magnetic source was carried out over part of Middle Benue Trough, Nigeria which has received little attention from researchers using both source parameter imaging and spectral analysis to determine the depth to magnetic source for hydrocarbon potential. The result of the two methods adopted in this study agrees with each other having maximum sedimentary thickness of 2.2 and 2.5 km, respectively and their areas where obtained are also agreed. Since the sufficient sedimentary thickness for hydrocarbon maturation is about 3 km and above, then the result from this study with maximum sedimentary thickness of 2.54 km, which is shallow and might not be sufficient enough for hydrocarbon maturation or accumulation.
The authors have not declared any conflict of interests.
REFERENCES
|
Burke KC, Dessauvagie TFJ, Whiteman AJ (1972). Geological history of the Benue valley and adjacent areas. Afr. Geol. 1(8):7-2.
|
|
|
|
Cratchley CR, Jones GP (1965). An interpretation of the geology and gravity anomalies of the Benue valley, Nigeria. Overseas Geological Surveys Geophysical paper 1:1-26.
|
|
|
|
Hsu, NC, Herman JR, Bhartia PK, Seftor CJ, Torres O, Thompson AM, Gleason JF, Eck TF, Holben BN (1996). Detection of biomass burning smoke from TOMS measurements. Geophys. Res. Lett. 23:745-748.
Crossref
|
|
|
|
Nwosu OB (2014). Determination of Magnetic Basement Depth over Parts of Middle Benue Trough By Source Parameter Imaging (SPI) Technique Using HRAM. Int. J. Sci. Technol. Res. 31:1-10.
|
|
|
|
Nabighian MN (1972). The analytic signal of two-dimensional magnetic bodies with polygonal cross-section -Its properties and use for automated anomaly interpretation: Geophysics 37:507-517.
Crossref
|
|
|
|
Obaje NG (2004). Geology and Mineral Resources of Nigeria. Springer-Verlag Berlin Heidelberg, P 219.
|
|
|
|
Offodile ME (1976). "The Geology of the Middle Benue Nigeria". Cretaceous Research, Paleontological Institute: University of Uppsala. Extra-ordinary Publication. 4:1-166.
|
|
|
|
Ofoegbu CO (1985). A review of the geology of the Benue Trough of the Nigeria. J. Afr. Sci. 3:285-291.
Crossref
|
|
|
|
Olade MA (1975). Evolution of Nigerian Benue trough (Aulacogen): A tectonic model Geol. Mag. 112:575-583.
Crossref
|
|
|
|
Osazuwa IB, Ajakaiye DE, Verheijen PJT (1981). Examination of the structure of part of the Upper Benue break valley on the premise of new geophysical information. Earth Evol. Sci. 2:126-135.
|
|
|
|
Reford MS (1964). Magnetic anomalies over thin sheets. Geophysics 29(4):532-536.
Crossref
|
|
|
|
Salako KA, Udensi EE (2013). Spectral Depth Analysis of part of upper Benue Trough and Bornu Basin, Northeast Nigeria, using Aeromagnetic data. Int. J. Sci. Res. 2(8).
|
|
|
|
Samuel OA, Olusola JO, Olabisi AA (2011). Stratigraphic Evolution and Petroleum Potential of Middle Cretaceous Sediments in the Lower and Middle Benue Trough, Nigeria: Insights from New Source Rock Facies Evaluation. Pet. Technol. Dev. J. 1:1595-9104.
|
|
|
|
Spector A, Grant FS (1970). Statistical models for interpretation of aeromagnetic data. Geophysics 35:293-302.
Crossref
|
|
|
|
Thurston JB, Smith RS (1997). Automatic conversion of magnetic data to depth, dip, and susceptibility contrast using the SPITM method. Geophysics 62:807-813.
Crossref
|