Full Length Research Paper
ABSTRACT
Daily fluid intake in individuals is known to be influenced by several factors such as climatic conditions, physical activities, nature of fluid and its availability, and behavioural responses. The high temperature of the tropics is expected to increase fluid intake, and more so for labor-intensive workers. The fluid intake of sedentary and manual workers in southeast Nigeria was assessed and compared with international benchmarks. A cross sectional study was conducted among 243 subjects from both groups. The subjects were assessed and data on socio-demographic variables, weight, height and 24 hour fluid intake documented. The fluid intake of the manual workers was significantly higher than that of sedentary workers. Higher proportions of manual workers met the fluid recommendations of WHO and the USA
Key words: Fluid intake, manual workers, sedentary workers, high temperature.
INTRODUCTION
Water is essential for life (Jéquier and Constant, 2010) and the average person loses about 2.5 litres of water daily from insensible water loss, bodily waste and sweating in normal, non- athletic activity (Grandjean, 2009). Increase in physical activities such as exercise or manual work and rises in temperature increases perspiration, leading to additional fluid loss. This is more so in sustained physical activities or hard exercises in hot environment (Maughan et al., 1997). Excessive loss of fluid from the body without commensurate replacement could lead to hypo-hydration with adverse effects on the body such as tiredness, fatigue, mood changes, heat injury, reduced levels of alertness and lapses in compliance to safety procedures (Cheuvront et al., 2005; Otani et al., 2006; Moyen et al., 2015; Hancock and Vasmatzidis, 2003; Clapp et al., 2002). As a result, maintenance of adequate fluid intake is advisory in exercise and in the workplace for better cognition and job performance. Different work environments demand variations in fluid intake. Warm work environments and strenuous activities greatly increase perspiration and the need for increased fluid intake. Sustained work in hot environments leads to substantial water and electrolyte loss. When such loss accounts for 2% of body weight it is associated with negative health effects and work performance (Maughan et al., 1997).
Estimating the water requirement of the body is a difficult task as a result of the complex nature of water metabolism. Several factors are put into consideration such as differences in body metabolism, availability of water, level of activity, ambient temperature, nature of the fluid etc (Institute of Medicine, 2005; Westrell et al., 2006; Grandjean et al., 2003; Grandjean et al., 2000).
The World Health Organization (WHO) recommends that under average conditions, a 70 kg adult male would requires 2.5 L of water per day, while a 58 kg adult female requires 2.2 L. Manual labour in high temperatures increases the requirements to 4.5 L of water per day for both men and women (Howard and Bartram, 2003).
Similarly, the United States Institute of Medicine (IOM) recommends 2.7 L/day for adult women and 3.7 L/day for adult men (Institute of Medicine, 2005; Drewnowski et al., 2013). Studies have been done in several countries to assess the fluid intake of different populations in their varying circumstances. The mean daily water intake of adult Australian males was 2.6±0.9 L while that of the females was 2.3±0.7 L. The majority of the adult Australian population failed to meet Adequate Intake values for total water intake (82%) and total fluids intake (78%) (Sui et al., 2016). In cross-sectional surveys among adults in 13 countries conducted, the mean daily fluid intake for males in some selected countries were Brazil, 2.34±1.16, France 1.55±0.66, UK 2.24±0.82, Germany 2.51±0.94, Turkey 2.15±1.01, China 1.78±0.95, Indonesia 2.33±1.08, and Japan 1.47±0.63. The female values for the countries were Brazil, 2.10±1.05, France 1.57±0.61, UK 2.37±0.88, Germany 2.45±0.90, Turkey 2.27±1.11, China 1.75±0.89, Indonesia 2.26±0.99, and Japan 1.52 ±0.65.
In summary, women complied with meeting the recommended standard water requirement than men with about 50% of them meeting the daily requirement while about 60 % of the men failed to meet standard recommendation. Out of the 13 countries studied, Germany and the UK were the countries with the highest percentages of the subjects meeting the targets while Japan had the lowest level of compliant subjects (Ferreira-Pêgo et al, 2015). The differences may be attributed to climatic conditions (temperature and humidity), adaption to environmental conditions (air-conditioned or heating rooms) and other social determinants of fluid intake (Malisova et al., 2013; Zazpe et al., 2014; Duffey and Popkin, 2006).
This study compared the fluid intake of sedentary and manual workers in Anambra State, Nigeria and the factors that influence them.
MATERIALS AND METHODS
Type of study
A cross sectional study was conducted in Anambra State to compare the fluid intake of sedentary and manual workers and the factors that influence it.
Study setting and population
The study was conducted in Nnewi North and Awka South Local Government Areas (LGAs) of Anambra State, Southeast Nigeria. The study was conducted between January and March 2018 during the hot dry season with high temperatures and moderate humidity (Awka Monthly Climate Averages, NG, 2018; Nnewi Monthly Climate Averages, NG, 2018).
The study population was drawn from the civil servants working in the State and Local Government secretariats and banks (sedentary workers), and motor mechanic workers (manual labour) in two selected towns in the State. The motor mechanics work with minimal equipment (non-mechanized) and therefore exert enormous physical efforts in the course of their work and also operate mostly in open spaces under the heat of the sun without shades except occasionally under tree covers or the shade/covers provided by the vehicles they are servicing. The civil servants and bankers were sedentary workers operating in government secretariats or banks whose duty schedules do not require strenuous physical activities. Their offices are either provided with electric fans or air conditioner.
The inclusion criteria for the study were civil servants and motor mechanic workers in the two cities who are willing to participate in the study, while the exclusion criteria were subjects that met the criteria above but have acute medical conditions at the time of the study, or absenting from normal physical activities or dietary restrictions e.g. fasting. The study was conducted during the week days to avoid drinking spree and festive activities associated with the weekends.
Required sample size was calculated by using the formula for cross sectional study for estimating a quantitative variable (mean value in this case) (Charan, 2013).
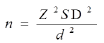
n = estimated sample size,
Z = Standard Normal Variate (at 5% type 1 error (P ≤ 0.05) is 1.96.
SD = Standard deviation (standard error) of variable = 19 (The mean total water intake from all source for US adult population is 3311±19 mL) (Perrier et al, 2015).
d = Absolute error or precision set for the study
The estimated sample size is 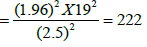
This is approximated to 250 subjects.
Sampling
A multi – stage sampling technique was used to select 250 subjects from the two sets of population in two selected towns (Awka and Nnewi) in Anambra State.
Civil servants from the State and Local Government secretariats were selected from the two towns while clusters of mechanic workshops from the two towns were selected and subsequently, subjects were selected from the mechanics in the chosen clusters.
The study instruments comprised semi-structured questionnaires (for socio-demographic data and fluid intake diary), weighing scale and standiometer (for weight and height measurements) and calibrated plastic cups (for fluid intake assessment). The research instrument was pretested among civil servants and manual workers in different districts from where the study was carried out (Anaocha LGA and Dunukofia LGA in Anambra State).
Data collection
The data collection process involved interviewer administered questionnaires on relevant socio-demographic, 24 h fluid intake diary, weight and height measurements. These were conducted by trained assistants (health workers) with the assistance of a seasoned nutritionist who provided guidance on assessment of fluid intake using calibrated plastic cups. Subjects were issued calibrated plastic cups, tutored on how to assess the quantities of water and other liquids they drank and subsequently provided information on their 24 h fluid intake. Data on the 24 h fluid intake were thereafter obtained from the subjects on the second day of the survey. The fluid assessed included – water, fruit/vegetable juice, milk, yoghurt, tea, coffee, alcohol, soft drinks, herbal drinks, energy drinks, pepper soups etc.
Data analysis
Data were analyzed using IBM Statistical Package for the Social Sciences (SPSS) software version 21. Descriptive statistical data (percentages, mean, median, standard deviations) were obtained for the independent and outcome variables. Requisite statistical tests (Chi Square {χ2}, Standard Normal Deviate {Z}) were conducted and statistical significance was set at p ≤ 0.05.
Comparisons of the fluid intake of the two sets of subjects was made as well as comparisons with values of WHO and USA IOM recommendations for 70 Kg adult males, 58 Kg adult females, on moderate activities and manual labour under high temperatures.
Ethical considerations
Ethical clearance was obtained from the Nnamdi Azikiwe University Teaching Hospital Ethical Committee (NAUTHEC). A verbal informed consent was obtained from the participants after a detailed explanation of the procedures involved.
RESULTS
Socio-demographic variables
Data for a total of two hundred and forty three subjects were analyzed out of the 250 assessed. These were made up of 130 sedentary and 113 manual workers. The mean age of the manual workers (artisans) was 31 ± 11.3 years while that of the sedentary (civil servants) was 41.6 ± 9.3. There were 112 males and 1 female artisans; 34 males and 96 females among the civil servants (Table 1).
Forty two (37.2 %) of the manual workers were married and 71 (62.8%) were single; while 94 (72.3%) of the sedentary workers (civil servants) were married, 32 (24.6%) were single and 4 (3.2%) were separated, divorced or widowed.
The educational statuses of the artisans were tertiary education 5.3% (6), secondary school leavers 57.5% (65), primary education 36.3% (41) and No Formal Education 0.9% (1). The educational statuses of the civil servants were primary 3.8% (5), secondary 20% (26), tertiary 76.2% (99) (Table 1).
Anthropometric parameters
The mean BMI of the manual workers was 25 ± 4.2 Kg/M2 while that of the sedentary workers was 27.6 ± 4.8 Kg/M2. There is statistical difference between the two values (Z= 4.506, p<0.05). Only 2 (1.8%) of the artisans were underweight (BMI less than 18.5 Kg/M2), 56.6% had normal BMI (18.5 – 24.9 Kg/M2), 27.4% were overweight (25-29.9 Kg/M2), 10.6% obesity class 1 (30 - 34.9 Kg/M2) and 3.5% obesity class 2 (35 – 39.9 Kg/M2).
For the sedentary workers, 1.5% were underweight (BMI less than 18.5 Kg/M2), 26.9% had normal BMI (18.5-24.9 Kg/M2), 42.3% were overweight (25-29.9 Kg/M2), 23.1% were obesity class 1 (30-34.9 Kg/M2) and 6.2% were obesity class 2. There is statistical difference between the BMI values of the sedentary workers and that of the manual workers (χ2 =24.449, df=6, p< 0.05) with the sedentary workers having higher proportion of obese people.
Total fluid intake
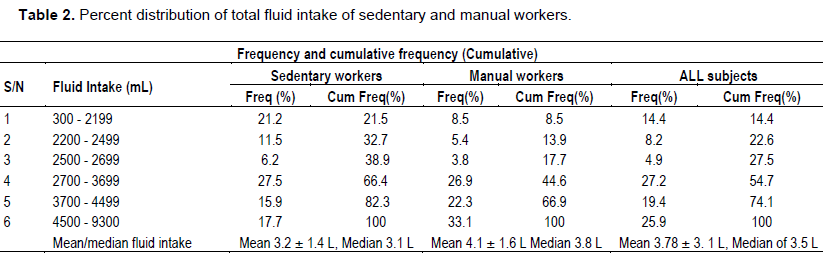
The ranges used in the fluid intake were taken to capture the various recommendations set by WHO and USA IOM for males and females in normal conditions and in high temperatures.
The mean total fluid intake recall (for 24 h) for the day before the survey was 3.46 ± 1.7 litres and a median of 3.2 L. The mean total fluid intake assessed for 24 h for all subjects following the provision of the calibrated cups was 3.78 ± 3. 1 litres with a median of 3.5 litres.
The mean total fluid intake recall of the manual workers (artisans) was 4.03 ± 1.8 litres and the median 3.8 L. The mean total fluid intake assessed for manual workers on day of survey using the calibrated cups was 4.1 ± 1.6 litres and median 3.8 (skewness 8.233 ±0.229, kurtosis 79-014 ± 0. 455). The data for the sedentary workers (government secretariat workers and bankers) showed the mean total fluid intake recall was 2.9 ± 1.5 and the median 2.8 L. The mean total fluid intake assessed using the calibrated cups was 3.2 ± 1.4 litres, median 3.1 L, (skewness 1.099 ± 0.218, kurtosis 2.535 ± 0.433). The fluid intake obtained based on the assessment of the fluid measured by the subjects using the calibrated cups is accepted as the most appropriate measure of fluid intake.
The fluid intake of the manual workers (4.1 ± 1.6 litres) was significantly higher than that of sedentary workers {(3.2 ± 1.4 litres), Z = 3.1431, P <0.05). Recognizing the differential in sex composition of the two groups, the fluid intake of males among the manual workers and that among the sedentary workers were compared. The results were still the same; the mean fluid intake of male manual workers was 4.1 ± 1.6 litres while that of the male sedentary workers was 3.2 ± 1.3 L which is statistically significant (Z =3.0532, p < 0.05) (Table 2).
Fluid intake of subjects according to recommended international standards for moderate activities and for manual labour in high temperatures
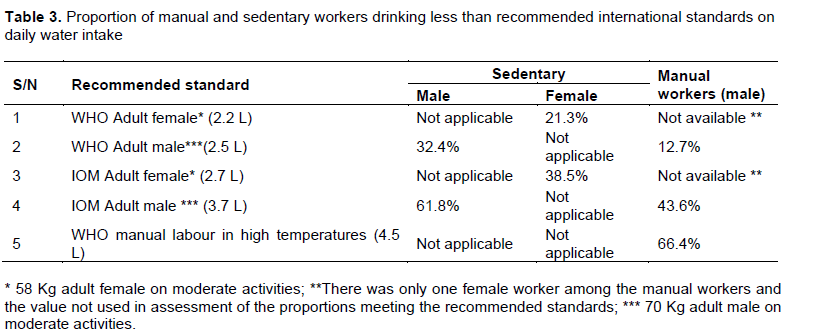
About 32% of the male sedentary workers drank less than the 2.5 litres recommended for adult males by the World Health Organization while 61.8% drank less than the recommendation of the USA Institute of Medicine (IOM) recommendation of 3.7 litres for adult males. The water consummation of the female sedentary workers was comparatively better than the male sedentary counterparts as lower proportion of them (21.3%) drank less than the WHO recommendation of 2.2 litres for adult females and 38.5% consumed less than the 2.7 litres for adult females as recommended by the USA IOM.
The water consumption of the manual workers was comparatively better than that of the sedentary workers. Almost all the manual subjects (87.3%) met the fluid recommendation of WHO for adult males with only 12.7% of them drinking less than the recommended value while 43.6% of them, ingested less than the 3.7 litres recommendation of the USA IOM for adult males.
Over 66% of the manual workers did not meet the daily water intake recommendation of WHO for manual workers operating in high temperatures. This implies that only about a third of them take water sufficiently for optimal body functions for manual subjects operating in high temperatures (Table 3).
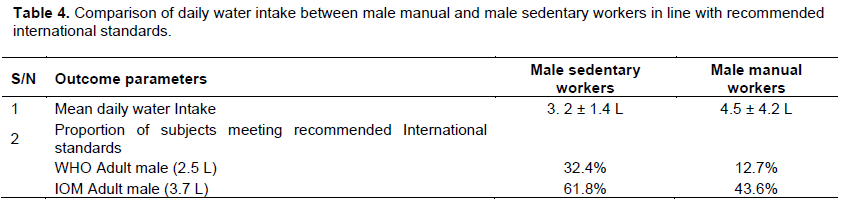
Comparing drinking patterns of male sedentary workers and male manual workers alone, the mean daily water drinking for sedentary workers was 3.2 ± 1.3 L, while that of the manual workers was 4.1 ± 1.6 L (Z = 2.723, p<0.05); this is statistically significant.
The two groups of workers fall short of the recommended international daily water intake. About 32% of the male sedentary workers were unable to meet the 2.5 L daily water intake recommended by the WHO for men on moderate activities; while it was only 12.7% of the male manual workers were unable to meet the set standard indicating that the male manual workers were more compliant in meeting the expected water recommendation than the sedentary group. Similarly, a higher proportion of the sedentary workers (61.8%) were unable to meet the IOM recommended 3.7 L daily water intake than the male manual workers (43.6%) (Table 4).
DISCUSSION
Though the age composition of the two sets of workers differed, they all fall within the working age population where drinking pattern is not grossly affected by age. Effect of age on water intake becomes pronounced in older adults (>65 years) (Rolls and Phillips, 1990; Phillips et al., 1984; Kenney and Chiu, 2001).
Since the manual workers were mostly males, the drinking pattern of the manual workers was compared with that of the male sedentary workers. The sedentary workers were engaged in white collar jobs with higher proportion of them having higher levels of education than the manual workers. The increased educational status is expected to enhance their knowledge, and disposition to health issues including water drinking. Expectedly, the mean water intake of the manual workers (4.1 ± 1.6 litres) was significantly more than that of the sedentary workers (3.2 ± 1.3 litres (Z = 2.723, p<0.05). Intense physical activities associated with manual labour result in increased body demand for water intake (Maughan et al., 1997). This is needed to make for replacement in fluid loss from sweating, evaporation and increased body metabolism (Drewnowski et al., 2013; Lawrence et al., 2014; Grandjean, 2009).
Comparisons of the water intake of the two groups with international standards show that 32% of male sedentary workers drank less than the 2.5 L recommended by the World Health Organization and 61.8% drank less than the value of 3.7 L recommended by the IOM (Howard and Bartram, 2003; Institute of Medicine, 2005; Drewnowski et al., 2013).
Other studies have also reported that populations across many countries of the world drank less than the recommended daily water intake (Sui et al., 2016; Ferreira-Pêgo et al., 2015).
The female sedentary workers fared better with 21.3% failing to meet the WHO standard and 38.5% taking less than the IOM value in contrast to the male sedentary workers who had 32% of subjects failing to meet the 2.5 litres recommended for adult males by the World Health Organization and 61.8% falling short of the recommendation of the USA Institute of Medicine (IOM) recommendation of 3.7 litres for adult males. This finding is similar to the Australian study and the multi-country cross sectional study in 13 countries which showed that females fared better than males in meeting the daily drinking water recommendations (Sui et al., 2016; Ferreira-Pêgo et al., 2015). Conversely, only 12.7% of the manual workers drank less than the WHO standard while 43.6% drank less than the IOM recommendation. However, when the manual workers are assessed based on the WHO recommendations of 4.5 L daily for persons engaged in manual labour in high temperatures (which is a better reflection of the working environment of the manual workers), as much as 66.4% failed to meet the recommended values. The daily temperatures of the study area during the morning and afternoon at the time of the study were about 33 to 36°C. The manual workers worked mostly outdoors with little or no shade covering them, except possible from that of the vehicle they are working on or rarely from that of a tree in the vicinity of the worksite.
Comparisons with other studies
Obviously the study population fared badly in meeting the water intake recommendations of both the WHO and the
The proportion of the manual workers in our study who failed to meet the recommendations of IOM for adult males in temperate climate is close to half (43.6%) while two third (66.4%) failed to meet the WHO recommendations of 4.5 L for manual workers in high temperatures. This shows that large proportions of persons in the study area take inadequate quantities of water and operate in state of hypo-hydration. Though acclimatization process may take place enabling them to adjust in their water intake, this could also have several effects on job performance and on health (Maughan et al., 1997; Sawka and Pandolf, 1990; Cheuvront et al., 2003; Cheuvront et al., 2005; Kenefick et al., 2004; Cian et al., 2001, 2000; Manz et al., 2005; Venugopal et al., 2015; Kenefick and Sawka, 2007; Lang et al., 2017).
The daily fluid intake among sedentary and manual workers was inadequate though the manual workers fared better than the sedentary. Though studies in other countries have also shown deficiencies in populations meeting internally recommended standards its occurrence in workers operating in high temperatures of the tropics and its possible effects on body performance and health is of great concern. Further studies on this are necessary and call for enlightenment for adequate water intake is expedient for the overall health of the public.
CONFLICT OF INTERESTS
The author has not declared any conflict of interests.
ACKNOWLEDGEMENTS
The authors acknowledge the sacrifices of the resident doctors of the Department of Community Medicine, Nnamdi Azikiwe Uniersity Teaching Hospital Nnewi, the Motor Mechanic Association, the staff of the Anambra State Ministries in the State Secretariat Awka, Staff of Commercial banks in Nnewi and the Nnewi North Local Government for their collaboration in the conduct of the study.
REFERENCES
|
Awka Monthly Climate Averages, Anambra, NG (2018). |
|
|
Charan J, Biswas T (2013). How to calculate sample size for different study designs in medical research? Indian journal of psychological medicine 35(2):121-126. |
|
|
Cheuvront SN, Carter IIIR, Castellani JW, Sawka MN (2005). Hypohydration impairs endurance exercise performance in temperate but not cold air. Journal of Applied Physiology 99(5):1972-1976. |
|
|
Cheuvront SN, CARTER 3rd, R, Sawka MN (2003). Fluid balance and endurance exercise performance. Current sports medicine reports 2(4):202-208. |
|
|
Cheuvront SN, Carter R, Castellani JW, Sawka MN (2005). Hypohydration impairs endurance exercise performance in temperate but not cold air. Journal of Applied Physiology 99:1972-1976. |
|
|
Cian C, Barraud PA, Melin B, Raphel C (2001). Effects of fluid ingestion on cognitive function after heat stress or exercise-induced dehydration. International Journal of Psychophysiology 42(3):243-251. |
|
|
Cian C, Koulmann PA, Barraud PA, Raphel C, Jimenez C, Melin B (2000). Influence of variations of body hydration on cognitive performance. Journal of Psychophysiology 14(1):29. |
|
|
Clapp AJ, Bishop PA, Smith JF, Lloyd LK, Wright KE (2002). A review of fluid replacement for workers in hot jobs. AIHA Journal 63(2):190-198. |
|
|
Drewnowski A, Rehm CD, Constant F (2013). Water and beverage consumption among adults in the United States: cross-sectional study using data from NHANES 2005-2010. BMC public health 13(1):1-9. |
|
|
Duffey KJ, Popkin BM (2006). Adults with healthier dietary patterns have healthier beverage patterns. The Journal of nutrition 136(11):2901-2907. |
|
|
Ferreira-Pêgo C, Guelinckx I, Moreno LA, Kavouras SA, Gandy J, Martinez H, Salas-Salvado J (2015). Total fluid intake and its determinants: cross-sectional surveys among adults in 13 countries worldwide. European journal of nutrition 54(2):35-43. |
|
|
Gazan R, Sondey J, Maillot M, Guelinckx I, Lluch A (2016). Drinking water intake is associated with higher diet quality among French adults. Nutrients 8(11):689. |
|
|
Grandjean AC (2009). Water requirements, impinging factors, and recommended intakes. The Centre for Human Nutrition, University of Nebraska Omaha, Nebraska- USA. 25 - 40. View. |
|
|
Grandjean AC, Reimers KJ, Bannick KE, Haven MC (2000). The effect of caffeinated, non-caffeinated, caloric and non-caloric beverages on hydration. Journal of the American College of Nutrition 19(5):591-600. |
|
|
Grandjean AC, Reimers KJ, Haven MC, Curtis GL (2003). The effect on hydration of two diets, one with and one without plain water. Journal of the American College of Nutrition 22(2):165-173. |
|
|
Hancock PA, Vasmatzidis I (2003). Effects of heat stress on cognitive performance: the current state of knowledge. International Journal of Hyperthermia 19(3):355-372. |
|
|
Howard G, Bartram J (2003). Domestic Water Quantity, Service, Level and Health. World Health Organization, Ref Type: Report. |
|
|
Iglesia I, Guelinckx I, De Miguel-Etayo PM, Gonzalez-Gil EM, Salas-Salvado J, Kavouras SA, Gandy J, Martinez H, Bardosono S, Abdollahi M, Nasseri E, Jarosz A, Ma G, Carmuega E, Thiebaut I, Moreno LA (2015). Total fluid intake of children and adolescents: cross-sectional surveys in 13 countries worldwide. European journal of nutrition 54(2):57-67. |
|
|
Institute of Medicine (2005). Dietary Reference Intakes for Water, Potassium, Sodium, Chloride, and Sulfate. National Academies Press, Washington, DC, 74-75; ([6] and ch.4:140-47. |
|
|
Jéquier E, Constant F (2010). Water as an essential nutrient: the physiological basis of hydration. European Journal of Clinical Nutrition 64(2):115-123. |
|
|
Kenefick RW, Mahood NV, Hazzard MP, Quinn TJ, Castellani JW (2004). Hypohydration effects on thermoregulation during moderate exercise in the cold. European journal of applied physiology 92(4):565-570. |
|
|
Kenefick RW, Sawka MN (2007). Hydration at the work site. Journal of the American College of Nutrition 26(sup5):597-603. |
|
|
Kenney WL, Chiu P (2001). Influence of age on thirst and fluid intake. Medicine and science in sports and exercise 33(9):1524-1532. |
|
|
Lang F, Guelinckx I, Lemetais G, Melander O (2017). Two liters a day keep the doctor away? Considerations on the pathophysiology of suboptimal fluid intake in the common population. Kidney and Blood Pressure Research 42(3):483-494. |
|
|
Lawrence EA Johnson EC, Kunces LJ, Ganio MS, Judelson DA, Kupchak BR, Williamson KH (2014).Drinking to thirst versus drinking ad libitum during road cycling. Journal of Athletic Training 49(5):624-631. |
|
|
Malisova O, Bountziouka V, Panagiotakos DΒ, Zampelas A, Kapsokefalou M (2013). Evaluation of seasonality on total water intake, water loss and water balance in the general population in Greece. Journal of Human Nutrition and Dietetics 26:90-96. |
|
|
Manz F, Wentz A (2005). The importance of good hydration for the prevention of chronic diseases. Nutrition reviews, 63(suppl_1):S2-S5. |
|
|
Maughan RJ, Leiper JB, Shirreffs SM (1997). Factors influencing the restoration of fluid and electrolyte balance after exercise in the heat. British Journal of Sports Medicine 31(3):175-182. |
|
|
Moyen NE, Ganio MS, Wiersma LD, Kavouras SA, Gray M, McDermott BP, et al (2015). Hydration status affects mood state and pain sensation during ultra-endurance cycling. Journal of sports sciences 33(18):1962-1969. |
|
|
Nnewi Monthly Climate Averages, Anambra, NG (2018). |
|
|
Otani H, Kaya M, Tsujita J, Hori K, Hori S (2006). Low levels of hypohydration and endurance capacity during heavy exercise in untrained individuals. Journal of Thermal Biology 31:186-193. |
|
|
Perrier ET, Buendia-Jimenez I, Vecchio M, Armstrong LE, Tack I, Klein A (2015). Twenty-four-hour urine osmolality as a physiological index of adequate water intake. Disease markers |
|
|
Phillips PA, Rolls BJ, Ledingham JG, Forsling ML, Morton JJ, Crowe MJ, Wollner L (1984). Reduced thirst after water deprivation in healthy elderly men. New England Journal of Medicine 311(12):753-759. |
|
|
Rolls BJ, Phillips PA (1990). Aging and disturbances of thirst and fluid balance. Nutrition reviews 48(3):137-144. |
|
|
Sawka MN, Pandolf KB (1990). Effects of body water loss on physiological function and exercise performance. In: Gisolfi CV, Lamb DR, eds. Fluid homeostasis during exercise. Carmel: Benchmark Press pp. 1-38. |
|
|
Sui Z, Zheng M, Zhang M, Rangan A (2016). Water and Beverage Consumption: Analysis of the Australian 2011-2012 National Nutrition and Physical Activity Survey. Nutrients 8(11):678. |
|
|
Venugopal V, Chinnadurai JS, Lucas RA, Kjellstrom T (2015). Occupational Heat Stress Profiles in Selected Workplaces in India. International journal of environmental research and public health 13(1):89. |
|
|
Westrell T, Andersson Y, Stenström TA (2006). Drinking water consumption patterns in Sweden, Journal of Water and Health 4(4):511-522. |
|
|
Zazpe I, Sánchez-Tainta A, Toledo E, Sánchez-Villegas A, Martínez-González MÁ (2014). Dietary patterns and total mortality in a Mediterranean cohort: the SUN project. Journal of the Academy of Nutrition and Dietetics 114(1):37-47. |
|
Copyright © 2024 Author(s) retain the copyright of this article.
This article is published under the terms of the Creative Commons Attribution License 4.0


