Full Length Research Paper
ABSTRACT
Diabetes is a chronic progressive endocrine disease characterized by elevation of blood glucose level. This disease is associated with decreased life expectancy; increased morbidity and diminished quality of life. The objective of the study is to assess the correlation of glycaemic control, age and duration of disease with quality of life in patients with type 2 diabetes mellitus. The present cross-sectional study was conducted in 200 patients (100 each from rural and urban centers), at field practice area of Department of Community Medicine, P.K.DAS, Pallakad. The study was conducted with the help of pretested, semi-structured questionnaire. Data were entered in Microsoft Excel and analysis was done with IBM SPSS (Statistical Package for Social Sciences) version 21. In the present study, 42% of the participants were in the age group of 61 to 70 years. Amongst them, 55.5% were males and about 24% of the participants have had the disease for the past 11 to 15 years. Males had higher quality of life (QOL) scores than females. QOL scores were also higher in participants of rural areas, without any complications/co-morbidities who were employed and with HbA1c level less than 7. Scores were minimum for the participants belonging to the age group of >70 years and of upper socio-economic class. Poor QOL was associated with increasing age, duration of disease and poor glycaemic control.
Key words: Type 2 diabetes mellitus, quality of life, HbA1c.
INTRODUCTION
Diabetes is a chronic progressive endocrine disease characterized by elevation of blood glucose level. This leads to various complications, which further lead to morbidity and mortality as well as a disease in which the body’s ability to produce or respond to the hormone insulin is impaired. This results in abnormal metabolism of carbohydrates and elevated levels of glucose in the blood (Kumar et al., 2013). According to WHO, diabetes mellitus is defined by the level of hyperglycaemia giving rise to risk of microvascular damage (retinopathy, nephropathy and neuropathy) (Chawla et al., 2016). Abnormal high level of blood glucose is called as hyperglycaemia which, if severe, acute and untreated, can be life threatening. It is associated with decreased life expectancy, increased morbidity, increased risk of macrovascular complications and diminished quality of life (https://www.who.int/diabetes/publications/Definition%20and%20diagnosis%20of%20diabetes_new.pdf). Type 2 diabetes mellitus is characterized by insulin resistance in peripheral tissue and a delay or deterioration of insulin secretion, due to gradual deterioration of β-cell function. Acute complications significantly contribute to death, costs and poor quality of life (QOL). QOL is a multidimensional construct which is used to refer to an individual’s evaluation of his/her own life (Chawla et al., 2016). Thus type 2 diabetes mellitus (T2DM) is a complex and a serious chronic disease that imposes a significant burden on patients and society in terms of morbidity and premature mortality. It has a negative impact on the affected individual's perception of overall health (Kumar et al., 2013). There are several reasons that make quality of life so important for patients and their healthcare providers. With increase in prevalence of diabetes mellitus, it has become important to assess the QOL for the control and treatment of the disease. Abnormally high blood glucose as well as abnormally low blood glucose can occur in all types of diabetes and may result in life-threatening conditions. Over time this disorder may damage the heart and blood vessels, kidneys, eyes, nerves, and thus significantly increase the risk of heart disease and stroke, diabetic retinopathy, nerve damage (neuropathy), foot ulcers, infection and the eventual need for limb amputation. Diabetes is among the leading causes of kidney failure. The American Diabetes Association (ADA) estimated the national costs of diabetes in the USA for 2002 to be US$ 132 billion, increasing to US$ 192 billion in 2020 (Chawla et al., 2016). Based on cost estimates from a recent systematic review, it has been estimated that the direct annual cost of diabetes to the world is more than US$ 827 billion (NCD Risk Factor Collaboration (NCD-RisC), 1980; Seuring et al., 2015).
MATERIALS AND METHODS
Study area
The present study was conducted in the Field Practice area of Department of Community Medicine, P.K.DAS, Pallakad, Kerala. The health services in this area are catered through one rural and one urban health centres. These centres deal with population and comprise doctors who try to measure the needs of people ( both sick and healthy), who plan and administer services to meet those needs and those who are engaged in research and teaching in the field. Rural health training centre is situated at Thiruvilwamala, Pazhayannur Taluk of Thrissur District, which is 22 km from the hospital. Routine activities include OPD services, special activities in ANC clinic (Thursday), and immunization (Thursday). Health education sessions are conducted on all important health days. Department also has two rural health centres functioning at Pazhayannur and Chuduvalathur. Urban health center under the Department of Community Medicine is situated at Aarani which is 4 km away from our institution. It is under Shoranur municipality covering 32.33 sq. km area. Activities are daily free OPD services including basic investigations and medicines, specialty clinics like ANC and Pediatric consultation on Monday, immunization on Wednesday and Physician consultation on Friday. The present cross-sectional study was conducted over a period of one year from January 2014-December 2014.
Study population
Inclusion Criteria: Participants aged 20 years or above diagnosed with Type 2 DM attending the OPD of Urban and Rural areas. We used SF36 in the world of health outcomes measurement. Nothing is more vital than the accuracy of your data. The SF-36 consists of eight scaled scores, which are the weighted sums of the questions in their section. Each scale is directly transformed into a 0-100 scale on the assumption that each question carries equal weight. The lower the score the more disability the patients are. And nothing is more damaging than costly data errors that could have been easily avoided. Designed specifically for our generic health surveys, this program assures the quality of your data and its proper interpretation. By preventing devastating errors, we simplify the process for you and provide you with reliable results you can trust.
Exclusion criteria
Those not willing to participate in the study were excluded. The people who are not diagnosed with type 2 diabetes mellitus and normal individuals.
Sample size
For the present study, 200 patients of Type 2 DM (100 each from rural and urban centers) were recruited. Previous experience showed that annually more than 100 patients of Type 2 DM were reported to each of the health centers. Hence, it was decided to study at least 100 patients from each centre.
Study tool
The study was conducted with the help of semi-structured, pretested questionnaire which was first piloted in the field area of the UHTC of Palakad and necessary changes as per norms and local requirements were made. The questionnaire was divided into the following three sections: Section A: This section contained the socio-demographic profile of the study participants. The socio demographic profile consisted of age, sex and address of the participants. Section B: In this section the information was ascertained about the variables related to the disease. The variables were as follows: Duration of disease, investigations as Blood Sugar (F), fasting blood sugar of the respondents. The current WHO diagnostic criteria for fasting plasma glucose are ≥ 7.0 mmol/L (126 mg/dl), Blood Sugar (PP): Shows the post prandial blood sugar of the respondent. The current WHO diagnostic criterion for post prandial (two hours after meal) plasma glucose is ≥ 11.1 mmol/l (200 mg/dl)4, HbA1c: To check the Hemoglobin A1c to detect the glycaemic control of the patient. We took the cut off level of HbA1c as 7%. Section C: This section contained the SF 36 Questionnaire5 which is a generic questionnaire accommodating 36 items which measures Quality of Life (QOL) across eight subscales, which are both physically and emotionally, based. For each subscale, scores are transformed to a scale from 0 (worst health) to 100 (best health). The eight different subscales or domains that the SF36 measures are as follows: Physical functioning, role limitations due to physical health, role limitations due to emotional problems, energy/fatigue, emotional well-being, social functioning, pain, general health. All the eligible participants were interviewed after taking written informed consent from them. Height and weight of all the participants were noted. The patients were assessed by the SF6 Laboratory investigations as FBS, PPBS and HbA1c to know the control status of all the participants.
Statistical analysis
The software used for the data-entry and the analysis of the data are Microsoft Excel and IBM SPSS (Statistical Package for Social Sciences) version 21. Quantitative data were presented as mean and standard deviation while qualitative data were presented as percentage to depict proportions. T-test and ANOVA tests were applied to show the difference of scores among the various categories of a particular variable. T-test was done for the differences between means of two independent groups. ANOVA tests were done for the differences between means for 2 or more groups. ANOVA test was done for variation between the means and within each mean. That is, ANOVA uses a different calculation. Its value is obtained in looking at the variation between and within the means. It not only compares the means (like the t-test) but examines the variation in calculating the means. Excessive variation in calculating a mean reduces the chance of determining a significant difference. The ANOVA test is robust to the assumption of normality. P value less than 0.05 was taken as significant at 95% confidence interval. The study did not impose any financial burden in form of any drug usage or conduction of laboratory tests etc. Confidentiality was maintained throughout the study. The study was conducted based on the ethical committee approval with the following letter numbered IEC/PKDIMS/15-16/21. Data cleaning was done after all the outdated or incorrect information with the highest quality was presented in the step Get Rid of Extra Spaces. All blank cells were selected and treated. Numbers stored as text were converted into numbers. Duplicates were removed and errors were highlighted. Text was changed to lower/upper/proper case. Spelling was checked and all formatting was deleted.
RESULTS AND DISCUSSION
The present study was conducted for a period of one year from January 2015 to December 2015. A total of 200 Type 2 Diabetes Mellitus patients participated in the study; their results are the average SF 36 score as per the age of the subjects. All the domains showed steady decline in scores as the age advanced especially after 40 years. Mean scores of Physical Functioning domain were maximum (81 ± 20.111) for those patients who were in the age group of below 40 years.
A steady decline was seen in the mean scores as the age increased. Mean scores of Role limitations due to physical health domain were maximum (83.87 ± 33.880) for those patients who were in the age group of 41-50 years. Mean scores of Energy/fatigue domain were maximum (69.19 ± 12.322) for those patients who were in the age group of 41-50 years. Mean scores of Emotional well-being domain were maximum (71.23 ± 14.87) for those patients who were in the age group of 41-50 years. Mean scores of Social functioning domain were maximum (65 ± 9.86) for those patients who were in the age group of below 40 years. Mean scores of pain domain were maximum (67 ± 22.724) for those patients who were in the age group of below 40 years. Mean scores of General health domain were maximum (59.84 ± 17.392) for those patients who were in the age group of 41-50 years. And the difference was statistically significant for all of these age groups. Mean scores of role limitations due to emotional problems domain were maximum (76.34 ± 37.705) for those patients who were in the age group of 41-50 years. But the difference was not statistically significant. Scores for all domains were minimum for those subjects belonging to the age group of >70 years. A total of 200 Type 2 DM patients participated in the study. Majority (42%) were between 61 to 70 years of age followed by 51 to 60 years (30%), 41 to 50 years (15.5%), >70 years (7.5%) and ≤ 40 years (5%). Majority were males (55.5%) Majority (24%) have had the disease for past 11-15 years, 23% have had the disease for less than 5 years, 22.5% have had the disease for the past 6-10 years, 19.5% have had the disease for last 16-20 years and 11% of all the subjects have had the disease for more than 20 years (Tables 1 to 3).
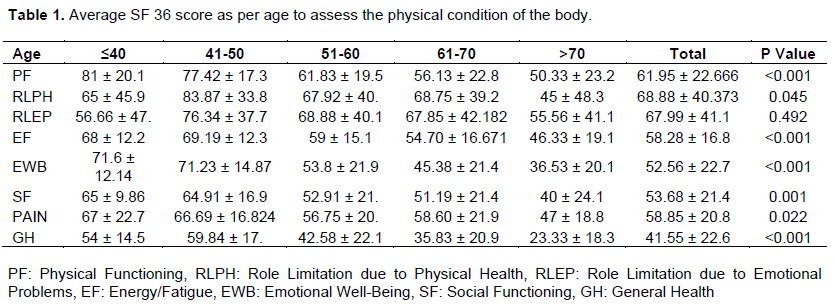
In this study 55.5% subjects were males and 44.5 were females. Similarly, in the study conducted by Mathew et al. (2014), 53% were males and 47% were females (Farquhar, 1995). In role limitation due to physical health domain, better results were observed in the age group of 41-50 years and the difference was significant. Similarly, in role limitation due to emotional problems domain, better results were observed in the age group of 41-50 years but the difference was statistically significant. Again, in the energy/ fatigue domain, better results were observed in the age group of 41-50 years and the difference was statistically significant. For the rest of the domains, age group ≤40 years had better results and the difference was significant. Spasić et al. (2014) also concluded that patients in the younger age groups had better QOL as compared to their older counterparts and this association was significant (Short Form Survey (SF-36), 2008).
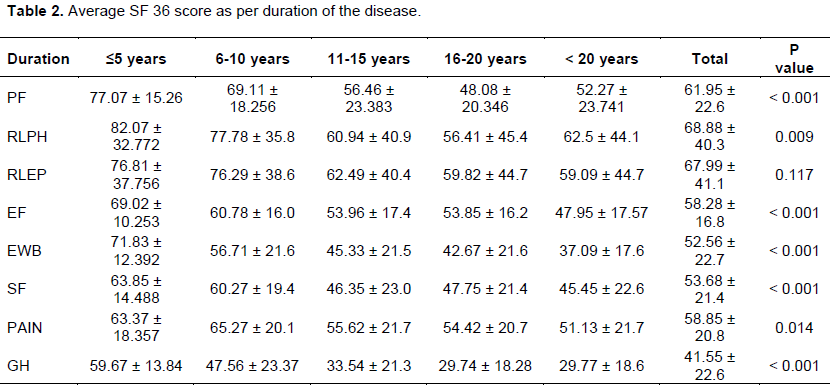
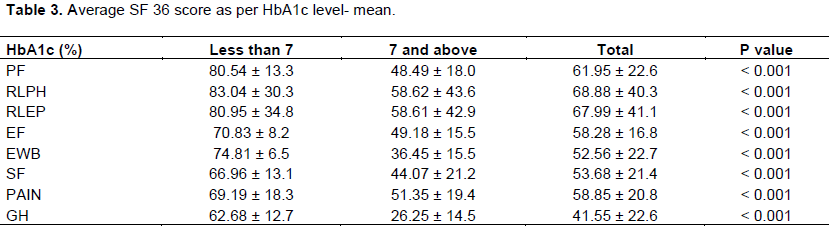
These findings were in agreement with the study conducted by Papadopoulos et al. (2007) in Greece, in which they found that the patients from younger age groups scored higher for all the eight domains (Anumol et al., 2014). In the present study, it was observed that with increase in duration of disease, quality of life tends to decline for all the domains with highest scores for the subjects having disease for less than 5 years and lowest for those having the disease for >20 years. It was also found that this association was significant for all the domains except role limitations due to emotional problem where these results were not significant. Similarly, in the study conducted by Thommasen and Zhang (2006) they found that as the duration of the disease increased, decline in “physical functioning,” “role physical,” and “general health” scores was observed (Spasić et al., 2014). In this study, we found that scores were better for
patients who had HbA1c level less than 7 than those who had more than 7. Similar observations were also found in the study conducted by Imran et al. (2010) in Malaysia, in which they found that patients with poor glycaemic control had the lowest scores in all the scales of the SF-36. The two scales that were most severely compromised were the Physical Functioning and Role Physical scales (Papadopoulos et al., 2007). Similar trend was observed for all the remaining domains. The difference was statistically significant. This observation shows that good control of diabetes plays an important role in improving the quality of life. Similarly, a study by Akinci et al. (2008), in Turkey, found that the patients with higher levels of HbA1c had poor quality of life scores than the patients with low HbA1c levels (Thommasen and Zhang, 2006).
Demographic profile
In this study 42% subjects were in the age group of 61 to 70 years. 30% were in the age group of 51 to 60 years, 15.5% were in the age group of 41 and 50 years, 7.5% were above 70 years and 5% were below or equal to 40 years of age. In the study conducted by Kumar et al. (2016), 62% were in the age group of 40-59 years, 34% were in the age group of more than 60 years of age and 4% were in the age group of 20-39 years of age (Kamarul et al., 2010). In another study conducted by Majgi et al. (2012), 19.8% were in the age group of 25-29 years, 29.1% were in the age group of 30-39 years, 20% were in the age group of 40-49 years, 14.8% were in the age group of 50-59 years and 16.4% were in the age group of more than 60 years (Akinci et al., 2008).
In this study, 55.5% subjects were males and 44.5 were females. Similarly, in the study conducted by Mathew et al. (2014), 53% were males and 47% were females (Laios et al., 2012). In the present study majority of the study subjects were Hindus, constituting 50.5% of the total number. Sikhs were 29.9%, Muslims were 16.5% and Jains were 4%. Similar religion wise distribution of subjects was seen in urban areas but in rural areas comparatively more participants were Sikhs and Muslims than in urban areas. Hindus constituted 79% of the subjects, 14.5% were Muslims and 6.5% were Christians (Oxford English Dictionary, 2016). This particular area has a significant population of Sikhs along with Hindu majority, which could be the reason for inclusion of more number of Hindus and a significant number of Sikhs in the sample.
In urban areas majority (31%) were graduate and above and only 12% were illiterate. Whereas in rural areas majority (31%) were educated up to high school and almost one fourth (23%) were illiterate. Reason for this could be due to the fact that literacy level in rural areas is lower than urban areas. Similarly, in the study conducted by Singh et al. 43.5% were educated up to primary, 26.1% were illiterate, 21% were educated up to secondary, 5.8% were pre-university and 3.6% were graduate and above (MacCracken and Hoel, 1997).
In the present study, 51.0% of the subjects were unemployed and 49.0% were employed. Same distribution was found in urban as well as rural areas. In another study conducted by Algaonker (1972) 58.8% of the study subjects were unemployed, the rest 41.1% were employed out of which 30.9% were skilled and 10.2% were semiskilled or unskilled workers. In rural areas 55.2% were unemployed while in urban areas 62% were unemployed (Sen, 1893). In a study conducted 20% of the study subjects were skilled workers, 15.6% were unskilled workers, 37.6% were housewives, 6.8% were unemployed, 1.4% were professionals, 18% were businessmen (Algaonker, 1972).
In this study, majority (26%) of the subjects were from class IV. 21% were from Class III, 18.5% were from Class I, 17.5% were from Class V and 17% of the subjects were from Class II. Similarly, in the study Conducted 32.6% were from Class IV, 28.5% were from Class III, 18.2% were from Class II, 15.5% were from Class V, and 5.2% were from Class I (Sen, 1893). In another study conducted 6.4 were from Class I, 8.2% were from Class II, 2% were from Class III, 45.6% were from class IV, 19.8% were from Class V (McGrew, 1985).
CONCLUSION
Type 2 diabetes mellitus is linked to a poorer perception of health-related quality of life. Diabetic patients have comparatively poorer quality of life than non- diabetic population. QOL is especially affected with increasing age, increased duration of disease and poor glycaemic control. Therefore, it must be kept in mind that diabetes has a great impact on a patient’s life that cannot be measured solely by the quantification of objective clinical parameters alone (like morbidity and mortality). We recommend that efforts should be made to improve the QOL in combination with medical treatment in order to achieve the overall wellbeing and health status of patients.
CONFLICT OF INTERESTS
The authors have not declared any conflict of interests.
REFERENCES
|
Akinci F, Yildirim A, Gözü H, Sargın H, Orbay E, Sargın M (2008). Assessment of health-related quality of life (HRQoL) of patients with type 2 diabetes in Turkey. Diabetes Research and Clinical Practice 79(1):117-123. |
|
|
Algaonker SS (1972). Diabetes mellitus as seen in Ancient Ayurvedic Medicine. In: Bajaj AS, editor. Insulin and Metabolism. Bombay (India): Indian Press, p. 1-19. |
|
|
Anumol M A, Anusree T, Aparna M A, Archana S, Athira M, Sachina B, Gireesh G (2014). Quality Of Life Among Type-Ii Diabetes Mellitus Patients In South India: A Descriptive Study. American International Journal of Research in Humanities, Arts and Social Sciences 2(7):197-200. |
|
|
Chawla A, Chawla R, Jaggi S (2016). Microvasular and macrovascular complications in diabetes mellitus: Distinct or continuum? Indian Journal of Endocrinology and Metabolism 20(4):546â€551. |
|
|
Farquhar M (1995). Definitions of quality of life: taxonomy. The Journal of Advanced Nursing . Journal of Advanced Nursing22(3):502-5088 |
|
|
Kamarul Imran M, Ismail AA, Naing L, Wan Mohamad WB (2010). Type 2 diabetes mellitus patients with poor glycaemic control have lower quality of life scores as measured by the Short Form-36. Singapore Medical Journal 51(2):157-162. |
|
|
Kumar A, Goel MK, Jain RB, Khanna P, Chaudhary V (2013). India towards diabetes control: Key issues. Australasian Medical Journal 6(10):524-531. |
|
|
Laios K, Karamanou M, Saridaki Z, Androutsos G (2012). Aretaeus of Cappadocia and the first description of diabetes. Hormones 11(1):109-113. |
|
|
MacCracken J, Hoel D (1997). From ants to analogues: Puzzles and promises in diabetes management. Postgraduate Medical Journal 101:138-140. 143-145, 149-150. |
|
|
McGrew RE (1985). Encyclopedia of Medical history. 1st ed. London, (United Kingdom): McMillam Press, p. 74-297. |
|
|
NCD (1980). Risk Factor Collaboration (NCD-RisC). Worldwide trends in diabetes since 1980: a pooled analysis of 751 population-based studies with 4*4 million participants. Lancet 2016 |
|
|
Papadopoulos A, Kontodimopoulos N, Frydas A, Ikonomakis E, Niakas D (2007). Predictors of health-related quality of life in type II diabetic patients in Greece. BMC Public Health 7(1). |
|
|
Sen BC (1893). Diabetes mellitus. Paper presented at the Sixth Calcutta Medical Society meeting. The Indian Medical Gazette 28:240 |
|
|
Seuring T, Archangelidi O, Suhrcke M (2015). The economic costs of type 2 diabeteseglobal systematic review. Pharmaco Economics 33(8): 811-831.8.36-Item Short Form Survey (SF-36) | RAND [Internet]. Rand.org. 2008 [cited 23 September 2016]. |
|
|
Spasić A, Radovanović R, ÄorÄ‘ević A, Stefanović N, Cvetković T (2014). Quality of Life in Type 2 Diabetic Patients. Acta Facultatis Medicae Naissensis 31(3):193-200. |
|
|
Thommasen HV, Zhang W (2006). Impact of chronic disease on quality of life in the Bella Coola Valley. Rural and Remote Health 6:528 |
|
Copyright © 2024 Author(s) retain the copyright of this article.
This article is published under the terms of the Creative Commons Attribution License 4.0


