ABSTRACT
Adolescence is the transitional period between childhood and adulthood. During this, nutrient needs are greatest. There is so little data on adolescents' nutrition and research needs are immense. The objective of the study was to assess prevalence and associated factors of undernutrition in school adolescents aged 10 to 19 years. A cross-sectional study was conducted at GobuSeyo district in December, 2016. Using multi-stage sampling technique and interviewer administered questionnaire data was collected from 640 adolescents. Statistical package for social science version 20 for data entry and analysis and World health organization Anthroplus for determination of nutritional status of adolescents were used. Multivariable logistic regression analysis was used to identify independent predictors. Prevalence of stunting and underweight composed 17.0 and 18.8% respectively. Adolescents who were stunted and underweight were 22.9%. Severely stunted and underweight adolescents were 1.7 and 2.8% respectively. Single predictor of stunting was fathers’ occupation (Adjusted odds ratio-AOR- 5.82; 95%; CI-1.15, 29.38). Sex and age of the respondents and fathers’ occupation were significant predictors of undernutrition. Thus, adolescent nutrition program focusing on age and sex of adolescents needs to be designed and implemented to address nutritional problem specifically in the study area.
Key words: Adolescents, GobuSeyo, stunting, underweight, undernutrition.
Adolescence is accompanied by dramatic physical, cognitive, social, and emotional changes that present both opportunities and challenges for adolescents, families, health professionals, educators, and communities.
Adolescence is a period of rapid growth: up 20% of final adult height and 50% of adult weight are attained, bone mass increases of 45% and dramatic bone remodeling occur. Soft tissues, organs, and even red blood cell mass increase in size. As a result, nutritional requirements peak during adolescence. Nutrition influences growth and development throughout infancy, childhood and adolescence; it is, however, during the period of adolescence that nutrient needs are the greatest (World Health Organization, 2002; Giuseppina, 2000).
Globally, malnutrition remains the most serious health problem and the single biggest thirty three (33) contributor to child mortality. In developing countries more than 30% of the population suffer from micronutrient deficiencies [Iodine Deficiency Disorder (IDD), Iron Deficiency Anemia (IDA), and Vitamin A Deficiency (VAD)] and almost one-third of children are either underweight or stunted in which the magnitude of the problem will hinder many countries from achieving Millennium Development Goals (MDGs) because problem of malnutrition and food insecurity revolves almost around all components of MDGs (The World Bank, 2006).
Worldwide, some 13 million infants are born each year with low birth weight (LBW) which has direct association with the nutritional status of their mothers before and during pregnancy and aggravated by teen age pregnancy. This problem causes lower intelligence and reduced physical capacity, which in turn reduce productivity, slow economic growth, and perpetuate poverty; and that malnutrition passes from generation to generation because stunted mothers are more likely to have underweight children. About 178 million children around the world are stunted. Of the estimated 178 million, 90% live in 36 countries, one of which is Ethiopia. Thus, if intervention is not taken, the problem goes through adolescence and adulthood (The World Bank, 2006).
Malnutrition continues to be a major public health problem in developing countries including Ethiopia. Ethiopia has witnessed encouraging progress in reducing malnutrition over the past decade. The baseline levels of malnutrition in this country still remain so high and then Ethiopia must continue to make significant investments in nutrition. In Ethiopia, 23% of adolescent girls were stunted while 9% severely stunted and underweight girls were 14% (National Nutrition Programme by Federal Ministry of Health of Ethiopia, June 2013-June 2015).
It has showed that IDA, IDDs, and stunting alone are projected to cost Ethiopia about 10% of Gross Domestic Product (GDP). Also total loss in productivity due to under nutrition for 2009 is estimated at approximately 55.5 billion Ethiopian Birr (ETB), which is equivalent to 16% of Ethiopia's Gross Domestic Product (GDP). World Health Organization (WHO) considers stunting and underweight prevalence rate of over 40 and 30%, respectively as very high and a major public health problem. This indicates that malnutrition remains a huge public health problem in Ethiopia (The World Bank, 2006; Federal Democratic Republic of Ethiopia MOH, 2009).
Study conducted in rural town of Ambo revealed that 27.2% was underweight and 4.4% was overweight (Bisai et al., 2011). Nutritional status of adolescents were studied in Jimma and Tigray, Ethiopia and found that 26.5 and 16.0% was stunted and 58.3 and 80.8% was underweight (Afework 2009; Huruy et al., 2013). These studies indicated that prevalence of underweight among adolescents were higher than that WHO indicator and needs attention for further research.
At present there are so little data on adolescents' nutritional and health status and micronutrient nutrition, eating pattern and underlying influences, and on impacts of nutrition intervention in adolescents that research needs are immense.
There were limited international reference data; the limited data available indicates that their nutritional status is considerably lower in developing than the industrialized world. Often, adolescents' health and nutritional status is a direct reflection of the cumulative efforts of childhood health and nutrition. At the same time, like children, adolescents also have specific and increased nutritional needs due to rapid physical growth and mental maturation.
Current information related to nutrition status for particular age group is needed for variety of purposes such as: identifying chronic nutritional problems and causes; predicting and detecting short term or acute nutritional problems; targeting population groups for both short-term relief efforts and long-term policy and program development; monitoring changes and evaluating the impact of interventions and development programs.
Therefore, the findings of this study were aimed to assess prevalence and associated factors of undernutrition among adolescents in the study area. The finding of the study will also serve as source of information for concerned bodies like planners, policy makers, governmental and nongovernmental organizations that need to know about nutritional status and associated factors among adolescents in the study area. It may also be used as a base line data and information for other researchers who will be interested in conducting a study on this topic. Besides, it is recommended that other investigators should conduct further study by adding more variables and qualitative types of data to assess the prevalence and the predictors of undernutrition among adolescents.
Study setting and period
The study was conducted in Gobu Seyo District, East Wollega Zone from 1st to 26th December, 2016 among adolescents aged 10 to 19 years in the study area. Gobu Seyo is one of the 17 districts in East Wollega Zone, Oromia Regional State and located 250 km away from the capital city of Ethiopia, Addis Ababa to the West and 65 km from the capital of East Wollega Zone, Nekemte to the East. The main town of the woreda is Anno.
The district is geographically surrounded by: West Showa Zone and GudeyaBila district towards the East, Sibu Sire district towards the West, GudeyaBila district towards the North and BiloBoshe district towards the South. The climatic condition of the district is low land (kola) 78% and midland (WoyinaDega) 22 % with annual temperature of 15 to 31°C.
The district has 9 kebeles (1 urban, 1 semi urban and 7 rural) which is clustered into two clusters for administrative purpose. The total population of the district as projected from 2007/2008 census is about 50,366; from which 24,901 (49.44%) are males, and 25,465 (50.56%) are females. According to data obtained from district health office, there are 9,012 households in the district with different target group (Under one Year infants = 1,613; under five Year children = 6,403; pregnant women = 1,613; non pregnant women = 7,008, and 11,401 adolescents) (GobuSeyoWoreda Health Office, 2013).
Different ethnic group; Oromo, Amhara, Gurage, Tigre… etc live in the district. Different religion followers like Protestant, Orthodox, Muslim, and Wakefata live in the district. There are different government, private and non-governmental organizations and institutions in the district. Gobu Seyo district has two health centers (governmental), 9 health post, and 11 private clinics providing health services for the communities. The district has also different types of organizations, 1 kindergarten (private), 21 primary school (first and second cycle), 1 high school and 1 preparatory school.
Study design
A school based cross-sectional study design was employed.
Source and study population
All in school adolescents aged 10 to 19 years in Gobu Seyo district were the source population while a selected adolescents aged 10 to 19 years were taken as study population.
Inclusion and exclusion criteria
Adolescent students aged 10 to 19 years and from grades 4 to 8 who gave consent available during the study period were included in this study. Adolescent students with physical deformity and disability for anthropometric measurements were excluded from the study. Students from grades 1 to 3 were also excluded from the study because students at this level may not respond correctly to the prepared questionnaire and their age was most probably less than 10 years.
Sample size determination
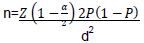
The sample size of the study was determined using formula for a single population proportion with assumptions of 27.2% prevalence of underweight taken from study conducted in rural town of Ambo (37), 95% confidence level, 5% degree of desired precision or margin of error for sampling, a design effect of 2 due to multistage sampling and 5% for non-response rate. A Z-value of 1.96 was used at 95% confidence interval (CI) and d of 5% (n= sample size, p= prevalence, d= margin of error).
So with adjustment for non-response (5% contingency) n= (305+15) = 320, and multiplied by design effect 2, the final sample size was 640 adolescents.
Sampling procedures
Two stage cluster sampling technique followed by systematic random sampling was used to select adolescents from schools. From 21 primary schools found in the district, 10 of them are primary first and second cycle (1 - 8th grade). From these five schools was selected by probability proportional to size (PPS). Study participants were allocated to selected schools by proportionate allocation and from each selected schools they were selected by systematic random sampling based on frame existing in schools students’ roster (Figure 1).
Data collection procedure and measurements
Instrument for data collection was developed based on conceptual frame work of undernutrition and associated factors on adolescents. Also some of the instruments for data collection was adapted and developed after review of literature from journals and different publication prepared by WHO, United Nation International Children Emergency Fund (UNICEF) and other organization to collect data on adolescent and school children nutritional status. In addition, some part of instruments was adapted from Ethiopian Demographic Health Survey (EDHS) data collection tool to capture data on dietary practice and micronutrient supplementation level for various age groups.
The data was collected through school visits from 640 adolescent students using structured and pre-tested questionnaire by interviewer which is prepared in English language and then translated to Afaan Oromo (local language). Questionnaire was pre-tested in the same study area of the schools which were not included in the actual data collection and checked for consistency and some modification was done. Anthropometric measurements were recorded for each study participants on the intended format attached to the questionnaire. For this purpose the following anthropometric information about the respondents was collected.
Measurements
Anthropometric assessment:
1. Height measurement: The measurement of height was done against a vertical wall with an attached measuring tape and a horizontal head board that could be brought into contact with the upper most point on the head. The adolescents’ height was measured barefoot or in thin socks while they wear little clothing so that the position of the body can be seen. Each adolescent was asked to stand on the flat surface, with weight distributed evenly on both feet, heels together against the wall and the head positioned so that the line of vision is perpendicular to the body (Frankfurt position). The arms hanging freely to the sides, and the head, shoulder blade, buttocks and heels are in contact to the wall. The adolescents are asked to inhale deeply and to maintain a fully erect position. The moveable headboard brought on to the topmost point on the head with sufficient pressure to compress the hairs. The height is measured in meters and recorded to the nearest 0.1 cm.
2. Weight measurement: Well calibrated adult digital scale (described below in detail) was used to weigh the adolescents. The weighing scale was calibrated with the help of 10 kg weight. This calibration was done after each day measurements. The weighing scale placed on flat surface and the weight was measured with little clothing and bare feet. Weight was recorded to nearest 100 g. The age and sex specific height and body mass index (BMI) Z score of standard deviation (SD) for each subject was determined using the 2007 WHO growth reference for ages 5 to 19 years (61-228 months). The students were then classified into one of the following categories using previously used standards: Underweight (< -2SD), stunted (<-2SD), stunted (< -3SD) and severely underweight (< -3SD).
Dietary assessment:
1. Food frequency questionnaire: These were designed to assess usual eating habits, over recent months or years, and comprise a list of foods most informative about the nutrients of foods of interest. These generally have been of the type and frequency of food item (FAQ) in which the subjects were asked to say how often they usually consume an item of food or drink and how much they typically have on the days they consume it in a month.
2. Dietary diversity score (DDS): These were designed to assess eating habits, over recent period of time, and comprise a list of foods most informative about the nutrients of foods of interest. These generally have been type of food eaten during the day and night at home or outside home by adolescents in which the subjects were asked to answer what types of food or drink they consumed in the last 24 h. Dietary diversity score questionnaire was filled for each study participants by the interviewer.
Variables of the study:
1. Dependent variables: Undernutrition indicated by underweight and stunting
2. Independent variables: Socio-economic and demographic variables; residence, head of HHs, marital status, ethnicity, religion, family size, monthly income, decision making on use of money, education, occupation, ownership of livestock and farm land. Adolescent's characteristics: Age, sex, marital status, grade attending, autonomy in decision-making.
3. Environmental sanitation and hygiene: Water supply, latrine and hand washing practice, waste disposal, sanitation and housing condition. Type and frequency of food item taken by adolescents in a month; dietary habits of adolescents, diversity of food consumed by adolescent;
4. Physical activities: Level of activities performed by adolescent in a day;
5. Life style: Healthy life style, unhealthy life style.
Data analysis
The data was checked for completeness, coded, entered into Statistical Package for Social Science (SPSS) a computer software version 20.0. After edited, cleaned, and processed, it was analyzed using SPSS for windows version 20.0. Descriptive statistics of mean and SD was used to examine the age and gender-specific anthropometric indices. Based on the WHO growth reference cut-off point, prevalence of stunting and underweight was calculated.
A binary logistic regression analysis was performed to determine the association of undernutrition (stunting and underweight) and associated factors. Statistical association was checked by 95% CI and crude odd ratio (COR). The significant variables (p-value < 0.05) observed in bivariate analysis was subsequently included in multivariate analysis. Finally, 95% CI and adjusted odd ratio (AOR) was checked and the significance variables were taken as associated factors of undernutrition. P-value less than 0.05 was considered as statistically significant.
Data quality management
Before data collection commence, training was given to data collectors and supervisors for two days. Pre-test of the questionnaire was done on 5% of the sample size. In the data collection process, diploma nurses from health center under which the selected school is found were recruited and data were collected by using questionnaire, adult digital scale for the weight and stadiometer for height. During data collection, supervisors were assigned in each cluster to assure the quality of data collection at spot. The measuring scales indicator was checked against zero reading after and before weighing every adolescent. On daily basis, collected information was reviewed and possible errors were returned to the collectors for correction.
Ethical considerations
Ethical clearance was obtained from Wollega University Institutional Review Board for ethical approval and permission. At the time of data collection, written informed consent was obtained from the participants aged 15 years and above. For those study participants aged below 15 years of age, parents were invited to give ascent for their adolescents after they have been selected for the study to confirm whether they were willing to participate or not. Those not willing to participate in the study were given the right to do so. Confidentiality of responses was ensured throughout the research process. The study purpose was also explained to officials of Health department, Education office and Administrative of Gobu Seyo district for their permission and support after which district education office wrote a letter of support to selected schools for cooperation. Information was collected after securing informed consent from study participant and their parents (guardians) in the presence of a school teacher. Data obtained from each study participant was kept confidential and all who participated in the study were acknowledged.
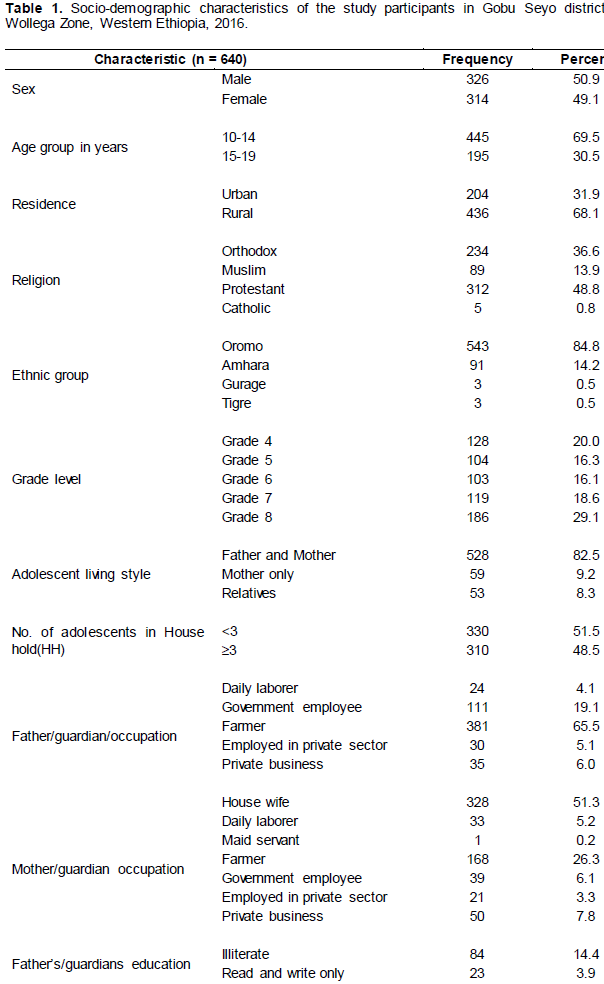
Socio-demographic characteristics of the study participants
Six hundred forty adolescents were interviewed and anthropometric measurements (weight and height) were taken with a response rate of 100% using pretested data collection tools from five schools. For sex proportion of the participants, 326 (50.9%) were males and 314 (49.1 %) were females. Of 640 adolescents who participated in the study, 445 (69.5%) were 10-14 years and 195 (30.5%) were 15-19 years old with a mean age of 13.32 years (SD±2.03).
From all participants involved in the study, 398 (62.2%) adolescents were rural, 204 (31.9%) were urban and only 38 (5.9%) were semi-urban residents. Majority of the respondents were Protestant followed by Orthodox religion follower which is 312 (48.8%) and 234 (36.6%), respectively. Concerning ethnicity, majority 543 (84.8%) of the respondents were Oromo.
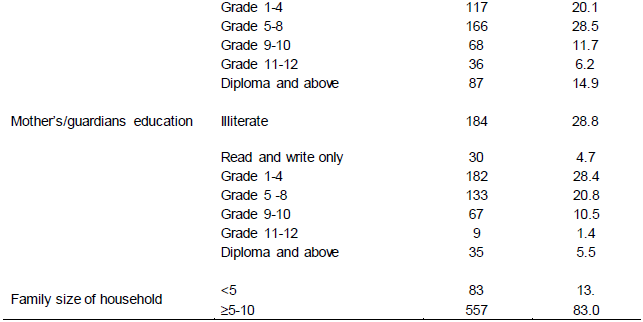
Regarding their marital status, all of them were single. For Educational status, study participants were classified into classes: 4th grade [128 (20.0%)], 5th grade [104 (16.3%)], 6th grade [103 (16.3%)], 7th grade [119 (18.6%)] and 8th grade [186 (29.1%)]. Concerning educational status of families, 84 (14.4%)] of father and 184 (28.8%) of mother (guardians) were illiterate and 381 (65.6%) of fathers 168 (26.3%) of mothers were farmer while 328 (51.3%) of mothers were house wife by occupation.
Among adolescents involved in the study only 50 (7.8%) of adolescents have their own monthly income while majority, 590 (92.2%) did not have any monthly income and economically completely dependent on their family. From those who have their own monthly income 37 (74.0%) of adolescents earn ±100 ETB. Majority of adolescents, 528 (82.5%) are living with their father and mother, 59 (9.2%) with their mothers only and the rest 53 (8.3%) with their relatives.
Majority of households [557 (83.0%)] have ≥5 family members in the household and the mean family size was [6.61 (SD±1.96)]. Distribution of adolescents in the family varies from one to six and more than half [330 (51.5%)] of HH have <3 adolescents while the rest 310 (48.5%) of the household have three or more adolescents (Table 1).
Socio-economic characteristics of adolescents and households of adolescents
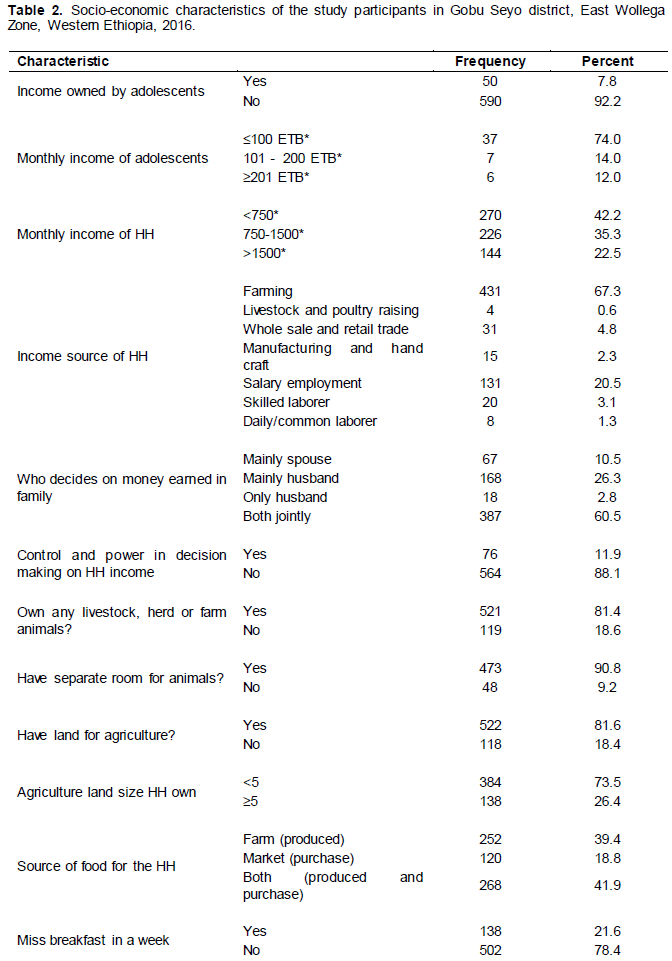
The mean monthly income of household of adolescents were 1215.64 (SD+1124.56) ETB with minimum and maximum of 100.00 and 6000.00 ETB (US$ 5 and 300) respectively. Among households of adolescents, 270 (42.2%) have monthly income less than 750.00 ETB, one third, 226 (35.3%) have 750.00 to 1500 ETB and the rest of the household have income greater than 1500.00 ETB on monthly basis. Major source of monthly income of the family for the household was farming which accounts 431 (67.3%) of households followed by salary employment accounting 131 (20.5%) while other households obtain their monthly income from other sources.
Decision is made differently on how income earned by the family is utilized in the household. Majority, [387 (60.5%)] of the HH make decision both jointly (spouse and husband), 168 (26.3%) of HH decision is mainly made by the husband and in 18 (2.8%) of HH, decision is made only by husband. While the rest 57 (10.5%) of HH decision is made by mainly spouse; from whom 59 of the household are headed by females (Adolescents live with their mothers only). Only 76 (11.9%) of adolescents have control and power in decision making on HH income utilization and majority 564 (88.1 %) of adolescents do not have any decision making power and control on how income of the households is utilized in the family.
Household who own livestock, herds or farm animals were 521 (81.4%) and from those who have livestock, herds or farm animals, 90.8% of them have separate room for their animals while 9.2% of them do not have separate room for their animals. Concerning agricultural land ownership, 522 (81.6%) household of adolescents own lands. The mean size of the land for agriculture was 3.33 (SD±2.17) hectares varying from half a hectare to 15 ha which serve as main source of food for the household members including the adolescents.
Two hundred and fifty two (39.4%) of the household obtain their food from farm (produce food), 268(41.9%) of them from both production and purchase of food. From all adolescents involved in the study majority (78.4%) did not miss their breakfast in a week (Table 2).
Major meals taken by adolescents ranges from two to four times per day. Majority of adolescents 520 (81.3%) took major meals three times per day while 78 (12.2%) and 42 (6.6%) of adolescents take major meals twice and four times per day respectively.
Majority of the study participants 527(82.3%) classified their level of physical activities as active and the rest [109 (17.0%) and 4 (0.6%)] of adolescents are classified as insufficiently active and sedentary, respectively. Concerning time taken from home to school in minutes (min), 383 (59.8%) adolescents came to school in less than 30 min distance and 257 (40.2%) of adolescents ≥30 min. The mean time taken from home to school is 24.57 min (SD + 19.23 min) varying from school at premises to 90 min.
From all adolescents involved in the study, 355 (55.5%) do not have information on adolescent nutrition while others, 285 (44.5%) of the adolescents have awareness on adolescent nutrition from different sources.
The source of information according to decreasing order were mass media (TV/radio/newspaper), school teachers, friends and peers, health workers and family members with 83 (29.1%), 77 (27.0%), 66 (23.16%), 36 (12.6%) and 23 (8.0%), respectively.
Environmental health characteristics of study participants and house hold of adolescents
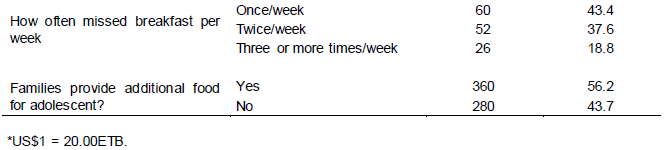
Main source of drinking water for more than 40% of household of adolescents were public tap followed by piped water which accounts for 22.5% of the households. Majority of the household of adolescents, [401 (62.7%)] do not treat their water for drinking using chlorine based solution. Mean time (minute) taken for fetching drinking water round trip was 12.22 min (SD + 10.64 min) varying from water at premises to 60 min. Majority, [470(73.4%)] of HH of adolescents gets water in less than 30 min round trip. Regarding the HH latrine possession with type and usage of it by households six hundred twenty three (97.3 %) of them have latrine of different type and 17 (2.7%) household of adolescents do not have latrine at all and go to bush. Concerning waste or garbage disposal of household of adolescents nearly half (48.1%) of households of adolescents dispose waste in an individual
pit (Table 3).
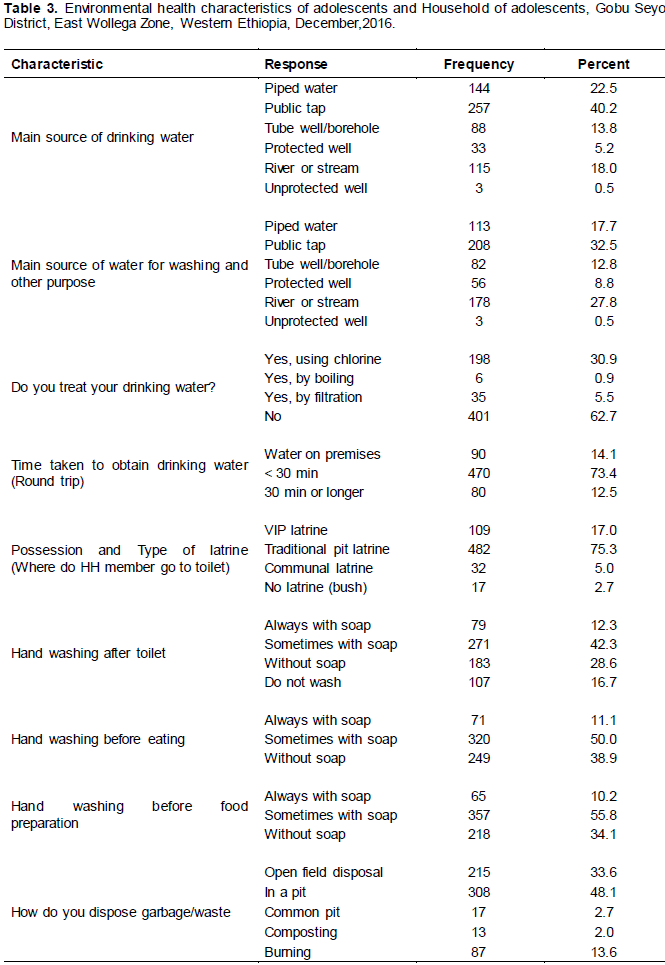
Regarding hand washing practice of adolescents after toilet one hundred seven (16.7%) adolescents do not wash their hands after going to toilet (Figure 2).
Housing condition and information on adolescent nutrition of study participants
Number of room adolescents share in common among other household members were 1 to 2 rooms, 3 to 4 rooms, and 5 and above rooms excluding kitchen and store accounting 214(33.4%), 359 (56.1%) and 67 (10.5%), respectively. Households who have separate room used for kitchen were 572 (89.4%) and other 68(10.6%) do not have separate room used for kitchen and use single room as living room and kitchen. Type of fuel mainly used for cooking for the households of adolescents nearly all 620 (96.9%) of them use wood as a source of energy for cooking and only 20 (3.1%) households uses electricity as main type of fuel for cooking.
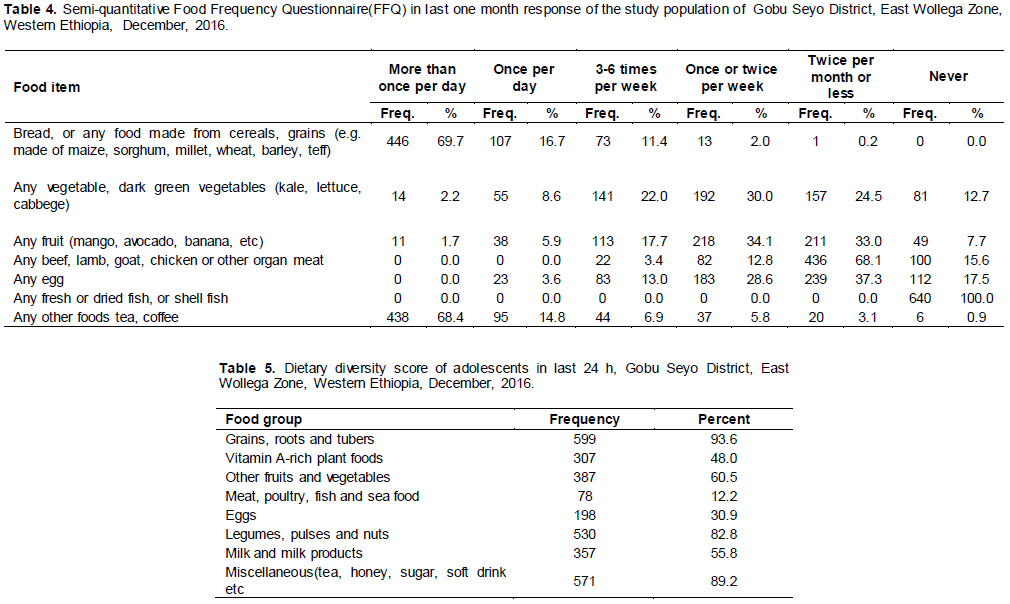
Semi-quantitative food frequency questionnaire (FFQ) of the adolescents
Semi-quantitative frequency of food eaten by adolescents in the last month at the time of the study was assessed using seven food items commonly used for assessing nutritional status of adolescents prepared in FFQ table and found that 446 (69.7%) of adolescents eaten food prepared from cereals and grains more than once per day. As indicated in Table 4, adolescents commonly consumed vegetables (dark green leafy vegetables) and fruits once or twice per week and twice per month or less.
Concerning consumption of meat of any type by adolescents, majority of them, 436 (68.1%) consumed twice per month or less and none of adolescents eaten once per day or more frequent than once per day. Among adolescents involved in the study 112(17.5%) of them never eaten eggs in the last month and large number of adolescents 183 (28.6%) and 239 (37.3%) eaten an eggs once/twice per week and twice per month or less respectively. Surprisingly, all 640 (100.0%) of adolescents never eaten fresh or dried fish in the last month and even in the year or their life time. Lastly, frequency of any other food including tea or coffee, 438 (68.4%) of adolescents take more than once per day followed by 95 (14.8%) adolescents who took the food items at least once per day (Table 4).
Dietary diversity score of adolescents in last 24 h
Using eight food items dietary diversity score (DDS) assessed in the last 24 h among adolescents involved in the study, majority (93.6%) of adolescents ate grains, roots and tubers and nearly half 48.0% ate vitamin A rich foods. Adolescents who had eaten animal sources of protein meat and eggs was low which accounts for 78 (12.2%) and 198 (30.9%) respectively. Other food items consumed by adolescents are given in Table 5.
Prevalence of undernutrition in the study subjects
Prevalence of underweight
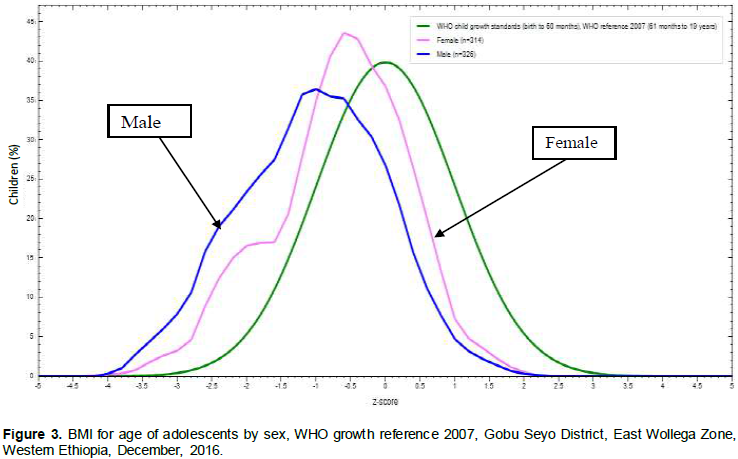
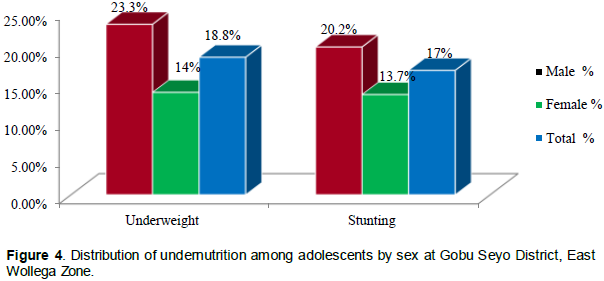
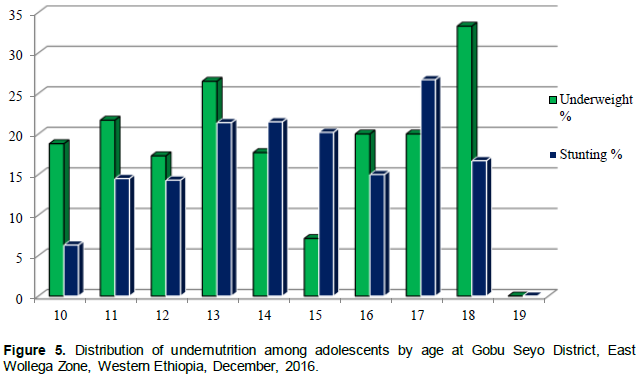
According to WHO growth reference 2007 with body mass index (BMI) for age cut off points < - 2SD the overall prevalence of underweight among adolescents aged 10 to 19 years in study area were 18.8% (95% CI; 15.6%, 21.9%) of which 2.8% (95% CI; 1.5%, 4.2%) were severely underweight (< - 3SD). The higher prevalence of underweight were seen in male 23.3% (95% CI; 18.6%, 28.1%) than female 14.0% (95% CI; 10.0%, 18.0%). Regarding age distribution of underweight among the study participants, it was more prevalent in early adolescence (10 to 14 years) than late adolescence (15 to 19 years) with prevalence of 20.2% (95% CI; 16.6%, 23.9%) and 13.9% (95% CI; 8.1%, 19.8%) respectively.
As presented in Figure 3, BMI for age of adolescents in the study area was assessed by sex distribution and compared with WHO growth reference 2007. For male adolescents the distribution was less peaked than both the WHO growth reference and those female adolescents but more skewed to the left side than WHO growth reference and the female adolescents. Regarding BMI for age distribution of female adolescents it was more peaked than both WHO growth reference of adolescents 2007 and those adolescents in the same study area but it was more skewed to the left side than the WHO growth reference and less skewed to the left than that of male adolescent of the same study. These may show that growth pattern of both male and female adolescents in the study area lag behind when compared with WHO growth reference 2007 and this was true more for male adolescents than female adolescents in the study area. The peak of the distribution also showed that the spurt growth during adolescence occur nearly at the median age of adolescents for the female (Figure 3).

Prevalence of stunting
Prevalence of stunting among study subjects were 17.0% (95% CI; 14%, 20%) of which 1.70% (95% CI; 0.6%, 2.8%) were severely stunted. Similar to prevalence of underweight among adolescents, stunting were more prevalent on male [20.0% (95% CI; 15.7%, 24.8%)] than females [13.7% (95 % CI; 9.7 %, 17.7 %)] [Figure 4].
Western Ethiopia, December 2016
Age distribution of stunting were 16.45% (95% CI; 13%, 19.7%) and 19.2% (95% CI; 12.6%, 25.8%) in early and late adolescents respectively (Figure 5).
Like BMI for age of adolescents, height for age of adolescents were assessed and compared with WHO growth reference 2007 as indicated in Figure 6. The distribution of height for age Z-score (Figure 6) of both male and female adolescents were almost similar to each other and less peaked and moiré skewed to the left than that of adolescents on WHO growth reference 2007. But heights for age Z-score of male adolescents were slightly skewed to the left than that of female adolescents in the study area.
This might indicate that height growth of adolescents in the study area was less than that of adolescents in WHO growth reference 2007 which may hinder physical capabilities and work opportunity by adolescents when compared with normally growing adolescents of the same age and sex. The spurt growth of height for both male and female adolescents occurs at similar age in the study area with SD of -1 when compared with WHO growth reference (Figure 6).
Factors associated with undernutrition of adolescents
Associated factors of underweight
Binary logistic regression analysis for factors of underweight among study participants were performed and found that sex and age of the respondents, level of grade attended by adolescents and fathers’ occupation were statistically associated with underweight of adolescents. As indicated Table 6, sex and age of the respondents and father’s occupation were significantly associated with underweight in final multivariate logistic regression analysis.
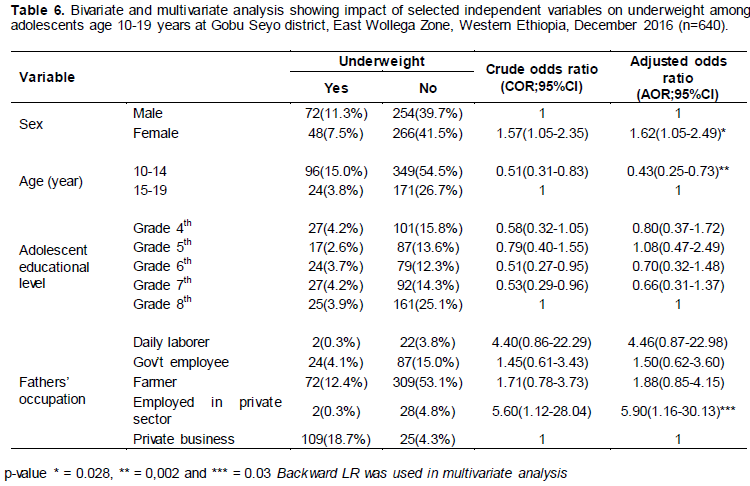
Analysis of this study showed that, female adolescents were about 1.6 times more likely to be underweight than male adolescents (AOR = 1.62; 95% CI = 1.05, 2.49). Adolescents in age group 10 to 14 years were less likely to be stunted when compared with adolescents in aged group of 15 to 19 years of age (AOR = 0.43; 95% CI = 0.25, 0.73). Adolescents which their fathers were employed in private sectors were almost six times more likely to be underweight than those adolescents whose their father run their own private business (AOR = 5.90; 95% CI = 1.16, 30.13) (Table 6).
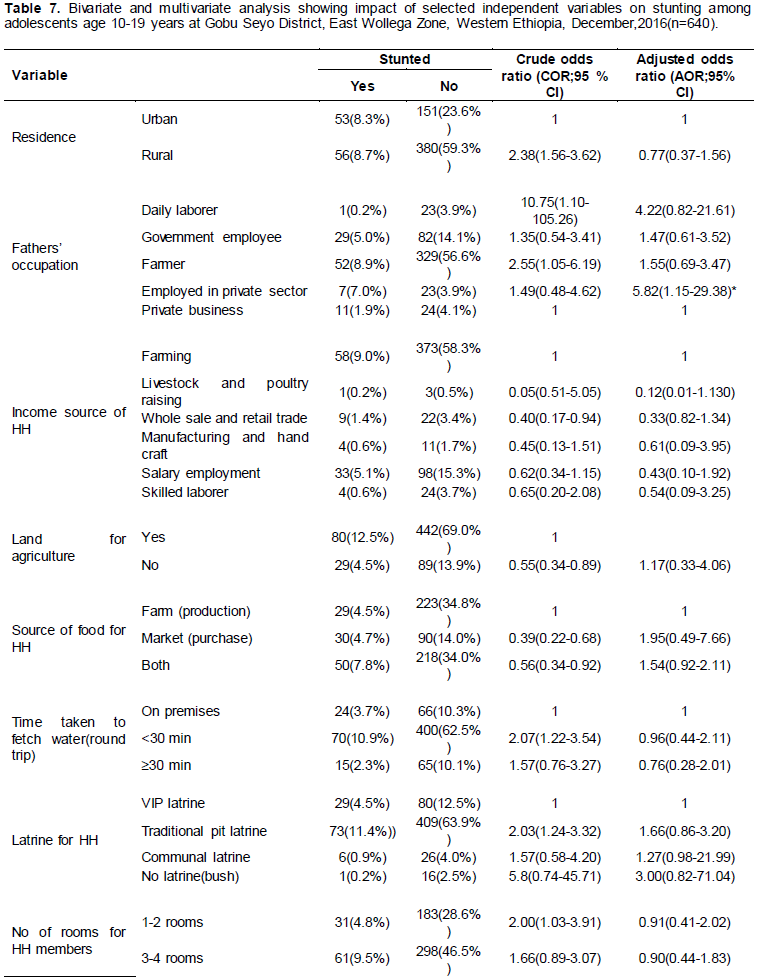
Associated factors of stunting
Based on binary logistic regression analysis of this study residence, fathers’ occupation, income source of household, ownership of agriculture land, source of food, latrine ownership, number of rooms for HH and time to obtain water (round trip) were significantly associated with chronic undernutrition nutrition (that is stunting). But on multivariate logistic regression analysis only fathers’ occupation was statistically associated with stunting of adolescents. Adolescents whose fathers are employed in private sectors were nearly six times more likely to develop stunting when compared with adolescents whose father have their own private business (AOR = 5.82; 95% CI = 1.15, 29.38). Adolescents who did not have latrine were 3 times more at risk to be stunted than adolescents who have ventilated improved latrine but also this was not statistically significant.
Unlike others study, this result showed that residence of adolescents, income source of HH, ownership of agriculture land, source of food, latrine for household, time to obtain drinking water (round trip), and number of rooms for household members were not statically associated with stunting by multivariate analysis (Table 7).
In developing countries, adolescents have higher demographic weight compared to the world adolescents accounting about 26 and 20%, respectively. Africa continent is expected to see its adolescent population growth much more rapidly than other developing countries in the world like Asia and America with a lower fertility control (World Health Organization, 2005).
During adolescence there is rapid and dramatic physical, cognitive, social and emotional changes that increases nutritional requirements and present both opportunity and challenges for adolescents, families, health professionals, educators and communities (World Health Organization, 2002; Giuseppina, 2000).
In developing countries, large numbers of adolescents suffer from different form of malnutrition and anaemia which adversely affect their health and development particularly in adolescent girls contribute to increased risk of pregnancy related complication and giving birth to low birth weight (World Health Organization,2006).
In most developing countries, nutrition initiatives and programs have been focusing on children and women (specially pregnant and lactating) thus neglecting adolescents. Addressing the nutrition needs of adolescents could be an important step towards breaking the vicious cycle of intergenerational malnutrition, chronic diseases and poverty (World Health Organization, 2006).
Worldwide it is well recognized that anthropometric measurements are indispensable in diagnosing under-nutrition among children and adolescents and BMI is the most appropriate variables for determining nutritional status of adolescents (Mukhopadhyay et al., 2005). The current study enabled us to know about the current nutritional status in this very important age group.
A study conducted in Bangladesh, Khagrachari district and India, West Bengal Purulia district on nutritional status of adolescent girls have similar finding to each other on prevalence of underweight (41.3%) which was almost three times higher than prevalence of underweight in this study area which were 14.0% (Hossain et al., 2013). A cross-sectional study conducted on nutritional status of adolescents in India, West Bengal rural area including both male and female adolescents found that prevalence of stunting and underweight was 27.8 and 28.3%, respectively and distribution of underweight by sex was higher on male (31.0%) than female (24.2%) adolescents (Bisai et al., 2011). This result showed that it was higher both for stunting and underweight in adolescents of Gobu Seyo district. There is particularly higher prevalence of underweight in male than female relates with current study even though the percentage of the finding differ from each other. As clearly known, the two countries are developing countries with high prevalence of undernutrition among adolescents and children aged less than 5 years. The higher prevalence of undernutrition in these two developing when compared with current study area can be due to socio-economic status, dietary pattern and educational status of families of adolescents.
Another cross-sectional study conducted in urban and rural Rohtak, Haryana on nutritional status of adolescents found that prevalence of stunting among male and female adolescents were almost similar male (10.7%) and female (10.8%) but stunting in this study was higher both for male and female with prevalence of 20.0 and 13.7% male and female respectively when compared with Rahtak, Haryana study. Prevalence of underweight (male 21.9 to 34.1% and female 11.5 to 19.8%) in Rahtak, Haryana accommodates prevalence of underweight in study area which is 23.3% for males and 14.0% for female (Vashist and Goel, 2009).
Also other similar cross sectional studies conducted in India rural area of Penval and Varanasi district on nutritional status of adolescents found that prevalence of underweight was 70.6% (38.8% for male and 63.6% for female) and 27.0% respectively which was much higher than prevalence of underweight when compared with this study. Between the two districts there is a significant difference on prevalence of underweight even if they are in developing countries of India (Mankar et al., 2016; Sweta Singh et al., 2012). Data collection period, method of assessment and standard growth reference could be a factor for the difference of prevalence of undernutrition in between the two countries and as well as with the current study.
In this study, prevalence of stunting among adolescent girls were 13.7% which was much lower than prevalence of stunting (34.61%) among adolescent girls residing at Hills of Garhawa rural area, India and another cross-sectional study conducted in India, Karnataka on prevalence of stunting found that 40.5% of boys and 24.5% of girls were stunted which was two times higher for boys and nearly two times for girls than in this study (Yogesh and Vartika, 2010; Rajaretnam and Hallad, 2012). Higher prevalence of stunting among adolescent boys goes similar with higher prevalence of stunting in GobuSeyo woreda. This difference in the prevalence might have various factors such as socio economic condition, cultural difference on dietary practice, geographical disparity and genetic variation among the adolescents.
In Dhaka city, Bangladesh, nutritional status and associated factors were assessed among school and college adolescents aged 10 to 19 years of age using height for age, weight for height and weight for age and found that prevalence of stunting was 17.6% and those adolescents who were stunted and wasted were 16.2%. The finding of current study also revealed that prevalence of stunting (13.7%) among adolescent girls were lower than study conducted on nutritional status and associated factors among adolescent girls as measured by height for age in urban Bangladesh (Monira and Khyrunnisa 2003).
Also similar study was conducted to assess nutritional status of adolescents in Islamabad city, Pakistan and revealed that overall prevalence of underweight and stunting among adolescents were 17.0 and 12.2%, respectively. When compared with current finding of Gobu Seyo district it was slightly lower with prevalence of underweight (18.8%) and much lower with prevalence of stunting (17.0%) (Hajra, 2009).
In addition, similar study was conducted in Rawalpindi, Pakistan, among adolescent college girls and come up with a finding of prevalence of underweight was 20.0% which is somewhat lower than that of the current study (Shahid et al., 2009). On adolescent school girls of Rawalpindi, Pakistan, prevalence of stunting and underweight were 6.8 and 17.3%, respectively that indicated prevalence of stunting and underweight was higher than that of current study conducted in Gobu Seyo district (Arshad, 2005).
In Africa, nutritional statuses of adolescents were neglected by some initiatives and programs where focused on children and pregnant and lactating women. Due to this, research finding on adolescent nutrition was not as much as needed for intervention and policy development. The finding of this study on prevalence of stunting among male adolescents were slightly lower and female were higher when compared with prevalence of stunting among adolescents in Nigeria, semi urban area with a prevalence of 23.8 and 4.7% for male and female, respectively. Regarding prevalence of underweight, the same study found that 4.8 and 2.3% of male and female were underweight respectively which was nearly five and six times lower for male and female, respectively than current study conducted in Gobu Seyo district which were 23.3 and 14.0% (Chukwunonso et al., 2010).
In Nigeria, Osun State, cross-sectional study on prevalence of underweight a matter of concern among adolescents was conducted and found that overall prevalence of underweight was 20.1% which was slightly higher than prevalence of underweight in the current study. In both study prevalence of underweight was higher among adolescent boys than girls with a finding of 25.8 and 15.1% in Nigeria and 23.3 and 14.0% in the current study, respectively (Olumakaiye, 2008).
In this study the overall prevalence of underweight and stunting among adolescents were 18.8 (male 20.0 and female 13.7%) and 17.0% (male 23.3% and female 14%), respectively. The results of this study revealed that the prevalence of stunting was lower and that of underweight was exactly similar when compared with a Ethiopian National Nutrition baseline survey conducted in 2010 on adolescent girls, 23% stunted and 14% were underweight (Federal Democratic Republic of Ethiopia MOH,2009; Literature Review, January 2011). Since the base line survey was conducted in different regions of the country there might be variation in socio demography, economy, culture and dietary patterns among adolescents as well as access to food and information on adolescent nutrition for adolescents and their families that could make difference on prevalence of stunting through long run; as stunting is long run effect of undernutrition among adolescents and rooted in childhood age.
Finding of this study also revealed that prevalence of stunting among adolescents aged 10 to 19 years in the study area was almost similar with community based cross-sectional study conducted among adolescents of Jimma zone, South West Ethiopia with a prevalence of 16.0%. But prevalence of underweight in study of Jimma zone was four times higher (80.83%) when compared with that of this study (Huruy et al., 2013). The study might have similar geographic area to each other but their culture and dietary pattern and practice as well as study design could make discrepancy on prevalence of underweight among adolescents because study design of Jimma was a community-based cross-sectional study in which adolescents were enrolled to the study in the second round of the five-year longitudinal study of adolescents in Jimma zone, South west Ethiopia.
Although prevalence of underweight in this study area was far below than that of Jimma zone it was higher than study conducted in Gondar, North Ethiopia with a prevalence of 12.9% (Bemnet, 2012). Similarly prevalence of underweight among elementary adolescent students of 10 sub-cities of Addis Ababa was lower (13.0%) when compared with prevalence of this study (Zeleke, 2007). This difference might be due to socio economic and educational status of adolescents and their families and also exposure to information on adolescent nutrition through mass media and adolescents in Addis Ababa have more access to food than adolescents in this study area.
Prevalence of stunting and underweight in this study were much lower than community based cross-sectional study conducted on prevalence of stunting and underweight in rural communities of Tigray, Northern Ethiopia, which was 26.5 and 58.3%, respectively (Afework, 2009). This discrepancy could be due to socio cultural and geographical variation between the study areas. Additionally dietary pattern of adolescents of the study area and attention towards awareness on adolescent nutrition for adolescent and their families could differ.
Similar institution based cross-sectional study was conducted on factors affecting BMI of adolescent students aged 10 to 19 years in rural town of Ambo, West Oromia, Ethiopia and found that prevalence of underweight was much higher than prevalence of underweight in this study with 27.2%. Even though the prevalence of underweight among adolescents in both studies was different, gender distribution of underweight was higher in males (29.8%) than females (24.6%) when compared with the current finding (23.3%) for males and (14.0%) for females in the study area (Yetubie et al., 2010).
Dietary pattern are determinant factors of nutritional status among adolescents and other age groups. This pattern can be assessed by means of dietary diversity and frequency of selected food items consumed by adolescents. Food items used in the dietary pattern was locally available and food source indicator for balanced diet. Accordingly dietary diversity score of adolescents in the study area was assessed by asking whether adolescents consumed listed food item within 24 h at home and outside home and found that statistically not associated with nutritional status of adolescents and there was no difference between male and female dietary pattern of adolescents.
Frequency of food consumed by adolescents within one month during the study period was clearly described by adolescents based on list of selected common staple food items and found that food made from cereals and grains were commonly consumed more than once per by 446 (67.9%) of adolescents as a source of heat and energy for them and none of adolescents never consumed food made from cereals and grains. This could be due to production crop of food items locally and tradition of households and adolescents on consumption such food as a staple food.
Fruits and vegetables are food groups very important for human health and disease prevention. Eating these food items will favor health and wellbeing of adolescents by making them to avoid junk and fast food eaten. In this study, frequency of fruits and vegetable consumed by adolescents were commonly once/twice per week or twice/less per month.
Different socio demographic and economic characteristics variables were included in the study to identify factors of undernutrition among adolescents in the study area. Variables statistically associated with undernutrition of adolescents were age and sex of adolescents and fathers’ occupation for underweight and only residence of adolescents were statistically associated with chronic undernutrition (stunting) on multivariate analysis. On other studies conducted on nutritional status and associated factors of adolescents various variables of study were associated with undernutrition in which some of the variables did not associate with undernutrition of the current study.
Among variables associated with underweight and stunting of adolescents in other studies major meals per day, missing breakfast, income of household and educational status of families were significantly associated (Shahid et al., 2009; Afework 2009; Yetubie et al., 2010; Huruy et al., 2013). Some cross sectional studies found that associated factors of undernutrition in adolescents were age and sex of adolescents which had similar finding with current study conducted in GobuSeyo woreda (Monira and Khyrunnisa 2003; Yetubie et al., 2010; Huruy et al (2013).
Lack of latrine, distance of drinking water, agricultural land and ownership of cattle significantly associated with stunting and underweight of adolescents particularly in our countries. But in this study environmental factors did not associate statistically with under nutrition except number of rooms shred with household members of adolescents.
Limitation of the study
Due to the cross-sectional nature of the study, it is weak in elucidating cause and effect relationship of variables. Frequency food questionnaire was collected on items consumed by adolescents only for frequency with which adolescents eat listed food. So, it did not include the quantity of food item consumed by adolescents and this may be the limitation of the study to identify calories and nutritional value of food eaten.
This study revealed that the prevalence of undernutrition was high. Sex and age of the respondents and father’s occupation were significantly associated with under-weight and only fathers’ occupation was statistically significant variable associated with chronic malnutrition (stunting) of adolescents on multivariate analysis. Dietary diversity of food for adolescents was below the standard for normal growth and development of adolescents to attain nutritional requirements during adolescence when compared to food pyramid for frequency of food taken.
Frequencies of food item consumed by adolescents were majorly cereals and grains and food for protein source were very low when compared with other food items. Therefore, community based nutrition program should be established to tackle the problem of intergenerational cycle of malnutrition at community level depending on the severity of malnutrition identified in this study. Nutrition education by health extension works should be strengthened to improve the attitude of parents on dietary pattern of adolescents’ particularly dietary diversity and frequency of food eaten by adolescents according to food pyramid of nutrition. Age and gender specific nutrition education program should be provided in the study area for better behavioral changes among adolescents and their families on adolescent nutrition. Continued attention will be mandatory to adolescent dietary practices to meet their nutritional requirements for their spurt physical and mental growth according to their age, sex and residence. District government sectors should strengthen and established income generation activity and saving at households like credit and saving process with collaboration of stake holders to improve family income particularly fathers’ income. Nutrition surveillance needs to be done continuously and special attention should be given to vulnerable groups such as poorest and the most severely malnourished adolescents. Further study should be done to see other unexplored associated factors that were not included in the present study.
The authors have not declared any conflict of interests.
The authors would like to express their sincere gratitude to Wollega University for their support for the accomplishment of this study. The authors are thankful for officials of East Wollega Zonal and Gobu Seyo District health office and education office for their support and cooperation during data collection. They would also like to thank school directors, supervisors and data collectors for taking their precious time to collect the data. They are glad to thank the respondents who participated in this study and took their time to provide information.
REFERENCES
|
Afework M (2009). Nutritional Status of Adolescent Girls from Rural Communities of Tigray, Northern Ethiopia. Ethiopian Journal of Health Development 23:1.
|
|
|
|
Bemnet A (2012). Nutritional status and dietary intake of urban residents in Gondar, Northwest Ethiopia. BMC public health, 12:752. Bisai S, Bose K, Ghosh D, De K (2011). Growth Pattern and Prevalence of Underweight and Stunting Among Rural Adolescents. Journal of Nepal Paediatric Society 31(1):17-24.
|
|
|
|
|
Chukwunonso E Chidi UE, Lawrence EUS (2010). Physical Growth and Nutritional Status of a Semi-Urban Nigerian Adolescents, Pakistan. Journal of Nutrition 9(4):392-397.
Crossref
|
|
|
|
|
Arshad MU (2005). Assessment of Nutritional Status Of Adolescent School Girls At Rawalpindi, R. No. J-5917291: Registration No. OO PGT 2035.
|
|
|
|
|
Federal Democratic Republic of Ethiopia MOH (2009). The Cost of HUNGER in Ethiopia "The Social and Economic Impact of Child Under nutrition in Ethiopia Summary Report "Implications for the Growth and Transformation of Ethiopia.
|
|
|
|
|
Giuseppina D (2000). Nutrition in Adolescence. Pediatrics in Review 21(1):32-33.
|
|
|
|
|
GobuSeyo Woreda Health Office (2013). GobuSeyo woreda health base line profile for woreda based planning, Anno (Unpublished).
|
|
|
|
|
Hajra A (2009). Assessment of Nutritional Status of Adolescents Versus Eating Practices in Islamabad City, Pakistan, Pakistan. Journal of Nutrition 8(8):1304-1308.
|
|
|
|
|
Huruy A, Tefera B, Legesse N (2013). Socioeconomic Factors Associated with Underweight and Stunting among Adolescents of Jimma Zone, South West Ethiopia, Article ID. 238546; 7 p.
|
|
|
|
|
Mukhopadhyay A, Bhadra M, Bose K (2005). Anthropometric assessment of nutritional status of adolescents of Kolkata, West Bengal. Journal of Human Ecology 18(3):213-216.
Crossref
|
|
|
|
|
Literature Review (2011). Infant and Young Child Nutrition Project, Addis Ababa, Ethiopia.
|
|
|
|
|
Mankar M, Joshi S, Velankar D, Mankar J, Anjenaya S (2016). Nutritional status of Adolescents in Rural Area of Panvel. International journal of medicine and allied health sciences 1(1):8-13. Availableat:
View
|
|
|
|
|
Yetubie M, Haidar J, Kassa H, Fallon F (2010). Socioeconomic and Demographic Factors Affecting Body Mass Index of Adolescents Students Aged 10-19 in Ambo (a Rural Town) in Ethiopia. International Journal of Biomedical Science 6(4):321-326.
|
|
|
|
|
*Monira PM, Khyrunnisa B (2003). Nutritional Status and Associated Factors among Urban Adolescent Girls, Dhaka city, Bangladesh.
View.
|
|
|
|
|
Hossain GM, Sarwar MT, Rahman MH, Rouf SM, Raza S, Ud-Daula A, Hossain S (2013). A study on nutritional status of the adolescent girls at Khagrachhari district in Chittagong hill tracts, Bangladesh. American Journal of Life Sciences 1(6):278-282.
Crossref
|
|
|
|
|
National Nutrition Programme (2013). Government of the Federal Democratic Republic of Ethiopia.
View.
|
|
|
|
|
Olumakaiye MF (2008). Prevalence of underweight; a matter of concern among adolescents, Osun state, Nigeria, Pakistan. Journal of Nutrition 7(3):503-508.
|
|
|
|
|
Rajaretnam T, Hallad JS (2012). Nutritional Status of Adolescents In Northern Karnataka, India 58:1.
|
|
|
|
|
Shahid A, Siddiqui FR, Bhatti MA, Ahmed M, Khan MW (2009). Assessment of Nutritional Status of Adolescent College Girls at Rawalpindi, Pakistan, Annals 15(1):11-11.
|
|
|
|
|
Singh S, Kansal S, Kumar A (2012). Assessment of Nutritional status of adolescent girls in rural area of district Varanasi. Indian Journal of Medical Research 6:30-34.
|
|
|
|
|
The World Bank (2006). "Repositioning Nutrition as Central to Development A Strategy for Large-Scale Action," Washington, DC 20433 USA, 1818 H Street, NW: P 272.
|
|
|
|
|
Vashist BM, Goel MK (2009). Nutritional status of adolescents in rural and urban Rohtak, Haryana. Health and Population-Perspectives and Issues 32(4):190-197.
|
|
|
|
|
World Health Organization (2002). Adolescent Friendly Health Services. An agenda for change, Geneva: WHO Publications pp. 5-9.
|
|
|
|
|
World Health Organization (2005). Nutrition in adolescence Issues and Challenges for the Health Sector,Issues in Adolescent Health and Development, WHO discussion papers on adolescence P 1.
|
|
|
|
|
World Health Organization (2006). Adolescent nutrition, A review of the situation in selected South-East Asian countries,New Delhi,Regional Office for South-East Asia P 4.
|
|
|
|
|
Yogesh S, Vartika S (2010). Nutritional Status in Rural Adolescent Girls Residing at Hills of Garhwal in India. Internet Journal of Medical Update-EJOURNAL 6(2).
|
|
|
|
|
Zeleke A (2007). Prevalence of childhood and adolescent overweight and obesity among elementary school students in Addis Ababa: Double burden of malnutrition in Ethiopia, Final Thesis Report, Addis Ababa University P 25.
|
|