Full Length Research Paper
ABSTRACT
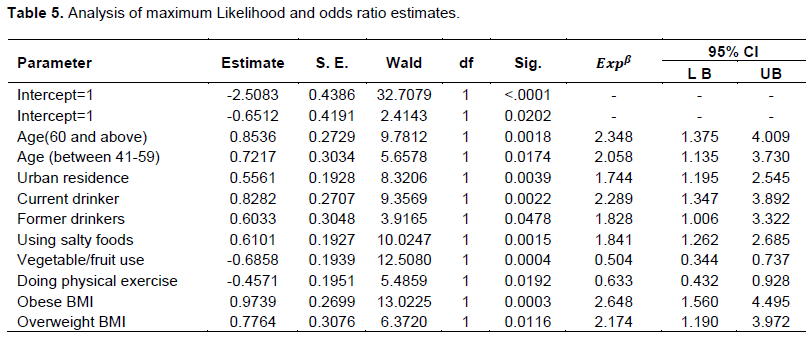
Hypertension is the force of blood pushing up against the walls of blood vessels and it is defined as a systolic blood pressure ≥ 140 mm Hg and/or diastolic blood pressure ≥ 90 mm Hg. It is estimated to cause 9.4 million deaths every year. This study aims to conduct ordinal logistic regression analysis of hypertension severity and identifying associated factors for severity of hypertension, using the data of Gondar Univeristy Referral Hospital, North west Ethiopia. The cumulative logit or the proportional odds regression model is one of the popular choices used to study covariate effects on ordinal responses. The proportional odds model was used to model the severity of hypertension and to identify associated factors for its severity. The fit of the model was illustrated with 420 hypertension records obtained from Gondar University Referral Teaching Hospital (in the chronic illness medication and follow up clinic). Findings of this study show that age of patients (OR= 2.195, P = 0.0051), residence (OR= 1.954, P = 0.0008), alcohol use (OR= 2.329, P = 0.0027), using salty foods (OR= 1.970, P = 0.0007), habit of using vegetable/fruit (OR= 0.516, P = 0.0010), doing physical exercise (OR= 0.571, P = 0.0062) and BMI (OR= 3.293, P <0.0001) had significant association with severity of hypertension. Polices and plans have to be put in place to motivate vegetable/fruit users, to decrease the consumption of salty foods, non-alcohol drinkers, normal body mass index and concerned bodies need to implement hypertension prevention strategies.
Key words: Hypertension severity, ordinal logistic regression, proportional odds model.
Abbreviation: AIC, Akaike information criteria; BMI, Body mass index; GoUTH, Gondar university teaching hospital; HTN, Hypertension; OLR, Ordinal logistic regression; OR, Odds ratio; OPD, Outpatient department; PO, Proportional odds; POM, Proportional odds model; PPOM, Partial proportional odds model; WHO, World health organization; WHOROEM, World health organization Regional office for the Eastern Mediterranean.INTRODUCTION
Hypertension is the force of blood pushing up against the walls of blood vessels and it is defined as a systolic blood pressure ≥ 140 mm Hg and/or diastolic blood pressure ≥ 90 mm Hg. The risk of dying from high blood pressure in low- and middle-income countries is more than double that in high-income countries. In the high income countries, only 7% of deaths caused by high blood pressure occur under age 60; in the African Region, this has increased to 25% (WHO, 2010). Non-Communicable Diseases (including hypertension) are becoming an increasingly important public health problem as epidemiological transition is progressing in Ethiopia (Awoke et al, 2014).World Health Organization reported that the prevalence of hypertension in Ethiopia was 35.2% for the crude adjusted estimates of both sexes (WHO, 2010).
Hypertension is the growing public health problem in many developing countries including Ethiopia. However, its prevention, early diagnose and control have not received greater attention. Hypertension does not have its own signs and symptoms like other chronic disease and its treatments are not given on time. It causes many deaths before it is treated, and it is usually known as silent killer disease. Hypertension increases the risk of ischemic heart disease, stroke, peripheral vascular disease and other cardiovascular diseases, and is also a risk factor for cognitive impairment and dementia and chronic kidney disease (Assefa et al., 2014). In this study, by classifying the severity of hypertension as severe, moderate and mild ordinal logistic regression model was applied to assess the effect of multiple covariates in different levels of hypertension severity.
MATERIALS AND METHODS
Description of the hypertension data
The target population of this study was hypertensive patients at Gondar University Hospital chronic illness medication and follow up clinic; their age is age ≥18 years. Theyw came to this clinic before April 30, (2016) for hypertension treatment (continuation or check-up). So the data were collected from February 1 to April 30, 2016 for three months. The total numbers of patients that started hypertension follow up treatment were 482. From the total patients, only 420 patients had a complete outcome and were available at this three month of data collection period. 29 patients did not come to the clinic during their appointment (check-up) time and the charts of 33 patients were not recorded in the data properly; hence they are excluded from the study.
Inclusion and exclusion criteria
The study considers all hypertensive diseased patients in chronic illness medication and follow up clinic; their age is 18 years, and they started hypertensive follow up treatment before April 30, 2016. They came for check-up during their appointment time for three months. However, the study excludes those patients on hypertensive follow up treatment whose age < 18 years and patients who did not come to the clinic during these three months; patients who had an appointment time of more than three months. Disabled hypertensive patients were also excluded from the study.
The dependent variable for this study is the severity of hypertension which is reviewed from their medical charts. This includes mild, moderate and severe level of hypertension. The severity (level) of hypertension was classified from the blood pressure measurement of two numbers systolic and diastolic reading in mmHg and according to the World Health Organization criteria for severity of hypertension classified as mild (systolic 140-159, diastolic 90-99), moderate (systolic 150-179, diastolic 100-109) and severe (systolic 180, diastolic 100) [WHO, 1999].
This study considers many explanatory variables, including socio-demographic variables (Age (in year), sex (M, F), marital status (Single, Married, Others), level of education (Illiterate, Informal education, Formal education)), lifestyle factors (Diet, alcohol use, smoking, physical activity), co-morbidity (Obesity, kidney Disease, Diabetes mellitus) and genetic and family related factors (Family history Hypertension). The duration that these respondents have been hypertensive was not taken into consideration as independent variable for this analysis.
Ordinal logistic regression model
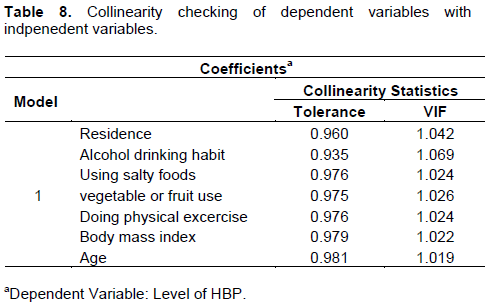
SAS statistical software was used for the analysis. The issue of correlation among independent variables (multicolinearity) has been checked by using tolerance and variance inflation factor (VIF) method. Logistic regression model can be classified as multinomial, ordinal and binary. In this investigation ordinal logistic regression model was used.The ordinal logistic regression procedure empowers one to select the predictive model for ordered dependent variables. Logistic regression model can be classified as multinomial, ordinal and binary. In this investigation ordinal logistic regression model was used. The ordinal logistic regression procedure empowers one to select the predictive model for ordered dependent variables. The ordinal logistic regression model describes the relationship of an ordered response variable and a set of explanatory variables. The explanatory variables may be continuous or discrete (or any type). The explanatory variables may be continuous or discrete (or any type).
Ordinal response models have major importance in social sciences as well as demography and many social phenomena. The responses are discrete or qualitative rather than continuous or quantitative in nature. Hypertension is the continuous variable, but here it has been changed of ordinal by classifying as severe, moderate and mild. Many such analyses involve an outcome or dependent variable that is ordinal and in this study the logistic regression model was the statistical model of choice. The most popular model in ordinal logistic is the proportional odds model.
Proportional Odds (PO) model
Proportional odds model is used as a tool to model the ordinal nature of a dependent variable by defining the cumulative probabilities differently instead of considering the probability of an individual event. It considers the probability of that event and all events that are ordered before it. When response categories are ordered, logits can directly incorporate the ordering.
Uni-variable ordinal logistic regression analysis
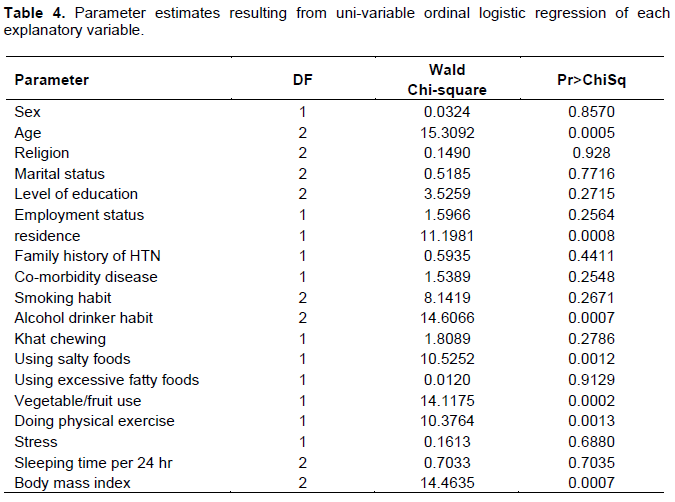
Nineteen variables were selected and 19 uni-variable ordinal logistic regression models were developed to assess the relationship between severity of hypertension and the selected variables. Any variable whose uni-variable test has a p-value≤ 0.25 will be a candidate for Multiple Ordinal Logistic Regression Analysis.
Multiple ordinals logistic regression analysis
Once the variables were identified by uni-variable ordinal logistic regression analysis, we began with a model containing all of the selected variables. The variables, Age of patients, Residence, Alcohol use, using salty foods, habit of using vegetable/fruit, doing physical exercise, BMI are found significant to be entered into the multiple ordinal logistic regression analysis.
RESULTS
This study used hypertension data collected from hypertension diseased patients linked to Gondar University Hospital chronic illness medication and follow up clinic. Four hundred twenty hypertension diseased patients were included. From the total hypertension diseased patients’ data 44.5% (187) were severe, 35.2% (148) were moderate and 20.2% (85) were mild (Table 1). Table 2 shows the distribution of socio-demographic related variables with the severity of hypertension. 44.23, 35.10 and 20.67% men had severe, moderate and mild hypertension as compared to 44.81, 35.38 and 19.81% women, respectively. Other variables also can be interpreted in a similar way.
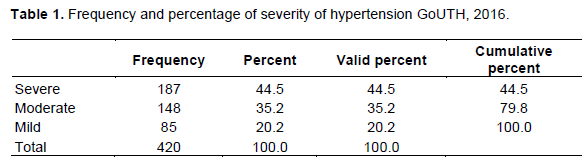

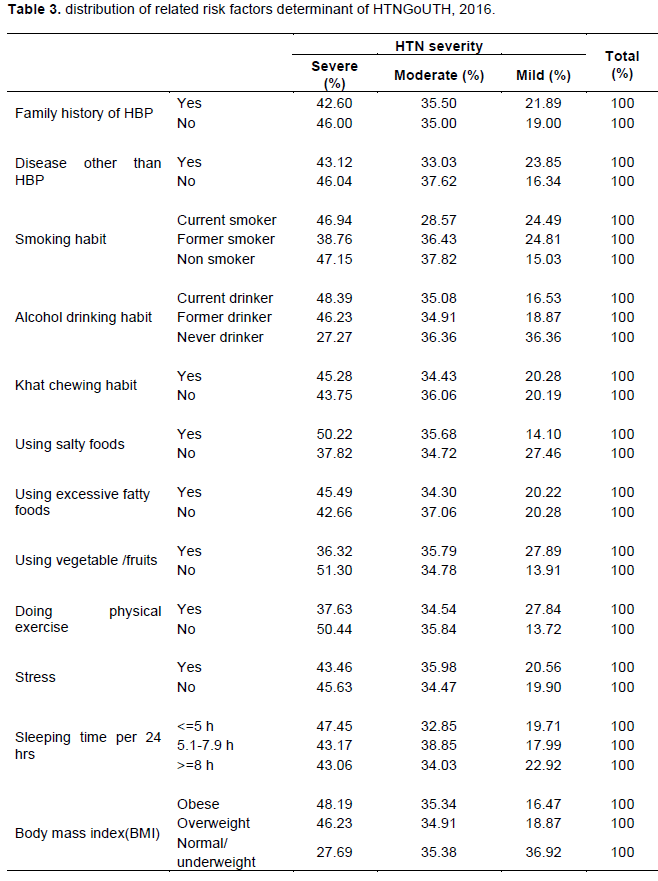
Table 3 shows the distribution of risk factor variables related with the severity of hypertension. 42.6% of individuals who have hypertension in their family had severe hypertension as compared to 46% of individuals who do not have hypertension in their family. 35.5% of individuals who have hypertension in their family had moderate hypertension as compared to 35% of individuals who do not have hypertension in their family. Similarly, 21.89% of individuals who have hypertension in their family had mild hypertension as compared to 19% of individuals who do not have hypertension in their family. Similarly, other variables can be interpreted like this.
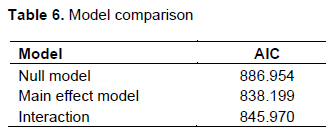
The result of Akaike’s Information Criteria (AIC) suggests that the main effect model is reasonable since a model with low AIC is preferred model. Therefore, a cumulative consideration of the above tests confirmed that the main effect model is appropriate. The models can be also compared by using BIC value. From the SAS output the -2log likelihood values for main effect and interaction effect model are 780.199 and 639.970, respectively. This implies that the BIC values of the two models are 851.0254 and 904.9132, respectively. Since the main effect model has smaller values, it is concluded that the main effect model is appropriate (Tables 4 to 6). The hypothesis that the model adequately fits the data can be examined by the Pearson and Deviance tests.
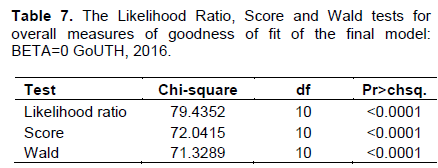
The result reveals that the goodness of fit test is fulfilled, which is confirmed by both the deviance and Pearson with P-values of 0.2124 and 0.6325, respectively.
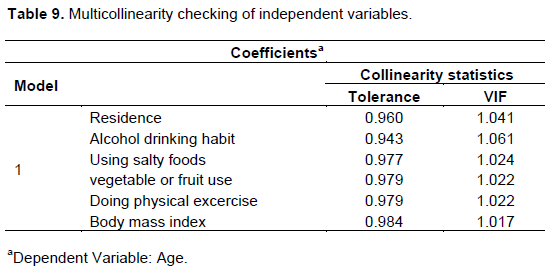
Consequently, the observed and expected cell counts are similar and the value of each statistic is small (Table 7). As shown in Table 8, the tolerance of all the variables greater than 0.1 implies there is no a problem of collinearity between the dependent and independent variables. Moreover, the VIF values are greater than 10, which indicates there is no problem of mulitcollinearity. As shown in Table 9, the tolerance of all the variables greater than 0.1 implies there is no a problem of multicollinearity between age and other independent variables.Moreover, the VIF values are greater than 10, which indicates there is no a problem of mulitcollinearity between age and other independ variables.Similarily, we can continoue for other independent variables.
DISCUSSION
The study shows that there is significant association between age of patients and the severity of hypertension. Older age group patients (that is, 60 and above), who develop hypertension belong to “severe hypertension” category and they are also liable to high prevalence of hypertension. The result is consistent with Mulugeta (2015), Assefa et al. (2014), Kassawmar et al. (2015), Mungati et al. (2014), Erhun et al. (2005), Marwiro (2012) and Kumar et al. (2002) that age [being aged] has significant effect on the occurrence of hypertension. This study also agrees with national academy on an aging society.
There is a significant difference in developing hypertension between urban and rural residences. This shows that people living in urban areas have a high risk of developing hypertension than people living in ruralareas. The study result is consistent with Iwelunmor et al. (2014). The study shows that there is significant association between alcohol drinking habit of patients and the severity of hypertension. Current alcohol drinker individuals are more likely to develop severe hypertension than never drinker individuals. This implies most current alcohol drinker individuals who develop hypertension belong to “severe HTN” category and they are also liable to high prevalence of hypertension. This result of the study agrees with that of Mulugeta (2015), Erhun et al. (2005), Birhanu (2014) and Kumar et al (2002); alcohol drinking was a significant factor of hypertension. There is high significant difference between individuals with excessive salty food user and non-users in terms of developing hypertension. That is, individuals who are salty food users are more likely to develop “severe hypertension” than those non-users. In addition, the result reveals that the overall prevalence of hypertension is high with those individuals who are salty food users. This result of the study agrees with that of Seid (2014), Mulugeta (2015) and Mizumoto (2004); use of excessive salty foods was the significant factor of hypertension.
There is a high significant difference in developing hypertension between individuals who are physically active and not physically active individuals. Among all hypertension developed in physically inactive individuals most of them belong to “severe hypertension” category and it is also responsible for high incidence of hypertension. This shows people who are physically inactive are at a high risk of hypertension than physically active individuals. The study result is consistent with Seid (2014), Mulugeta (2015), Akilew et al. (2012) and Kumar et al. (2002) that not doing physical activity is significantly associated with hypertension.
The study shows that there is significant association between body mass index of patients and the severity of hypertension. Obese individuals are more likely to develop severe hypertension than normal/underweight body mass index individuals. This implies most “obese body mass index” individuals who develop hypertension belong to “severe hypertension” category and they are also liable to high incidence of hypertension. The study result is consistent with Seid (2014), .Mulugeta (2015), Henok (2014), Assefa et al. (2014), Kassawmar et al. (2015), Jenei et al. (2002), Erhun et al. (2005), Akilew et al. (2012), Marwiro (2012), Mizumoto (2004), Birhanu (2014), Jasmine et al. (2013), Kumar et al. (2002) that body mass index was a significant factor of hypertension.
CONCLUSIONS
RECOMMENDATION
Based on the findings of this study, the following issues should be considered and promoted for improving the prevention of hypertensive condition in community people. The government and concerned bodies should work on the preventive strategies of hypertension including promoting and advocating healthy lifestyles, by improvement of dietary habits, eradication of alcohol consumption, decreasing the consumption of salty foods, increasing physical activity and encouraging vegetable or fruit users.
LIMITATION OF THE STUDY
One of the limitations of this study is all patients who were proposed to be included in the study did not come to the clinic during the three months of data collection time and hence the proposed sample size decreased. The other major limitation of this study is related to the problem of the availability of complete secondary data. Patients did not volunteer to give response during primary data collection. Some variables were not included in the study due to lack of equipment and limitation of resource or budget (like waist-to-hip ratio).
CONFLICT OF INTERESTS
The authors have not declared any conflict of interests.
REFERENCES
|
Akilew A, Awoke T, Alemu S, Megabiaw B (2012). Prevalence and associated factors of hypertension among adults in Gondar, Northwest Ethiopia: a community based cross-sectional study. BMC cardiovascular disorders 12(1):1-6. |
|
|
Assefa Z, Haftu G, Alemayehu K (2014). Prevalence and associated factors of hypertension among adult population in Mekelle city, Northern Ethiopia.Internationaljournal of innovative pharmaceutical sciences and research 2(3):653-668. |
|
|
Awoke M, Damen HM, Ahmed A, Tekebash A (2014). Epidemiology of Major Non-communicable Diseases in Ethiopia: A Systematic Review. BMC journal of Health, population and nutrition 32(1):1-3 |
|
|
Erhun WO, Olayiwola G, Agbani EO, Omotoso NS (2005). Prevalence of hypertension in a university community in South West Nigeria. African Journal of Biomedical Research 8(1):15-19. |
|
|
Jasmine S, Sundar S. JosephMaria AS. Parameswari VS, Kalpana S, Shantharam D (2013). Prevalence and determinants of hypertension among urban school children in the age group of 13-17 years in, Chennai, Tamilnadu. Epidemiol 3(130):2161-1165. |
|
|
Jenei Z, Pall D, Katona E, Kakuk G, Polgar P (2002). The epidemiology of hypertension and its associated risk factors in the city of Debrecen, Hungary. Public health 116(3):138-144. |
|
|
Iwelunmor J, Collins OA, Richard C, Bamidele T, Plange-Rhule J, Richard A, Gbenga O (2014). Prevalence determinants and systems-thinking approaches to optimal hypertension control in West Africa. Globalization and health 10(1):1-8. |
|
|
Kassawmar A, Dadi AF, Alene KA (2015). Prevalence of hypertension among federal ministry civil servants in Addis Ababa, Ethiopia: a call for a workplace-screening program. BMC cardiovascular disorders 15(1):1-6. |
|
|
Kumar P, Desai VK, Kosambia JK (2002). Prevalence of hypertension amongst the employees of a mega industry of South Gujarat. Indian Journal of Community Medicine 27(1):19. |
|
|
Marwiro A (2012). Prevalence and Risk Factors for Hypertension among Bulawayo City Council Employees, 2010 . |
|
|
Mizumoto K (2004). Hypertension and risk factors related to lifestyle among women aged 40 years and over in Phuthamon district, Nakhon Pathom Province, Thailand. (Unpublished MPHCM thesis) Mahidol university, Thailand. |
|
|
Mulugeta M (2015). Systematic Reviews of Prevalence and Associated Factors of Hypertension in Ethiopia: Finding the Evidence. Science Journal of Public Health 3(4):514-519. |
|
|
Mungati M, Manangazira P, Takundwa L, Gombe N, Rusakaniko S, Tshimanga M (2014). Factors affecting diagnosis and management of hypertension in Mazowe Districtof Mashonaland Central Province in Zimbabwe: 2012.BMC Cardiovascular Disorders 14(1):1-12. |
|
|
Seid H (2014).Evaluation of the risk factors of hypertension in patients visiting adult emergency outpatient department of TikurAnbessa specialized hospital. (Unpublished MEMC thesis), Addis Ababa University, Addis Ababa, Ethiopia. |
|
|
World Health Organization (WHO) (1999). International Society of Hypertension Guidelines for the Management of Hypertension |
|
|
World Health Organization (WHO) (2010). Global status report on noncommunicable diseases. |
|
|
World Health Organization (WHO) (2010). A global brief onHypertensionL'.Marvin M, m.d. High blood pressure. |
|
Copyright © 2024 Author(s) retain the copyright of this article.
This article is published under the terms of the Creative Commons Attribution License 4.0


