Full Length Research Paper

ABSTRACT
This study aims to examine if, when holding socio-economic, bio-demographic and healthcare covariates constant, geospatial indicators help to explain variations in the under-five mortality rate across wards from a high focus district of Misungwi in Tanzania. Data were collected from a 2019 survey which canvassed 540 households with 471 women aged 15-49. A total of 737 live births that occurred during five years preceding the survey were analysed. Of all the children born, 46 had died before survey interviews were carried out. Under-5 mortality rates in 27 clusters were calculated. The spatial autocorrelation of under-five mortality rates was estimated by global Moran's index (I). Thematic maps were generated with these rates. The software TerraView 5.4.1 was used for spatial analysis. The results showed substantial cluster-level spatial variations in childhood mortality in the district. Among all the under-five children analysed, the mortality rate was 56 deaths per 1000 live births. The average global Moran's index (I) was I=0.05 for child mortality rate. All global Moran's indices showed p-values <0.05. Thematic maps showed clusters of villages with high rates located closer to streams and further from transport routes. The geospatial factors associated with mortality indicate variability due to exposure and transmission of infectious diseases. These results provide an improved understanding of district level under-five mortality and help in the execution of health policies.
Key words: Geographic differentials, deaths, global Moran’s index, health management, Tanzania.
INTRODUCTION
The Tanzania Government recognizes that sustainable development and transition to middle income status is determined by the health of the Tanzanian people. To that end, Tanzania has strived to attain Goal 3 which is focussed on ensuring healthy lives and promoting well-being for all at all ages. Specifically this goal strives to minimize under-five mortality to less than 25 deaths per 1,000 live births across all countries by 2030. The Sustainable Development Goal (SDG) is being implemented in the framework of the Tanzania Development Vision and the Five Year Development Plan. Tanzania was said to be on track for its Goal 3 target, reducing the under-five mortality rate down to lesser than 54 deaths per 1,000 live births by the year 2013. However, the major concern has been the diminution of under-five mortality has been gradual compared to neonatal and infant mortality. Therefore, with this level of decline, Tanzania is likely to miss its SDG target of 25/1,000 live births by 2030.
At the global scale, there has been progress in reducing child mortality. For the first time in documented history annual childhood deaths have dropped below 9 million, from 12.5 million in 1990 to 8.8 million in 2008. The child mortality rate in developing countries has declined from 91 deaths per thousand live births in 1990 to 43 in 2015 and recent survey data show remarkable advances in various basic child survival programmes that are anticipated to provide additional reductions in under-five mortality in the few years ahead. However, only 30% of the advancement presently needed to be on target to achieve SDG 3 has been attained.
In the social sciences domain there is a large pool of research literature related to levels, trends and determinants of childhood mortality examples being Liu et al. (2016). Estimates coming from majority of developing countries seem to suggest a slower decline and in some instance an increase in under-five mortality. Global figures presented in this section show that a lot remains to be done in-order to reduce under-five mortality worldwide. Under-five mortality rates have declined at a remarkable pace of nearly 3 percent per year between 1990 and 2015. Currently the rates are about 45 percent lower than in 2015, suggesting a global health transition characterised by a steady decline in mortality data (Global Health Observatory (GHO), 2017). Akinyemi et al. (2015), emphasizing the same point, assert that this transition can be traced back to the 1900s. The transition became more and more evident from that time until the 2000s.
Sub-Saharan Africa in particular has not made progress at the same speed with the global pattern where under-five mortality has decreased from 163 per 1000 live births in 1990 to 100 per 1000 live births in 2011(Committing to Child Survival: A Promise Renewed Progress Report, 2015). Under-five mortality in the region declined by only 28% between 2010 and 2015; yet in other developing regions such as Eastern Asia, Western Asia, Southern America and the Caribbean, Northern Africa and South-eastern Asia under-five mortality shrunk by more than 50 per cent (You et al., 2015). Many countries in sub-Saharan Africa still experience mortality above 50 deaths per 1000 live births triggering a concern that countries in this region have missed the former Millennium Development Goal (MDG) number 4 (1) and now SDG number 3 which was to be achieved in 2015 (World Health Organization, (WHO, 2017)). This is reaffirmed by the United Nations (UN, 2018) which notes that while it is commendable that world-wide mortality has declined, Africa still contributes a higher percentage than the rest of the world. Golding et al. (2017) indicate that in 2017 alone, while the rest of the world recorded 39 under-five deaths per 1000 live births, sub-Saharan Africa’s under-five mortality rates stood at about 72 deaths for every 1000 live births. The situation is worsened by the reality that the main determinants of under-five mortality in developing countries especially in Sub-Saharan Africa are due to conditions that have been declared preventable and treatable, which according to United Nations Children's Fund (UNICEF) et al. (2018) include neo-natal causes, pneumonia, diarrhoea, malaria and acquired immunodeficiency syndrome/ human immunodeficiency virus (HIV/AIDS). The same report states that these five top killer diseases can be prevented using simple and affordable interventions. What is needed is the revived energy to reduce the incidence of these diseases among children in sub-Saharan Africa as these diseases account for 90% of child deaths (WHO, 2017).
In Tanzania, under-five mortality has been decreasing over time. The National Bureau of Statistics (NBS) for example, posits that child mortality dropped from 231 in 1978 to 67 per 1000 live births in 2012 (United Republic of Tanzania (URT, 2015)). Improving health outcomes in Tanzania is a central development objective of the Irish Aid as outlined in its Health Policy and White Paper. Tanzania holds the 27th position in the global list with high-level under-five mortality rate of approximately between 130 and 150 per 1000 live births (Susuman and Hamisi as cited in Byaro and Musonda, 2016). In the immediate past, under-5 mortality analysis has been critical in evaluating progress towards the SDG 3, which aims to reduce under-5 mortality rates to at least as low as 25 per 1000 births by 2030 (UN, 2015). Tanzania has witnessed significant improvements in child health of bringing down deaths of under-five children. By 2015-2016, the under-five mortality rates had declined from 147 to 67 deaths per 1,000 live births (Tanzania Demographic and Health Survey and Malaria Indicator Survey (TDHS-MIS 2015-16)). Some important achievements which have led to this advancement include strong development in expanding vaccine coverage in all regions and victorious activities to prevent and treat malaria among children (Afnan-Holmes,et al., 2015; Kruk et al., 2015). Current data support the fact that under-five mortality rates have substantially declined but with less satisfaction to attain the sustainable development goal number three (Susuman and Hamisi as cited in Byaro and Musonda, 2016).
The Current Policy Framework of Tanzania dates back to 2013, when the country’s Ministry of Health, Community Development, Gender, Elderly and Children assessed its national medium-term maternal, neonatal, and child health strategic plan called “the One Plan” with a view to speed up the country’s progress toward the former MDGs 4 and 5 in the 500 days that were then remaining. The outcome was the birth of the “Sharpened One Plan” (launched in April 2014), which focuses on programmes being implemented in two of the country’s poorest, most rural zones-Lake and Western. Of particular concern in these zones is the fact that infant and child mortality is high and disparities between urban and rural uptake of services are still substantial.
In terms of spatial heterogeneity for under-five mortality in Tanzania, part of the problem in understanding this phenomenon lies in the driving factors of the mortality rates (Pezzulo et al., 2016). In general, Tanzania is among the countries in Africa which have the highest burden of under-five deaths. Conceivably, it is owing to having slow paced rates of progress in many of the crucial drivers of mortality such as stunting, gastroenteritis, diarrhoea, malaria and the lowest rates of insecticide-treated bed net use (UNICEF, 2015). Variations in health have also been identified at sub-national levels in a wide assortment of literature such as Arku et al. (2016), Colson et al. (2015), Roberts et al. (2015) and Wollum et al. (2015) which stresses the need for analysis of health indicators in small geographic units to aid in the identification of areas of greatest need and a more targeted, efficient allocation of resources (Arku et al., 2016; Burgert-Brucker, 2015). Several studies have also investigated the socio-economic aftermath on under-5 mortality in general (Aheto, 2019; Oyekale and Maselwa, 2018); however very few studies have either highlighted how biophysical and geographic factors affect health inequalities or measured under-five mortality in Tanzania.
Conceptual framework
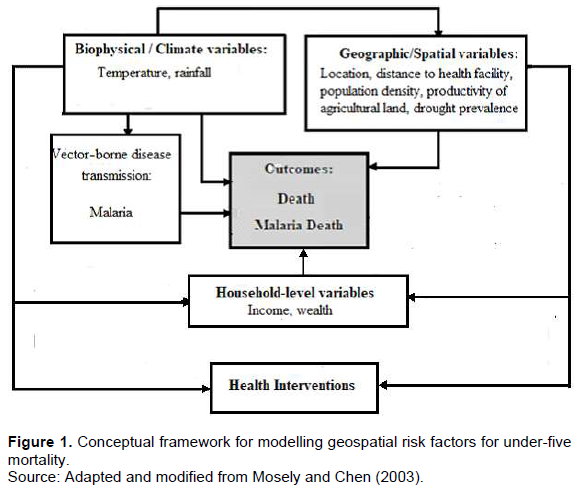
Several frameworks have been developed to study child mortality. Most common is the Mosley and Chen (1984)’s analytical framework for the study of child survival in developing countries which allows for incorporating both social and biological sciences in the study of determinants of child mortality. The Mosley and Chan framework is based on the assumption that all social and economic (distal) determinants of child mortality act through a defined set of proximate determinants with clear biological pathways to affect child mortality (Mosley and Chen, 1984). They grouped these proximate factors into five categories: Maternal factors, Environmental contamination, Nutrient deficiency, Injury, and Personal illness control. Some studies have allowed for these proximate variables to affect mortality at different levels (country, household, individual etc.) and at different age groups. Building on the Mosley-Chen model, the conceptual framework of this study (Figure 1) opines that although the socio-economic and demographic variables are important for determining child mortality, the interaction of biophysical and geographic factors (Environmental contamination) with individual and household characteristics determines the actual outcomes. The conceptual framework seeks to determine and provide an analytical explanation to the significance and importance of biophysical and geographic factors in influencing under-five mortality by holding socio-economic and demographic factors constant.
As shown in the framework of this study, the biophysical covariates considered include temperature and rainfall. Change in climate is described to lead to proliferation of increasing numbers of vectors known to transmit infectious diseases, or enhance the replication rate of virus and bacteria affecting the transmission of food and waterborne diseases (Cisse, 2019). The importance of seasonality on child survival is also shown in the conceptual framework by Mosley and Chen (2003) which suggests that child survival chances are due to operation of biological, social economic and environmental forces. In the framework, seasonality is grouped together with climate, rainfall and temperature under the ecological setting of community level factors (Mosley and Chen, 2003). These ecological factors affect not only the availability of food, but are said to influence mothers’ attention to their children, especially during the rain seasons when water and sanitation conditions become jeopardized.
Other studies have also examined the relationship between rainfall or season and mortality (Sewe et al., 2015; Wichmann, 2017). These studies observed that under-five mortality was significantly higher in the rainy season. Geographic variables such as location or where an individual lives can have effect on accessibility such as access to health facility, good drinking water, food and others which can lead to mortality. The distribution of disease and deaths outcomes have been found to vary both in space and in time (Musenge et al., as cited in Tlou et al., 2017). This is as a result of remoteness of health facility, location, environment, or intervention disparities. The total number of household members (household size) has also been found to influence infant and child mortality. Studies by Adeoti and Oni (2018) and Nasejje et al. (2015) found that household size significantly affects child mortality rates in Nigeria which suggests that increase in household size may worsen infant mortality rates given low household income in Nigeria.
Concerning productivity of agricultural land, Sharma et al. (2015) used rates of child malnutrition as a poverty indicator and calculated their distribution over the FAO agro-ecological zones. They found that globally 58.5% of malnourished children in developing countries are located in the warm tropics, 26.8% in the warm subtropics and 14.7% in the cool tropics. They did not find a clear link between child malnutrition and agricultural productivity; however; high rates of malnutrition were found in areas of both high and low productivity. Contreras (2019), on the other hand, found that children living in areas with the shortest growing seasons, classified as arid and semiarid, had a higher risk of death.
Unfavourable climate and drought conditions are other factors that negatively affect food availability and production, hence affects the levels of under nutrition (Akombi et al., 2017). Drought is one of Africa’s most common natural disasters and drought is expected to become an increasing source of income shocks in developing countries (Intergovernmental Panel on Climate Change, 2018). Abdullah et al. (2019) found that insufficient rainfall affects household income negatively, hence lowering investments in the household’s children which increases the risk of malnutrition. Misungwi’s population is highly dependent on rain-fed agriculture for their main source of food and income. For example, the main staple food in the district is maize, which is especially sensitive to rainfall shortages that interrupt the growing season (URT, 2017). Misungwi is also often affected by drought and the occurrence of drought is expected to increase in the future due to climate change. Dimitrova (2020) finds that children in households where the mother occupation is in agriculture are more vulnerable to drought.
Access to water and sanitation can have effect on the care seeking behaviour and health outcome of a household member. Poor water source and sanitation facilities are linked to negative health outcomes and as such increase under-five mortality (Headey and Palloni, 2019). The primary objective of this study is to investigate the effects of the biophysical and geographic contextual factors on under-five mortality in Misungwi District. The underlying motivation was to account for the aerial variation that has not been explained by the traditional set of socioeconomic and bio-demographic causal elements of childhood mortality. The null hypotheses, in this study, are two. The first is that there is no association between under-five mortality and the biophysical and geographic risk factors and the second is that the spatial distribution of under-five mortality rate is random, contrast to the alternative hypothesis.
MATERIALS AND METHODS
Study area and population
The Survey was conducted in Misungwi District, in an area of 2,553 km2 (Figure 1). The study covered 27 Enumeration Areas representing clusters. Misungwi District, with a population estimate of 351,607 in 2012 (URT, 2013), had 45 health facilities across Misungwi District, 39 dispensaries, 4 health centres, and 2 hospitals, one of these being a district hospital. The district was selected because of its rural setting, health care structure, and being among high focus districts of the Lake Zone.
The region of Mwanza is one of the three regions in northern Tanzania which are racked with a widespread presence of under-five mortality. Misungwi district is one of the eight rural districts of Mwanza Region constituting part of the Lake zone, which is regarded to have amongst the worst indices in the health of the under-fives in the country. While the national rate for under-five mortality decreased from 112 per 1000 live births in 2003-2004 to 81 per 1000 births in 2010 and now at 67 deaths per 1,000 live births (Ministry of Health et al., 2016), the rate for the Lake zone surpasses the national average at approximately 88 per 1000 live births (Ministry of Health et al., 2016). This record level under-five mortality rate in the Lake zone is closely associated with lack of successful child-survival interventions. The zone has been pin-pointed by the Big Results Now (BRN) development policy as a prime concern for Maternal and Child Health programmes.
The area where this study took place comprises a flat land characterised by gentle hills drained by small seasonal streams terminating into Lake Victoria. Few paved or public transport roads exist in the area, with walking being the main means of transport. Rainfall occurs seasonally, with the heaviest rains usually falling in November-May. Total annual rainfall averages approximately 1400 mm/ year. The residents are subsistence farmers growing mainly maize, sorghum, and groundnuts. The inhabitants are relatively poor. In terms of average intensity of poverty, Mwanza region (Misungwi district inclusive) was ranked 14th, with 46.55% of its population facing severe poverty intensity, compared to 45.48% for the whole country (URT, 2017) (Figure 2).

Study design and sampling
The study design adopted is a cross-sectional household survey conducted in Misungwi District in 2019. The study employed a mixed-methods approach to study the under-five mortality pattern. The sampling frame for the survey was made up of a list of enumeration areas taken from the 2012 Population and Housing Census. The design was similar to other household surveys that had earlier been conducted in Tanzania. To keep the survey cost and data collection manageable, a cluster sampling approach was used. A sample of households for the survey was selected by cluster sampling using the Census Enumeration Area (EA) as a cluster. A stratified multi-stage sampling design was used for this survey. The principal sampling units selected at the initial stage were the enumeration areas (EAs), which are small operational areas defined on maps for the 2012 Census enumeration. The selection of (EAs) as primary sampling units (PSU) from the Census frame of the district was done using systematic sampling with probability proportion to size (PPS). The yardstick of size that was used is the number of households within an EA. The second stage involved systematically selecting a fixed number of 20 households (all in one village) per selected EA. Misungwi district had a total of 543 EAs in the previous census. A sample of EAs was selected at random with equal probability by systematic sampling. A sample size constituting 27 EAs representing clusters was finally selected for the district estimate. From this list, a representative probability sample of 540 households was achieved. This sample is self-weighting and cluster estimates could be obtained easily.
Demographic surveillance procedure
All members of the 540 participating households were enumerated. One woman aged 15-49 who was a resident in a selected household was regarded as eligible for the interview. Finally, a total of 471 women were interviewed as some households had no eligible woman for the interview. All births and deaths were documented. To capture all births and deaths, village reporters were recruited from the communities, and trained to record all births and deaths in their villages. Two trained clinical officers independently reviewed each verbal autopsy questionnaire and assigned a single most likely cause of death according to the standards of interpretation of verbal autopsies.
Data
A database from the Household Survey (HS) conducted in the District in early 2019 was created, which included all cases of under-five child deaths. From this database, mortality rates were calculated per 1,000 live births by clusters (N= 27) of the district of Misungwi. The rates refer to all deaths in the under-five period in relation to all births in the period of 2011-2015. Mortality of the under-fives (5q0) is defined as the probability that a child born in a precise year or period will die before reaching the age of five, subject to current age specific mortality rates (ASMR). It is expressed as a rate per 1000 live births. In this particular study, the rates were calculated directly from the child’s birth history especially birth date, survivorship status, and age at death. Since this analysis considers children between ages 0 and 5, factors associated with the probability of dying between the age 0 and 5 were considered. The statistical significance level was set at p < 0.05.
The software program TerraView 5.4.1, developed by the National Institute of Space Research (INPE), was used for the spatial analysis of micro-regions (Clusters) of the district of Misungwi. The spatial autocorrelation of neonatal mortality rates was estimated by global Moran’s index (Moran, 1950). The units of analysis of this work are clusters (called wards), which correspond to administrative level one. The data are statistically representative estimates of each indicator of interest for the population within each TDHS-MIS 2015/2016 enumeration area at the time of the survey. To estimate geophysical differentials for certain demographic indicators, Misungwi district was divided into 27 wards which are administrative areas. This classification system allowed for a relatively large number of people in the denominator and a reduced sampling error
GPS mapping of the household survey
Village health facility locations and roads including the Lake Victoria shore and streams within the study area were collected using a hand-held global positioning system (GPS). Data were fed with differential correction into a GPS database. GPS coordinates of interviewee residences and distances to nearby locations were calculated.
Study variables
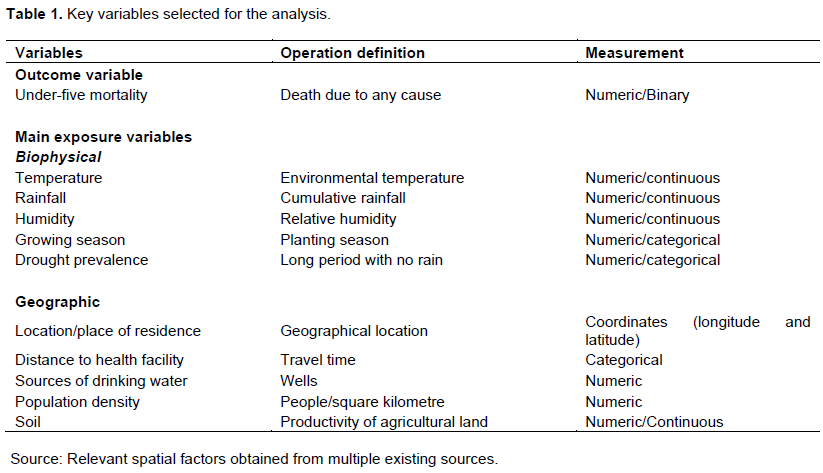
The selection of independent variables in this study was guided by the reviewed literature and by the theoretical foundation established from the reviewed literature. Empirically, the selected independent variables in this study are those known to have influence on child survival as established in the literature. The dependent variable of this study is the under-five mortality rate (U5MR), which is considered as the prime index for assessing the progress of the SDG 3. The study estimated the differences in U5MR through a set of independent variables. The pivotal predictors of the study included biophysical and geographic variables controlling for health and socioeconomic indicators in the district. Table 1 presents a brief account of all the initial variables selected for this study.
The biophysical variables include temperature and rainfall. The annual rainfall (in mm) for Misungwi District was averaged from the Tanzania Meteorology Authority estimates for five years (2011-2015). The basis for the selected variables is that a number of studies have investigated the effect of temperature on mortality and most of these have demonstrated that temperature was associated with mortality (de’Donato et al., 2015; Kim et al., 2015). In particular, they observed that temperature was associated with under-five malaria/ anaemia mortality. They observed a non-linear relationship between temperature and malaria mortality. Similarly, a number of studies have examined the relationship between rainfall or season and malaria under-five mortality (Midekisa et al., 2015; Mbouna et al., 2019) and observed that mortality peaked during the rainy season.
Weather variability can cause death directly or indirectly. Extreme weather events can affect human health through the transmission of vector-borne, water-borne and food-borne diseases. Weather variability can also affect health indirectly through its effect on individual or household income. Households can get economic shocks through weather variability as a result of its negative effect on agricultural produce (Haile et al., 2018). The length of the growing season has long been associated with agricultural productivity (Mueller et al., 2015). Seasons of fewer than 70 days are considered too short for sustainable agriculture. Variation in average daily rainfall has a larger impact on under-five children. One explanation for this is that their dietary needs are much more varied and dependent on agricultural production.
Quattrochi (2019) used indirect methods to estimate levels and trends of mortality in Malawi and Tanzania. The main findings were that source of drinking water and sanitation facilities are strong predictors of under-five mortality. Source of water becomes more important as the child is weaned. Likewise theory suggests that excess dryness or wetness will increase the risk of mortality. Among the geographic variables brought in the study include location, road accessibility and population density in Misungwi District. Road accessibility is estimated as the proportion of the district’s territory that is within 2 km of a tarmac or upgraded road. The population density of the district (138 persons per square kilometre) was estimated based on the 2012 Tanzania Population and Housing Census (TPHC). A study by Patz et al. (as cited in WHO, 2019) indicates that population density plays an important role on child mortality in that overcrowding has deleterious effects on child survival. A study in Mozambique found that higher under-five mortality was associated with the location of mother‘s residence in some provinces and these were not only related to environmental variables, but also to other variables such as income distribution, population density and distribution of basic infrastructure, including health facilities (Chissaque et al., 2018).
Multicollinearity check
Variable collinearity was checked using Pearson pair-wise correlation coefficient and variance inflation factor (VIF) statistic, with > 0.7 and VIF > 0.5 as cut-off values for the indication of multicollinearity respectively (Vatcheva et al., 2016). Consequently, the variables namely, rainfall versus humidity and growing season were so highly collinear. It was not possible to include both terms in the model. Instead, the study replaced growing season and humidity with rainfall – variables that might not pick up the effect of disease vectors. The remaining variables were used in the goodness of fit test.
Model fit and predictive power of the model
Likelihood ratio test (LHR test) and Hosmer-Lemeshow goodness-of-fit (Hosmer-Lemeshow, 2000) as classic tests were used to examine the fitness of the multiple regression model. The -2 log likelihood ratio statistic tests whether a set of independent variables improves prediction of under-five mortality better than chance. It compares the likelihood of the ‘full’ model (that is, with all the predictors included) with the likelihood of the ‘null’ model (that is, a model which contains only the intercept). The formula for the likelihood ratio test statistic (G20) is:
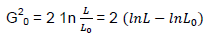
where L is the likelihood of the full model and L0 is the likelihood of the null model. The statistic (G20) has an approximate χ2 distribution with k degrees of freedom (df) (k = number of predictors in the full model). If significant, it suggests that, taken together, the predictors contribute significantly to the prediction of the outcome. The Hosmer and Lemeshow test on the other hand evaluates whether the logistic regression model is well calibrated so that probability predictions from the model reflect the occurrence of events in the data. The value of the test statistic is:
In the above formula,  denote the observed events, and expected events for the
  risk deciles group respectively. The test is assessed by dividing the predicted probabilities into deciles (10 groups based on percentile ranks) and then computing a Pearson Chi-square (Pearson, 1900) that compares the predicted to the observed frequencies. The test statistic asymptotically follows a chi-square distribution with degrees of freedom equal to the number of covariates in the model. Results show the overall likelihood ratio test of the full model: G20 = 2(-1307.61 - (-1322.85)) = 30.48 with 9 df (p< 0.05). The lower this value, the better the model is at predicting the outcome variable. Taken together, the 8 predictors are highly significant predictors of under-five mortality. On the other hand, the Hosmer-Lemeshow test shows a chi-square 6.0479 df = 8 p = 0.642. Small values (with large p-value closer to 1) indicate a good fit to the data; therefore, good overall model fit. The p > .05 means that the set of independent or explanatory variables will accurately predict the actual probabilities. In sum, none of these tests raised any question concerning the fitness of the model and therefore gave way to proceeding with the estimation process.
Methods for estimation
Under-five mortality rates for the district wards were calculated and associations between under-five child deaths and a variety of biophysical and geographic factors were assessed with the multiple logistic regression model; deviance residuals from the model were subjected to a test for spatial clustering. Spatial patterns across the entire study area were quantified, summarized and mapped with Global Moran’s (I) autocorrelation statistic which is used to detect and evaluate spatial clusters.
Statistical analysis
With the availability of complete fertility histories of female respondents between the ages of 15 and 49 years old in the district wards, mortality rates for under-five years of age for each ward were estimated using the direct method. The direct method of calculation uses data on the date of birth of children, their survival status, and the dates of death or ages at death of deceased children. The procedure used was drawn from the Methodology of Demographic and Health Survey (DHS) Mortality Rates Estimation which involves three steps:
1) Calculating the component survival probabilities by subtracting each component death probability from 1.
2) Calculating the product of the component survival probabilities for 0, 1-2, 3-5, 6-11, 12-23, 24-35, 36-47, and 48-59 months of age.
3) Subtracting the product from 1 and multiplying by 1000 to get the under-five mortality rate.
The mean under-five mortality rate from all the 27 clusters was finally calculated to get the rate for the whole district.
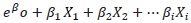
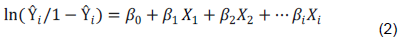
A multiple analysis using logistic regression model was performed to obtain the net effect of each explanatory factor on under-five mortality in the district. The model was applied based on its main advantage of avoiding confounding effects by analyzing the association of all variables together. The basic model equation with multiple independent variables is given as,

Where:
 represents the estimated probability of being in one binary outcome category (i) versus the other.
 represents the linear regression equation for independent variables expressed in the logit scale.
 is the intercept, or the point at which the regression line touches the vertical Y axis. This is considered a constant value.
 is the value of each independent variable (Xi) weighted by its respective beta coefficient (β).
For a binary event, such as mortality, logistic regression is the usual method of choice. The logistic regression may include only one or multiple independent variables, although examining multiple variables is generally more informative because it reveals the unique contribution of each variable after adjusting for the others. In the basic parameters of the logistic regression model, a binary outcome is expressed as a probability that falls between 0 and 1 and therefore the predicted values from the regression model must fall within that range.
When Y is a binary variable, values estimate the probability that Y = 1. A predicted logit for case i is obtained from the solved logistic regression equation by substituting the case's values of the independent variables into the sample estimate of the logistic regression equation. The predicted probability for case i is then given by,
For statistical interpretation, alpha = 0.05 was the level of significance considered.
All non-collinear variables were imported to software for statistical analysis. Regression between the dependent and the independent variables was run to estimate the regression coefficients. The independent variables retained in the model were all significant. A p value of < 0.05 indicated statistical significance. Given that most regression analyses have been criticized of overlooking or not correcting for the spatial dependence which biases the regression models (de Sherbinin, 2011), effort was done to check for autocorrelation in the analysis.
Spatial analysis
Terra-view version 5.4.1, available from the National Institute for Space Research (INPE), was used to analyze the information collected. The Global Moran’s (I) and Anselin local Moran indices were computed and thematic maps were then generated with the under-five mortality rates per thousand live births. Global Moran's (I) is a spatial statistic used to measure spatial autocorrelation (or clustering).
Spatial dependence analysis was performed using the Global Moran’s index, estimating the spatial autocorrelation. The Global Moran’s I score ranges from -1 (dispersed) to 1 (clustered). A value of 0, or very close to 0, refers to random distributions in addition to providing the statistical significance (p-value). The Global Moran's I operates by comparing how similar every object is to its neighbours, and then averaging out all of these comparisons to give an overall impression about the spatial pattern of the variable.
After the general analysis, the presence of clusters was evaluated through Local Moran’s index. Moran’s local index consists of a local indicator of spatial association (LISA) and is calculated from a decomposition of the global index. It is attributed to each cluster, in which spatial correlation with surrounding clusters is revealed. Moran’s local index allows two types of interpretation: identification of significant clusters and their surroundings. Finally, the values of the Moran's local index can be plotted in a scatter plot to show the relationship between each location and its mean. The Moran Scatter plot, utilized to obtain the global spatial variables (or global indicators of spatial dependence), is constructed using normalized values of the analysis variable (Z), which are compared with the average of the neighbourhood values in a two dimensional graph divided into 4 quadrants (Q1, Q2, Q3 and Q4) with the following interpretation: •Q1 (positive values and averages) and Q2 (negative values and averages): indicate points of positive spatial association, signifying that a local has neighbours with similar values; •Q3 (negative values and positive averages) and Q4 (positive values and negative averages): indicate points of negative spatial association, signifying that a local has neighbours with distinct values.
The Box map is an extension of the Moran scatter plot in which the elements of each quadrant of the plot are represented by a specific colour with their respective polygons. The LISA map indicates the regions whose location correlation is significantly different from the others, being classified into the following groups: non-significant; and significant at the 5% (P < 0.05) level, respectively. The Moran map, similarly to the LISA map, shows only significant values; it is represented in four groups and placed in the quadrants to which they belong on the graph.
RESULTS
Statistical analysis
In the period from February 2014 to March 2019 a total of 737 live births were recorded among 471 women aged 15-49 in the district of Misungwi. Within this span of time, there were 41 under-five deaths (56/1,000 Live Births). When all the variables presented in Table 1 were subjected to multiple logistic regression analysis, model reduction was performed, out of which the significance of potential factors was investigated. Consequently, several variables were found to be statistically significant in predicting the probability of under-five deaths. Table 2 presents the reduced multiple logistic regression analysis, only containing significant parameter estimates associated with each biophysical and geographic factor, together with the estimates of the odds ratios (OR). The exponent (Exp (![]() )) in Table 3 is the odds ratio. The relationship between the probability of under-five mortality and the biophysical and geographic factors was explored using odds ratios.From the biophysical factors, rainfall (OR = 2.266, 95% CI [1.244 – 5.832]), temperature (OR= 3.133, 95% CI [1.061 – 4.840]), drought prevalence (OR= 2.694, 95% CI [0.140 – 1.991]), location (OR= 0.527, 95% CI [0.140 – 1.991]), distance (OR= 1.154, 95% CI [0.519 – 2.566]) and soil (OR= 1.619, 95% CI [0.660 – 3.976]) were significantly associated with under-five mortality. From the biophysical factors, rainfall (OR = 2.266, 95% CI [1.061 – 4.840]), temperature (OR= 3.133, 95% CI [0.192 – 0.530]), drought prevalence (OR= 2.694, 95% CI [1.244 – 5.832]), location (OR= 0.527, 95% CI [0.140 – 1.991]), distance (OR= 1.154, 95% CI [0.519 – 2.566]) and soil (OR= 1.619, 95% CI [0.660 – 3.976]) were significantly associated with under-five mortality. Population density was negatively associated with under-five mortality. Under-five mortality significantly decreased as a cluster changed to be served by an urban health facility to a dispensary (rural health facility) within a 10 km radius. Distance to the nearest modern health facility appears to be a good predictor of place of death. In general, as distance increases the number of deaths occurring at home also increases. With regard to distance, only about 26% of the respondents in the district lived less than 10 kilometres away from the nearest modern health facility. The greatest majority (50%) lived 10-15 km away from the nearest health facility with approximately 24% residing more than 15 kilometres away.
)) in Table 3 is the odds ratio. The relationship between the probability of under-five mortality and the biophysical and geographic factors was explored using odds ratios.From the biophysical factors, rainfall (OR = 2.266, 95% CI [1.244 – 5.832]), temperature (OR= 3.133, 95% CI [1.061 – 4.840]), drought prevalence (OR= 2.694, 95% CI [0.140 – 1.991]), location (OR= 0.527, 95% CI [0.140 – 1.991]), distance (OR= 1.154, 95% CI [0.519 – 2.566]) and soil (OR= 1.619, 95% CI [0.660 – 3.976]) were significantly associated with under-five mortality. From the biophysical factors, rainfall (OR = 2.266, 95% CI [1.061 – 4.840]), temperature (OR= 3.133, 95% CI [0.192 – 0.530]), drought prevalence (OR= 2.694, 95% CI [1.244 – 5.832]), location (OR= 0.527, 95% CI [0.140 – 1.991]), distance (OR= 1.154, 95% CI [0.519 – 2.566]) and soil (OR= 1.619, 95% CI [0.660 – 3.976]) were significantly associated with under-five mortality. Population density was negatively associated with under-five mortality. Under-five mortality significantly decreased as a cluster changed to be served by an urban health facility to a dispensary (rural health facility) within a 10 km radius. Distance to the nearest modern health facility appears to be a good predictor of place of death. In general, as distance increases the number of deaths occurring at home also increases. With regard to distance, only about 26% of the respondents in the district lived less than 10 kilometres away from the nearest modern health facility. The greatest majority (50%) lived 10-15 km away from the nearest health facility with approximately 24% residing more than 15 kilometres away.
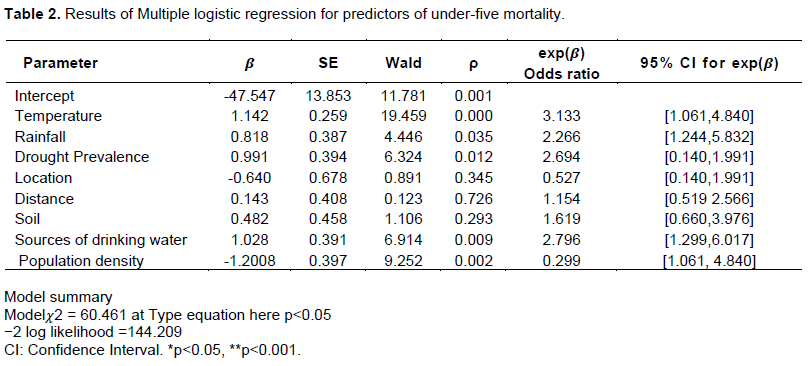

The risk of dying for a child born in a family without access to piped drinking water was higher by 72.4% relative to those born in a family with access to piped drinking water. In relation to environmental factors, source of drinking water remained a significant explanatory factor for under-five mortality. According to the two recruited experts who analyzed verbal/social autopsies, the four major causes of death among children under the age of five years in the two districts are malaria, malnutrition, pneumonia and diarrhoea, in that order.
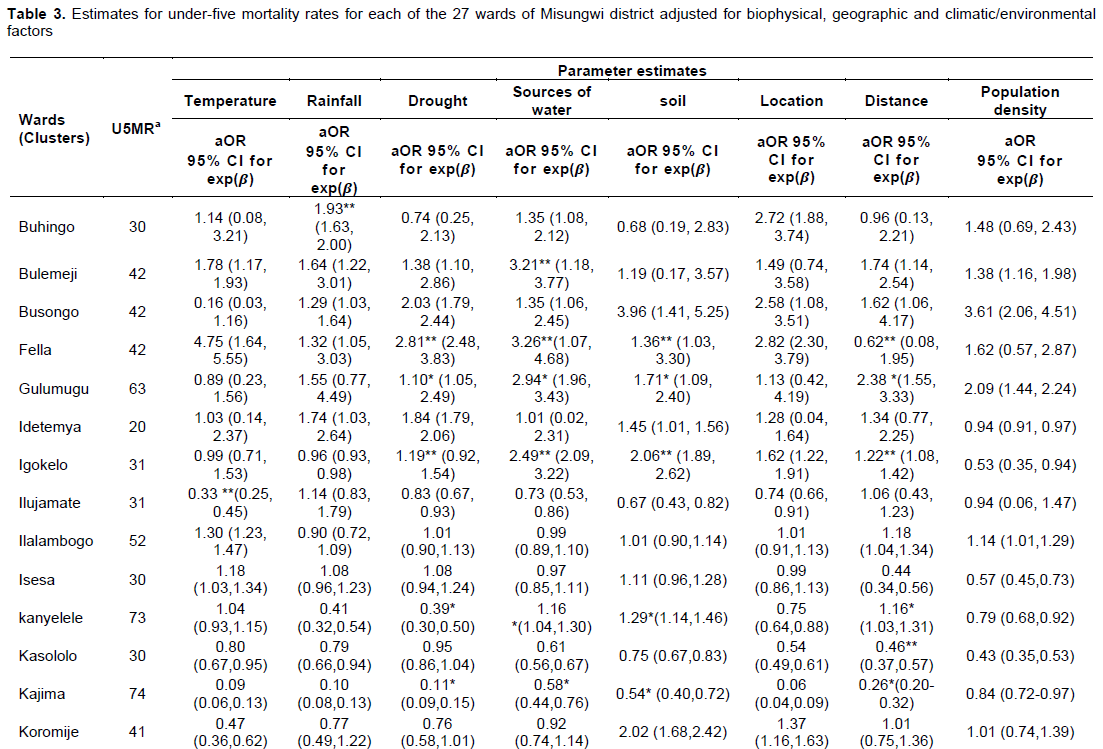
Following adjustment for biophysical, geographic and climatic/environmental factors as a further step toward decomposition of the results of the multiple regression, the comparison among the 27 clusters showed that children between 0 and 5 years of age had a significantly higher risk of child mortality if they lived in the Kanyelele cluster (aOR=0.39, 95% CI [0.30, 0.50]) owing to persistent drought. This effect is also observed for other factors mainly unimproved sources of water, poor soils (agricultural productivity), and long distance to a health facility which were associated with increased risk of U5MR mortality. Other clusters sharing a similar exposure to the explanatory factors include Mwaniko, Mbarika, Gulumugu and Kajima which were also at an increased risk of under-five mortality. Table 3 shows the values of the under-five mortality rates together with estimates for U5MR for each of the 27 clusters (wards) of Misungwi District.
Spatial analysis
Testing for spatial autocorrelation of U5MR
Spatial autocorrelation was performed in the U5MR or 5q0 data using bivariate Anselin Local Moran’s (I) index to identify clusters with risks for mortality occurrence. Moran’s 1 yielded an average statistic of 0.05, expected index = 4.84 z-score =8.22, p-value 0.00 which showed the presence of a noteworthy positive spatial autocorrelation in the under-five mortality rate distribution in Misungwi District. Positive spatial auto-correlation occurs when Moran’s I is close to +1. This means values cluster together. The analysis verifies the existence of spatial dependence and risk patterns which in principle rejects the null hypotheses of this study and accepts the alternatives. Table 4 presents a summary of spatial autocorrelation analysis of under-five mortality in Misungwi District.
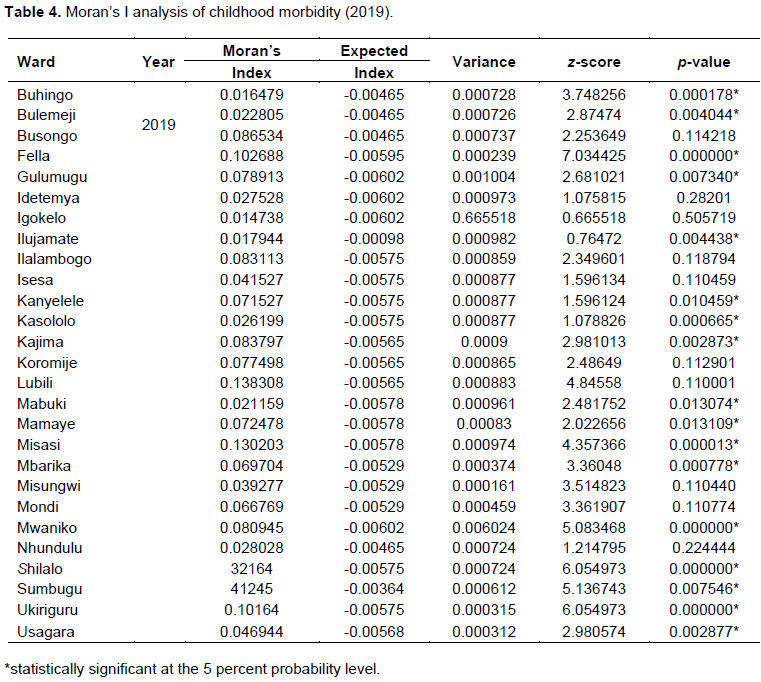
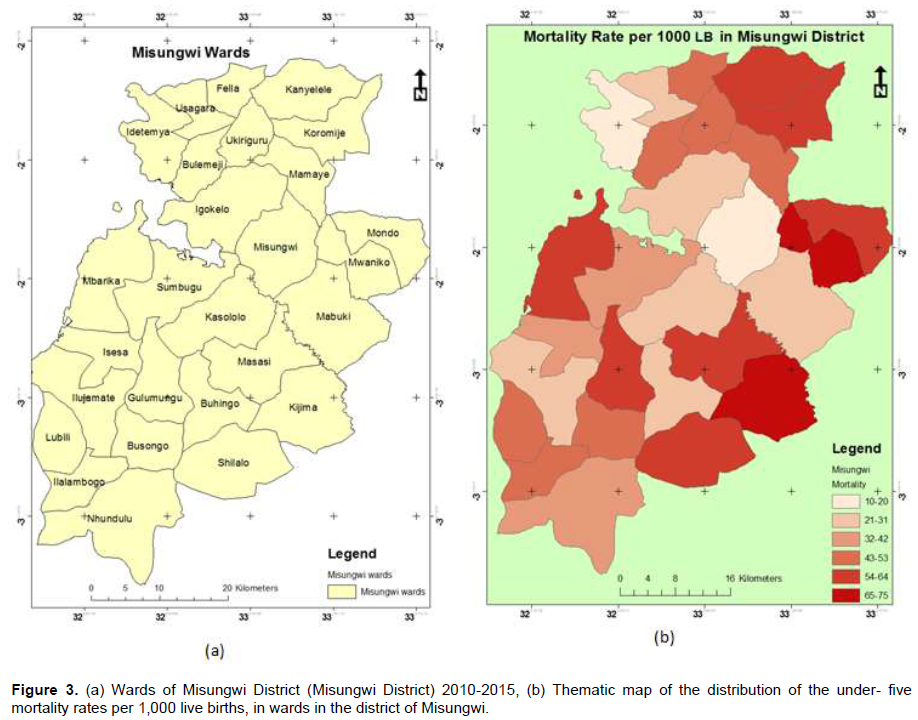
Considering the summary in Table 4, the values of the local Moran index (I) presented some differences among them, ranging from 0.014738 to 0.138308, characterizing the existence of spatial autocorrelation among the 27 wards. Terra View 5.4.1 software package was run to generate maps and identify the areas with spatial dependence. The map highlighted the risk patterns and detected clusters with relative risk of childhood mortality. Figure 3a displays the (clusters) wards of Misungwi District whereas Figure 3b displays the predicted child mortality rates. These predicted rates represent smoothed values of the observed rates that have been adjusted for covariate effects as well as spatial autocorrelation. The map of the predicted rates shows variability and some evidence of clustering in the spatial distribution of under-five child mortality in the district. The figure shows that high mortality wards (with high values) especially Kanyelele, Mwaniko, Mbarika, Gulumugu and Kajima are primarily concentrated close to rivers and long distance from health facilities. These critical wards are followed in risk intensity by Fella, Ukiriguru, Mamaye, Sumbugu, Misasi and Shilalo while most low and average wards are located in areas close to health facilities as well as transport routes.
DISCUSSION
The association between geospatial factors and child mortality can reflect several mechanisms of association. One such mechanism is geospatial impediment in access to health care. Access to health care is a cumulative effect of factors including distance and cost, all of which can be influenced by geospatial factors (Mackenbach et al., 2018). While the study did not ï¬nd differences in mortality related to close proximity of residence to health facilities, the study did ï¬nd higher mortality among infants who lived further from public transport roads, which likely reflects their ability to reach healthcare services in a timelier manner. For under-five children, the study found higher mortality in some parts of the north-eastern and south-eastern areas from the main public transport road, areas which generally have rougher terrain and fewer roads. These are areas which are more sparsely populated, which might also reflect more remote locations with inadequate access to health care. Increasing distance to health facility is associated with higher child mortality (Karra et al., 2017). Besides this relationship with mortality, the so-called distance decay effect in clinic attendance is rooted whereby attendance at health facilities in rural developing country settings falls with escalating distance of residence from the facility (Hulland et al., 2019).
Besides variability in access to healthcare facilities, geospatial factors can dictate exposure and disease transmission dynamics, leading to variability in disease burden. The most studied example of this type of mechanism is the association between geospatial factors and malaria prevalence (Gómez-Barroso et al., 2017). In the Gambia, malaria prevalence was higher in locations with denser vegetation, suggestive of moisture environments more likely to support larval habitats (WHO, 2017). Other research studies have also established variability on the widespread presence of local larval habitat based on drainage patterns and type of aquatic vegetation (Wilson et al., 2020; Kahindi et al., 2018). The geospatial spread of malaria infection in turn has been shown to be related to under-five mortality (Kazembe, 2017). In this study, it has been found that increased under-five mortality was related to distance to streams. Proximity to streams is associated with larval habitat, particularly in the dry season when residual pools might serve as reservoirs for larvae. Results have indicated that malaria deaths are more likely among those living closer to streams. This ï¬nding might have been limited by the low speciï¬city of verbal autopsies for malaria deaths in children, particularly where malaria and pneumonia have signiï¬cant clinical overlap and therefore corroborates the findings of Muro et al. (2015).
The burden of other diseases besides malaria might also be influenced by geospatial factors. Diarrhoea prevalence, for example, is affected by local sources of drinking water, particularly in areas where few households treat their drinking water. In this study, it has been established that deaths due to gastroenteritis occurred more commonly in children living closer to streams and in areas without treated and piped water supplies. Further, it has been established that more children living closer to streams made use of unprotected water sources, chiefly the stream itself. Unprotected water sources have been associated with increased child mortality in other studies (Stewart et al., 2018).
Several studies investigated the effect of an area’s population density on child mortality. One study found that an increased population density in rural Zimbabwe led to higher rates of child mortality (Hathi et al., 2017).
This study however did not find this factor to be significant in rural Misungwi. However, the author suggests that in urban centres where the factor counts, this might be ascribed to greater transmissibility of infectious diseases between people. The transmissibility hypothesis is supported by the ï¬nding of higher mortality in urban than rural Tanzania (Neiderud, 2015). In contrast, other studies in Africa have shown excess mortality in less densely populated rural settings (Tabutin, 2017). While almost all of Misungwi District area is considered rural, the study found an increase in child mortality in more sparsely populated areas. The basis for this is unclear, but it might be ascribed to issues associated with poorer access to care and a small number of health facilities not captured by straight-line distance variables, inadequate study equipment, and abundant larval habitats for Anopheles mosquitoes
The limitations of this work include the following: (i) multiple factors associated with a risk of under-five mortality have been examined; however, the study was cross-sectional which was missed to explore the cause and effect correlations thus making it prone to bias. (ii) this study was unable to get previous studies conducted in Misungwi District which could serve as a benchmark for gauging the current results.
CONCLUSION
A few interesting conclusions emerge from the preceding analysis. First, child mortality rates vary significantly across the clusters in the study district. Secondly rainfall encompassing the concept of growing season, water sources, including sanitation facilities, malaria prevalence, temperature, and access to a health facility, have significant marginal effects on under-five mortality (conditional on the average values of other covariates in each case). Other inter-covariate interactions namely population density and drought were not significant. All coefficients are translated on the conditions of holding all other covariates at their mean values.
The results of this study have indicated that besides concerted efforts by government and other stakeholders in health to improve infant and childhood survival, the risk of a child dying before completing five years of age is still highest in Misungwi District and the Lake Zone in general. Comparing the GHO data Child Mortality and causes of death issued in 2020, Misungwi district (56 per 1000 live births), has a rate around 6 times higher than that in the WHO European Region (9 per 1000 live births). Even after holding both biophysical and geographical variables constant, the study brings out into the open that strengthened health programs have a special and significant role to play in reducing under-five mortality rate in the high focus clusters in Misungwi District. Findings from this study, especially from the maps generated, could assist policymakers, programme managers and international donors in their various intervention programmes aimed at saving the lives of young children. Likewise, results from this study suggest that there is need to further assess the variations in causes of under-five deaths in other districts constituting the Lake zone.
CONFLICT OF INTERESTS
The author has not declared any conflict of interests.
REFERENCES
|
Abdullah ZD, Shah T, Ali S, Ahmad W, Din IU, Andersen IA (2017) Factors affecting household food security in rural northern hinterlandof Pakistan Journal of the Saudi Society of Agricultural Sciences 18:201-210 |
|
|
Adeoti A, Oni O (2019). Exploring the Nexus between Child Immunization and Child Mortality in Rural Nigeria. Journal of African Development 20 (1):23-30 |
|
|
Afnan-Holmes H, Magoma M, John T, Levira F, Msemo G, Armstrong CE (2015).Tanzanian Countdown Country Case Study Group. Tanzania's countdown to 2015: an analysis of two decades of progress and gaps for reproductive, maternal, newborn, and child health, to inform priorities for post-2015. Lancet Glob Health 3(7):396-409 |
|
|
Aheto JMK (2019). Predictive model and determinants of under-five child mortality: evidence from the 2014 Ghana demographic and health survey. BMC Public Health 19(1):64. |
|
|
Akinyemi JO, Adebowale AS, Bamgboye EA, Ayeni O (2015). Child survival dynamics in Nigeria: Is the 2006 child health policy target met?. Nigerian Journal of Health Sciences 15:18-26. |
|
|
Akombi BJ, Agho KE, Hall JJ, Wali N, Renzaho A, Merom D (2017). Stunting, wasting and underweight in Sub-Saharan Africa: a systematic review. International journal of environmental research and public health 14(8):863. |
|
|
Arku RE, Bennett JE, Castro MC, Agyeman-Duah K, Mintah SE, Ware JH,Nyarko P, Spengler JD, Agyei-Mensah S, Ezzati M (2016). "Geographical Inequalities and Social and Environmental Risk Factors for under-Five Mortality in Ghana in 2000 and 2010: Bayesian Spatial Analysis of Census Data." PLoS medicine 13(6):e1002038. |
|
|
Burgert-Brucker CR, Yourkavitch SA, Delgado S (2015). Geographic Variation in Key Indicators of Maternal and Child Health across 27 Countries in Sub-Saharan Africa. DHS Spatial Analysis Reports No. 12. Rockville, Maryland, USA: ICF International. |
|
|
Byaro M, Musonda P (2016). Determinants of Infants and Under-Five Mortality Differentials in Tanzanian Zones: Evidence from Panel Data Analysis. Journal of Economics and Sustainable Development 7(18):2222-1700. |
|
|
Chissaque A, de Deus N, Vubil D, Mandomando I (2018).The Epidemiology of Diarrhea in Children Under 5 Years of Age in Mozambique. Current Tropical Medicine Reports 5:115-124. |
|
|
Cisse G (2019). Food-borne and water-borne diseases under climate change in low- andmiddle-income countries: Further efforts needed for reducing environmental health exposure risks, Acta Tropica 194:181-188. |
|
|
Colson KE, Dwyer-Lindgren L, Achoki T, Fullman N, Schneider M, Mulenga P, Hangoma P, Ng M, Masiye F, Gakidou E (2015) Benchmarking health system performance across districts in Zambia: a systematic analysis of levels and trends in key maternal and child health interventions from 1990 to 2010. BMC Med. 13(1):1-14. |
|
|
Contreras D (2019). The integrated spatial pattern of child mortality during the 2012-2016 drought in La Guajira, Colombia. Sustainability 11(24): Article 7190. de' |
|
|
Donato FK, Leone M, Scortichini M, De Sario M, Katsouyanni K, Lanki T, Basagaña X, Ballester F, Åström C, Paldy A, Pascal M, Gasparrini A, Menne B, Michelozzi P (2015). Changes in the Effect of Heat on Mortality in the Last 20 Years in Nine European Cities. Results from the PHASE Project. International journal of environmental research and public health 12(12):15567-15583. |
|
|
Dimitrova A (2020). Impacts of droughts on undernutrition among children aged under five in Ethiopia, WP-20-012 International Institute for Applied Systems Analysis, Luxenburg, Australia. |
|
|
Efficacy and persistence of long-lasting microbial larvicides against malaria vectors in western Kenya highlands, Parasites and Vectors 11:438 |
|
|
Global Health Observatory data (2017). Child mortality and causes of death. |
|
|
Golding N, Burstein R, Longbottom J, Browne AJ, Fullman (2017). Mapping under-5 and neonatal mortality in Africa, 2000-2015: a baseline analysis for the sustainable development goals. Lancet 390:2171-2182. |
|
|
Gómez-Barroso G, García-Carrasco E, Herrador Z, Ncogo P (2017). Spatial clustering and risk factors of malaria infections in Bata district, Equatorial Guinea Malaria Journal 16:146 |
|
|
Haile B, Signorelli S, Azzarri C, Johnson T (2018). Welfare effects of weather variability: Multi-country evidence from Africa south of the Sahara. PLoS ONE 13(11):e0206415. |
|
|
Hathi P, Haque S, Pant L, Coffey D, Spears D (2017). Place and Child Health: The Interaction of Population Density and Sanitation in Developing Countries. Demography 54(1):337-360. |
|
|
Headey D,Palloni G (2019). Water, Sanitation, and Child Health: Evidence Fro Subnational Panel Data in 59 Countries, Demography. Apr 56(2):729-752. |
|
|
Hosmer DW, Lemeshow S (2000). Applied Logistic Regression. 2nd ed. New York, NY: John Wiley & Sons, Inc. |
|
|
Hulland EN, Wiens KE, Shirude S, Morgan JD, Bertozzi-Villa A, Farag TH, Fullman N, Kraemer MUG, Miller-Petrie MK, Gupta V, Reiner Jr, RC, Rabinowitz P, Wasserheit JN, Bell BP, Hay SI, Weiss DJ, Pigott DM (2019). Travel time to health facilities in areas of outbreak potential: maps for guiding local preparedness and response. BMC Med 17:232 |
|
|
Intergovernmental Panel on Climate Change (IPCC) (2018), "Climate change 2018: Special report", Contribution of Working Groups I, II and III to the Fifth Assessment Report of the Intergovernmental Panel on Climate Change (IPCC). |
|
|
Kahindi SC, Muriu S, Derua YA, Wang X, Zhou G, Lee M, Mwangangi J, Atieli H, Githeko A and Yan G (2018).Efficacy and persistence of long-lasting microbial larvicides against malaria vectors in western Kenya highlands, Parasites and Vectors 11:438 |
|
|
Karra, M, Fink G, Canning D (2017)."Facility Distance and Child Mortality: A Multi-Country Study of Health Facility Access, Service Utilization, and Child Health Outcomes.International Journal of Epidemiology 46(3):817-826. |
|
|
Kazembe LN, Mathanga DP (2017). Estimating risk factors of urban malaria in Blantyre, Malawi: A spatial regression analysis Asian Pacific Journal of Tropical Biomedicine 6(5):376-381. |
|
|
Kim CT, Lim YH, Woodward A, Kim H (2015). Heat-Attributable Deaths between 1992 and 2009 in Seoul, South Korea. PloS ONE 10(2). |
|
|
Kruk ME, Mbaruku G (2015). Public Health successes and frail health systems in Tanzania. Lancet, Glob Health 3(7):348-349 |
|
|
Liu L, Oza S, Hogan D (2016). Global, regional, and national causes of under-5 mortality in 2000-15: an updated systematic analysis with implications for the Sustainable Development Goals. Lancet 388:3027-3035 pmid:27839855 |
|
|
Mackenbach J, Charreire H, Glonti K (2018). Exploring the Relation of Spatial Access to Fast Food Outlets With Body Weight: A Mediation Analysis 51(4):401-430 |
|
|
Mbouna AD, Tompkins AM, Lenouo A, Asare E, Yamba E Tchawoua C (2019). Modelled and observed mean and seasonal relationships between climate, population density and malaria indicators in Cameroon. Malaria Journal 18:359 |
|
|
Midekisa A, Alemayehu M, Beyene B, Mihretie A, Bayabil E, Wimberly MC (2015). Seasonal Associations of Climatic Drivers and Malaria in the Highlands of Ethiopia. Parasit. Vectors 8(1):339. |
|
|
Ministry of Health Community Development Gender Elderly Children [Tanzania], Ministry of Health [Zanzibar], National Bureau of Statistics, Office of the Chief Government Statistician, & ICF (2016). Tanzania Demographic and Health Survey and Malaria Indicator Survey (TDHS-MIS) 2015-16. Dar es Salaam. |
|
|
Moran PAP (1950). "Notes on Continuous Stochastic Phenomena". Biometrika 37(1):17-23. |
|
|
Mosley WH, Chen LC (1984). An analythical framework for the study of child survival in developing countries. Bulletin of the World Health Organization 81:25-45. |
|
|
Mueller B, Hauser M, Iles C, Rimi RH, Zwiers FW, Wan H (2015). Lengthening of the growing season in wheat and maize producing regions. Weather Climate Extremes 9:47-56. |
|
|
Mulenga P, Hangoma M, Ng F, Masiye E, Gakidou (2015). "Benchmarking Health System Performance across Districts in Zambia: A Systematic Analysis of Levels and Trends in Key Maternal and Child Health Interventions from 1990 to 2010." BMC Medicine 13(1):1-14. |
|
|
Muro F, Reyburn R, Reyburn H (2015). Acute respiratory infection and bacteraemia as causes of non-malarial febrile illness in African children: a narrative review.pneumonia 6:6-17. |
|
|
Nasejje JB, Mwambi HG, Achia TNO (2015).Understanding the determinants of under-five child mortality in Uganda including the estimation of unobserved house hold and community effects using both frequentist and Bayesian survival analysis approaches. BMC Public Health 15:1003. |
|
|
Neiderud C (2015). How urbanization affects the epidemiology of emerging infectious diseases, Infection Ecology and Epidemiology 5:1. |
|
|
Oyekale AS, Maselwa TC (2018). Maternal education, fertility, and child survival in Comoros. International Journal of Environmental Research and Public Health 15(12):1-17. |
|
|
Pearson K (1900). On the criterion that a given system of deviations from the probable in the case of a correlated system of variables is such that it can be reasonably supposed to have arisen from random sampling. Philosophical Magazine 50:157-172. |
|
|
Pezzulo C, Bird T, Utazi E, Sorichetta A, Tatem A, Yourkavitch J, Burgert-Brucker C (2016). Geospatial Modeling of Child Mortality across 27 Countries in SubSaharan Africa. DHS Spatial Analysis Reports No. 13. Rockville, Maryland, USA: ICF International. |
|
|
Quattrochi J, Salomon JA, Hill K, and Castro MC (2019). Measuring and correcting bias in indirect estimates of under-5 mortality in populations affected by HIV/AIDS: a simulation study, BMC Public Health 19:1516. |
|
|
Roberts DA, Ng M, Ikilezi G, Gasasira A, Dwyer-Lindgren L, Fullman N, Nalugwa T, Kamya M, Gakidou E (2015). "Benchmarking Health System Performance across Regions in Uganda: A Systematic Analysis of Levels and Trends in Key Maternal and Child Health Interventions, 1990-2011." BMC Medicine 13(1):1-16. |
|
|
Sewe M, Rocklöv J,Williamson J, Hamel M, Nyaguara A, Odhiambo F, Laserson K (2015). The Association of Weather Variability and Under Five Malaria Mortality in KEMRI/CDC HDSS in Western Kenya 2003 to 2008: A Time Series Analysis. International journal of environmental research and public health 12(2):1983-1997. |
|
|
Sharma R (2015). Quantifying Undernutrition in Rural India, Academic Foundation, New Delhi. |
|
|
Stewart CP, Kariger P, Fernald L, Pickering AJ, Arnold CD, Arnold BF (2018). Effects of water quality, sanitation, handwashing, and nutritional interventions on child development in rural Kenya (wash benefits Kenya): a cluster- randomised controlled trial.Child and Adolescent Mental Health 2:269-280 |
|
|
Tabutin D, Masquelier B (2017). Tendances et inégalités de mortalité de 1990 à 2015 dans les pays à revenu faible et intermédiaire. Population 72(2):221-296. |
|
|
Tanzania Demographic and Health Survey and Malaria Indicator Survey (TDHS-MIS) (2015-16). Tanzania Demographic and Health Survey and Malaria Indicator Survey. Dar es Salaam, Tanzania, and Rockville, Maryland, USA: MoHCDGEC, MoH, NBS, OCGS, and ICF. |
|
|
Tlou B, Sartorius B, Tanser F (2017). Space-time patterns in maternal and mother mortality in a rural South African population with high HIV prevalence (2000-2014): results from a population-based cohort, BMC Public Health 17:543 |
|
|
UNICEF (2015). Committing to Child Survival: A Promise Renewed. UNICEF's Division of Data, Research, and Policy in collaboration with the Programme Division and the Secretariat for A Promise Renewed. |
|
|
UNICEF, WHO, WORLD-BANK & UNPD (2018). Levels and trends in child mortality. Report 2018. New York: UNICEF. |
|
|
United Nations Inter-agency Group for Child Mortality Estimation (UN IGME) (2015). Levels and trends in child mortality. New York: UNICEF, WHO, World Bank & United Nations. |
|
|
United Nations Inter-agency Group for Child Mortality Estimation (UN IGME) (2018). Levels and trends in child mortality. New York: UNICEF, WHO, World Bank & United Nations. |
|
|
United Republic of Tanzania (URT) (2013). 2012 Population and Housing Census, Population Distribution by Administrative Areas, NBS&CGS. |
|
|
United Republic of Tanzania (URT) (2015). Mortality and Health; National Bureau of Statistics, Ministry of Finance, Dar es Salaam and Office of Chief Government Statistician Ministry of State, President Office, State House and Good Governance, Zanzibar. |
|
|
United Republic of Tanzania (URT) (2017). MWANZA REGION INVESTMENT GUIDE, Regional Administration and Local Government, Mwanza Regional Commissioner's Office. |
|
|
Vatcheva KP, Lee M, McCormick JB, Rahbar MH (2016). Multicollinearity in regression analyses conducted in epidemiologic studies. Epidemiology (Sunnyvale), |
|
|
World Health Organization (WHO) (2017). 2017 World Malaria Report. World Health Organization. |
|
|
World Health Organization (WHO) (2017). World Malaria Report. Geneva. World Health Organization. |
|
|
World Health Organization (WHO) (2019). Climate change and infectious diseases. |
|
|
Wichmann J (2017). Heat effects of ambient apparent temperature on all-cause mortality in Cape Town, Durban and Johannesburg, South Africa: 2006-2010 |
|
|
Wilson AL, Courtenay O, Kelly-Hope LA, Scott TW, Takken W, Torr SJ, Lindsay SW (2020). The importance of vector control for the control and eliminationof vector-borne diseases. PLoS Neglected Tropical Diseases 14(1):e0007831. |
|
|
Wollum A, Burstein R, Fullman N, Dwyer-Lindgren L, Gakidou E (2015). "Benchmarking Health System Performance across States in Nigeria: A Systematic Analysis of Levels and Trends in Key Maternal and Child Health Interventions and Outcomes 2000-2013." BMC Medicine 13(1):1-16. |
|
|
You D, Hug L, Ejdemyr S, Idele P, Hogan D, Mathers C (2015). Global, regional, and national levels and trends in under-5 mortality between 1990 and 2015, with scenario-based projections to 2030: a systematic analysis by the UN Inter-agency Group for Child Mortality Estimation. Lancet 386: 2275-2286. pmid:26361942 |
|
Copyright © 2024 Author(s) retain the copyright of this article.
This article is published under the terms of the Creative Commons Attribution License 4.0


