Full Length Research Paper
ABSTRACT
There are conflicting reports on the relationship between hypertension and diabetes mellitus (DM) with socioeconomic status. This study explores this relationship individually and jointly. This is a cross sectional comparative study. Adults that participated in medical outreach organized for high and low socioeconomic status (SES) were tested for hypertension and DM. Mean age in years for high and low SES was 58.69 (± 10.26) and 57.77 (± 15.54), respectively. Widows were significantly more than widowers (P < 0.001). Frequency of hypertension in middle age (45 to 64 years in high and low SES) was 58.0 and 71.9%, respectively (P = 0.009). Frequency of DM was 19.2 and 7.3% in high and low SES respectively (P < 0.001). Combined frequency of hypertension and DM was 14.0 and 6.0% in high and low SES respectively (P = 0.002) and 13.8 and 5.9% in the middle age group in high and low SES respectively (P = 0.034). Severity of hypertension was more in low than high SES (P = 0.001). The prevalence and severity of hypertension among middle age in low SES is higher than in high SES. Combined frequency of hypertension and DM is more in high than low SES.
Key words: Socioeconomic status, hypertension, diabetes mellitus, combined frequency.
INTRODUCTION
Hypertension and diabetes mellitus are major non- communicable diseases (NCD) and their frequency worldwide is rising. In 2015, an estimated 40 million deaths occurred due to NCDs, accounting for 70% of the overall total of 56 million deaths. Most of such deaths were caused by the four main NCDs, namely: cardiovascular disease, 17.7 million deaths (accounting for 45% of all NCD deaths); cancer, 8.8 million deaths (22%); chronic respiratory disease, 3.9 million deaths (10%); and diabetes, 1.6 million deaths (4%)(WHO, 2017). So, apart from cancer and chronic respiratory disease, the first two commonest causes of death due to NCDs are hypertension and diabetes mellitus.
Hypertension is a modifiable risk factor for cardiovascular morbidity and mortality. Its frequency seems higher in urban areas than in rural areas (Akinlua et al., 2015). This suggests a socioeconomic status (SES) factor in distribution of hypertension. There are conflicting reports of relationship between socioeconomic status and hypertension. Hypertension is believed to be a disease of the rich and developed nations (Fikadu and Lemma, 2016). Hence hypertension is expected to be more frequent in higher SES than in lower SES. Fikadu and Lemma (2016) found such positive relationship among teachers and bankers in Addis Ababa, Ethiopia in 2016. In Nigeria, some studies report positive relationship (Bunker et al., 2010) and others report that hypertension is higher in low socioeconomic status (Adedoyin et al., 2005). Positive relationships have been found in other low and middle income countries like India (Gilberts et al., 1995), Jamica (Mendez et al., 2003), India (Soudarssanane, 2006) and Ghana (Addo et al., 2009).
Frequency of diabetes mellitus is rising. In 2015 it was estimated that there were 415 million people with diabetes aged 20-79 years and 5 million deaths attributable to diabetes. Three quarters (75%) of those with diabetes were living in low- and middle-income countries. The number of people with diabetes aged 20-79 years was predicted to rise to 642 million by 2040 (Ogurtsova et al., 2017). This also suggests an SES factor in the distribution of diabetes mellitus. Life style and diet are important factors affecting the disease hence it is expected to be more frequent in high socioeconomic status than in low socioeconomic status. Danjin et al. (2016) found that diabetes mellitus was more frequent in urban dwellers than rural dwellers (Danjin et al., 2016). Shittu et al. (2017) reported that it is more prevalent among people with low income.
Hypertension and diabetes are associated with increased risk of CVD and renal disease. The risk is exacerbated when both are present (Govindarajan et al., 2006). Risk of a patient having one when the other is present is higher than when one is not present. A direct correlation between plasma insulin levels and blood pressure exists (Sechi et al., 1992; Sowers et al., 2001). There are studies on the distribution of hypertension and diabetes by socio-economic status but little has been done on the combined frequency of the diseases and socioeconomic status. The aim of this study is to compare the relationship of the combined frequency with SES.
MATERIALS AND METHODS
Type of study
This is a cross sectional comparative study.
Sample size determination
Sample size is determined using the formula for determining sample sizes needed to detect a difference between two proportions (Fleiss et al., 2003).
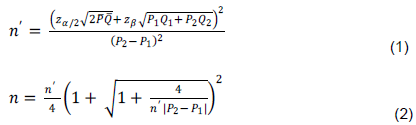
Where  = sample size uncorrected for continuity
 = the desired sample size incorporating the continuity factor.
Probability of type 1 error, α, is set at 0.05
Probability of type 2 error, β, is set at 0.2. Conventionally, β is set at four times α (Fleiss et al., 2003).
 = 1.96 (the standard normal variate for α of 0.05 for a 2-tailed test)
 = 0.84 (standard normal variate for power of 80%, 1-β).
 = frequency of hypertension or diabetes mellitus, whichever is higher from previous study. National prevalence of hypertension is 6.2-48.8% for males and 10- 47.3% for females (Fikadu and Lemma, 2016). National prevalence of diabetes mellitus is 0.8 to 11% (Dahiru et al., 2016). Frequency of hypertension is higher than prevalence of diabetes mellitus. Hence, to obtain a higher minimum sample size that will give higher power to the study, the frequency of hypertension will be used for the sample size determination. From previous study, frequency of hypertension in high SES is 11.2 and 3.6% in low SES (Adedoyin et al., 2005).
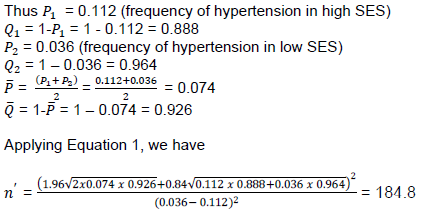
Applying Equation 2, we have
The minimum desired sample size is 210
Methods of data collection
Socioeconomic status (SES) in Nigeria depends on level of education, occupation and income. There are five categories: I, II, III, IV and V, according to Oyedeji (1985). So he summarized the groups into two: the high made up of the first 3 groups and the low made up of the last 2 groups. Those that belong to the high are the rich people who are politicians, professionals, university graduates with post graduate qualifications, business executives, land lords, car owners, etc. The low SES is made up of peasant farmers, manual laborers, daily paid workers that are mainly uneducated or at most attended secondary school education and degree holders that are jobless (Oyedeji, 1985). Thus one can belong to high SES if he has high income and occupation without high education. One can also belong to the low SES with high education but low occupation and low income.
Knighthood of St Christopher is an order in the Church of Nigeria, Anglican Communion. The members belong to the high socioeconomic status. They support the church financially among other ecclesiastical duties assigned to them. The members meet at the beginning of each year to celebrate their Family Day. During the occasion of their 2018 Family day celebration, medical outreach was extended to them. The medical exercise was to educate them on the prevalence of hypertension, diabetes mellitus and chronic kidney disease, the epidemiology and complications of the diseases and the availability of screening tests for them. They were counseled before the exercise and they gave their oral consent. Those that did not consent were excluded. Those that consented were asked to come for the exercise fasting overnight and with morning urine sample collected in clean specimen bottle. They are 214 that attended and participated.
Interviewer administered data capture proforma, adapted from the WHO STEPwise approach (WHO, 2005) to chronic disease risk factor surveillance, was used to elicit information from the participants. Twenty young medical doctors (House Officers) were trained to collect the data. Data on gender, age, academic qualification, occupation, marital status, present medical challenges (hypertension, diabetes mellitus) were collected. Anthropometric measurements were done. Blood pressure and fasting blood sugar were measured. Age was recorded to the nearest whole number and further classified as young to middle aged adult, (20- 44 years), middle aged adult, (45 to 64 years) and old adult (65 years and above). (Health, United States, 2006).
Blood pressure (BP) was measured with mercury sphygmomanometer. The measurement was done three times at three minutes’ interval with the participant sitting down and arm resting on a table. The value at which the first Korotkoff sound is heard is the systolic pressure and the value at which the last (fourth) is barely audible is the diastolic pressure. This was repeated three times and the average of the last two readings was taken as the blood pressure. High blood pressure was systolic blood pressure equal to or higher than 140 mmHg and/or diastolic blood pressure equal to or higher than 90 mmHg (Chobanian et al., 2003). Participants that are known hypertensives on treatment are recorded as high blood pressure even if the BP measurement is not high.
Height was measured using an improvised stadiometer. A measuring tape was used to calibrate a portion of the wall in the examination hall. The calibration was done in centimeters to the nearest 0.1 cm. The participant stood on bare feet with back against the wall with his/her heels touching the wall. The height was read by placing a flat object (ruler) horizontally on the crown of the head and at 90o to the calibration on the wall. The value, to the nearest 0.1 cm was read and recorded as the height.
The weight was measured using Hanson Emperors Bathroom Scale calibrated to the nearest kilogram. The scale was set to zero. The participant, in light dress, having removed his/her phone, wrist watch and other heavy materials on his/her body climbed the scale and looked straight forwards. The examiner read the value to the nearest kg and recorded that as the weight.
Double G sugar monitor (Blood glucose meter) manufactured in USA for Double G Industries Ltd., exclusively distributed in Nigeria by Davinny Pharmaceutical Lt., was used to check the fasting blood sugar level. The thumb was pierced with a lancet after cleaning with cotton wool spirit swab. The tip of the test strip was placed at the edge of the blood expressed from the prick. The blood seeped in and filled the test area. The value automatically appeared in 5 s and was taken as the blood sugar level. Fasting blood sugar level above 126 mg/dl was regarded as high and recorded as diabetes mellitus. Known cases of diabetes mellitus on treatment are also recorded as diabetes mellitus even if the FBS is less than 126 mg/dl.
Association of General and Private Medical Practitioners of Nigeria (AGPMPN), Anambra State branch organized a medical outreach as part of their Scientific Conference 2018. Ebenebe, a rural town of about 45,897 according to the 2006 Nigerian Census, was selected for the medical outreach. The inhabitants are peasant farmers, petty traders, manual laborers and artisans. They lack adequate medical care and have poor health indices. The Local Government Chairman, the Igwe (king) of the town and the priests in the local churches were informed of the outreach in the advocacy visits before the event. They consented and mobilized their people for the activity. The methodology for collecting data used for the Knights was used for the rural people. For blood sugar test, some ate food before coming for the exercise. For those people, the sugar level was recorded as random blood sugar. Values above 160 mg/dl were regarded as high. The number that attended and participated is 317.
Ethical clearance
Ethical clearance was obtained from Chukwuemeka Odumegwu Ojukwu University Teaching Hospital, Amaku, Awka; COOUTH/ CMAC/ETH.C/VOL.1/0027.
Data analysis
Data were analyzed using Statistical Package for the Social Sciences (SPSS) version 20. Proportions were calculated. Data analysis was done with Z and T tests. Fisher’s exact test was used when the expected values were less than 5. Results are presented in tables as proportions with their P - values.
RESULTS
The mean age of the participants in years in the high SES is 58.69 ± 10.26 and 57.77 ± 15.54 in the low SES. The distribution of participants by socio-economic status and gender is as shown in Table 1. Having dichotomized the participants into high SES and low SES, their educational status, occupation and income are excluded in this analysis.
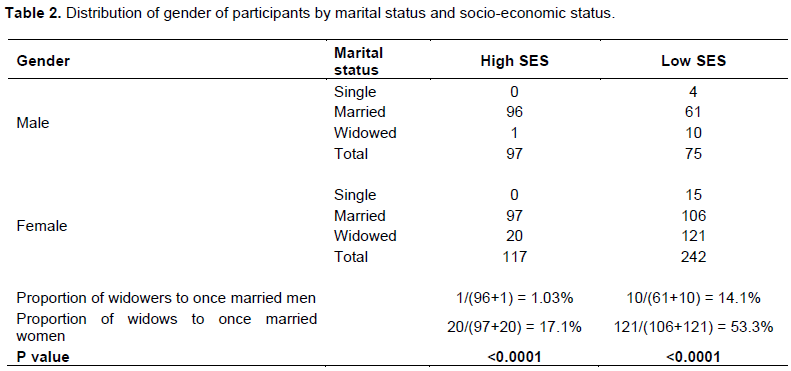
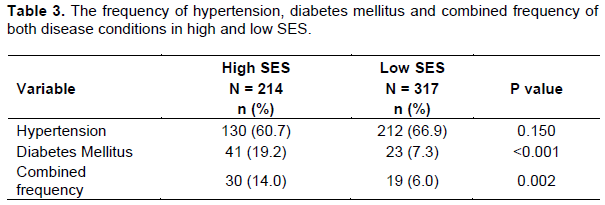
In Table 2 the distribution of gender of participants by marital status is shown. There are significantly more widows than widowers in each SES. The frequency of hypertension in the high SES as represented by the knights and ladies is 60.7 and 66.9% in the low SES as represented by the Ebenebe community. The frequency of diabetes mellitus and combined frequency of both disease conditions are shown in Table 3. Table 4 shows the distribution of the frequency of hypertension and diabetes mellitus individually and jointly stratified by age groups.

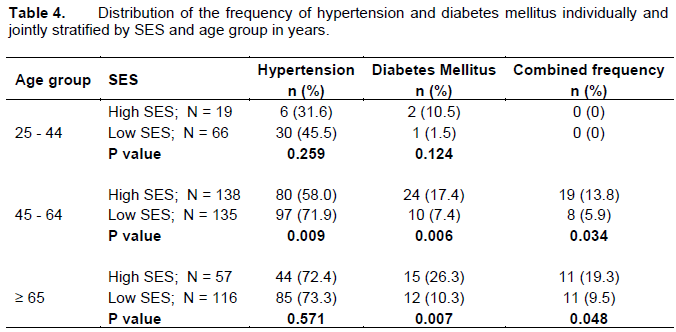
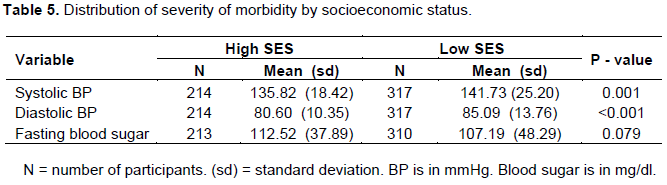
Hypertension affects the middle adult age group more in the low SES than in the high SES but for diabetes mellitus the middle and old adults bear the brunt more. The combined frequency is more in the high SES especially in the middle adult group in high SES. The severity of hypertension as measured by the mean of the systolic BP values and the mean of the diastolic BP values are shown in Table 5. So also is the severity of diabetes mellitus as measured by the mean of the blood sugar levels. This is stratified by SES. From Table 5, the average person from 20 years and above from the low SES is a systolic hypertensive since the mean systolic blood pressure is more than 140 mmHg.
DISCUSSION
The current study demonstrated that females participated in the outreach more than males (Table 1). This is similar to the findings of Ige and Nwachukwu (2008). Females have better health seeking behavior than males (Mackenzie, 2007; Ihaji, 2014). This may explain why more females participated than males. Table 2 shows that there are more widows than widowers. Generally, men marry women younger than their age. Since age is an important factor in mortality, men tend to die earlier than their wives. This may also explain why more females attended the outreach because they are in absolute majority. This higher population of widows than widowers is more evident in low SES than high SES. This can also explain why significantly more females than males attended in the low SES than in the high SES.
Frequency of hypertension in high SES is 60.7 and 66.9% in low SES. The difference is not statistically significant. The frequency values found in this work are higher than what have been reported in some literature (Ado et al., 2009; Ulasi et al., 2011; Abegunde and Owoaje, 2013; Makusudi et al., 2013; Anyabolu et al., 2017; Bello-Ovosi et al., 2018). Some researchers have reported that hypertension is associated with low SES (Okpara et al., 2015; Anyabolu, 2017). Others report that hypertension is associated with high SES (Bunker, 2010; Fikadu and Lemma, 2016). This study found no significant difference in the frequency of hypertension in high and low SES. This is similar to the findings of Abegunde and Owoaje (2013) and Adaramaja and Tijani (2014). The high frequency of hypertension may be because the outreach gave free counselling and drugs, hence those that knew that they have hypertension were more likely to avail themselves of the opportunity than those that were not hypertensive.
Frequency of diabetes is 19.2% among the high SES and 7.3% among the low SES and the difference is statistically significant. The frequency we got is lower than some other community findings in Northern Nigeria (Okoduwa et al., 2015; Dahiru et al., 2016; Bello-Ovosi et al., 2018). However, some works reported lower frequency (Danjin et al., 2016; Aladeniyi et al., 2017; Shittu et al., 2017). Nwafor and Owhoji (2001) reported a higher frequency of 23.4% among high SES than 16.0% among low SES. Our finding is in agreement with this report but differs from that of Shittu et al. (2017) that found a higher frequency among the low socioeconomic status.
Overall frequency of hypertension does not differ between high and low SES but when stratified by age group, it is found to be significantly more in age group 45-64 years in low SES than in high SES. Thus hypertension is more in the middle age group of the poor segment of the society. The burden of hypertension, measured by both the mean of systolic blood pressure and mean of diastolic blood pressure is more in the low SES than the high SES. It is this segment that engages in manual labour like agriculture. It is also the productive age group of the society that has dependent relatives and carries economic responsibilities.
Similar age group in the high SES suffers more from diabetes mellitus since more people from high SES suffer from diabetes than from low SES and this significance is in the middle and old age groups. However, the burden of diabetes mellitus measured by the mean value of blood sugar is the same in both segments of the society. The middle age groups of both SES have different challenges. This goes to show that frequency of hypertension and diabetes mellitus depends on SES and this dependence is affected by age group. We did not find similar literature to compare this finding with. The combined frequency of hypertension and diabetes mellitus was found to be 14.0% in high SES and 6.0% in low SES and the difference is significant. This combined frequency is noticed in middle age group and in old age group. It does not exist in the early adult age group. Among the middle age group, the high SES suffers more from the combined frequency than the low SES. The difference in old age group is also significant. It is known that comorbidity of hypertension and diabetes mellitus has worse outcomes than single morbidity (Govindarajan et al., 2006). So these age groups among the high SES are more vulnerable than their counterparts in the low SES. The more vulnerable group is the middle adult age group. Incidentally, the captains of industry, politicians, business executives that hold the economy of the state fall into this category.
Draw backs
The bench mark for diagnosis of hypertension was 140/90mmHg according to the 7th Joint National Committee (JNC 7) Hypertension Guidelines report. Lower benchmark would have yielded higher prevalence. Moreover, the blood pressure was checked on one occasion only. It is required to be checked on at least two occasions except there is hypertensive emergency. Another drawback is that diabetes mellitus was diagnosed by using the fasting (or random) blood sugar level instead of HbA1c glycated hemoglobin test. These drawbacks were because the data were collected during a medical outreach and it would have been very difficult to gather the same people to repeat the data collection at a later date.
CONCLUSION
The prevalence and severity of hypertension among middle age group in low SES. Combined frequency of hypertension and diabetes mellitus is more in high than low SES. The middle age group bears the burden of hypertension and diabetes mellitus.
RECOMMENDATIONS
The middle age groups of both socioeconomic classes should be targeted urgently for health intervention. Both groups in their different capabilities hold the economy of the state. Health interventions should be tailored to meet their individual group needs: the low SES will be interventions to control hypertension and the high SES will be interventions to control both hypertension and diabetes mellitus.
CONFLICT OF INTERESTS
The author has not declared any conflict of interests.
REFERENCES
|
Abegunde KA, Owoaje ET (2013). Health problems and associated risk factors in selected urban and rural elderly population groups of south-west Nigeria. Annals of African Medicine 12(2):90-97. |
|
|
Adaramaja SR, Tijani OM (2014). Demographic Factors as Correlates of Health - Seeking Behaviour of the People of Oyo State, Nigeria. GJDS 11(2). |
|
|
Addo J, Smeeth L, Leon DA (2009). Socioeconomic position and hypertension: a study of urban civil servants in Ghana. Journal of Epidemiology and Community Health, BMJ Publishing Group 63(8):646-650. |
|
|
Adedoyin RA, Mbada CE, Awofolu OO, Oyebami OM (2005). "The influence of socio-economic status on casual blood pressures of the adult Nigerians". European Journal of Cardiovascular Prevention and Rehabilitation: Official Journal of the European Society of Cardiology, Working Groups on Epidemiology and Prevention and Cardiac Rehabilitation and Exercise Physiology 12(3):71-83. |
|
|
Akinlua JT, Meakin R, Umar AM, Freemantle N (2015). Current prevalence pattern of hypertension in Nigeria: a systematic Review. PLOs ONE 10(10):e0140021. |
|
|
Aladeniyi I, Adeniyi OV, Fawole O, Adeolu M, Goon DT, Ajayi AI, Iruedo J (2017). The Prevalence and Correlates of Pre-Diabetes and Diabetes Mellitus Among Public Category Workers in Akure, Nigeria. The Open Public Health Journal 10:167-176. |
|
|
Anyabolu EN, Okoye IC, Chukwumobi AN, Eke OD (2017). Hypertension and its Socioeconomic Factors in a Market Population in Awka, Nigeria. American Journal of Medical Sciences and Medicine 5(3):40-48. |
|
|
Bello-Ovosi BO, Asuke S, Abdulrahman SO, Ibrahim MS, Ovosi J O, Ogunsina MA, Anumah FO (2018). Prevalence and correlates of hypertension and diabetes mellitus in an urban community in North-Western Nigeria. Pan African Medical Journal 29(1):1-7. |
|
|
Bunker CH, Okoro FI, Markovic N, Thai N, Pippin B, Ackrell M, Kuller LH (2010). Relationship of hypertension to socioeconomic status in a West African population. Ethnicity and health 1(1):33-45. |
|
|
Chobanian AV, Bakris GL, Black HR, Cushman WC, Green LA, Izzo JL, Jones DW, Materson BJ, Oparil S, Wright JT, Roccella, EJ (2003). Seventh Report of the Joint National Committee on Prevention, Detection, Evaluation and Treatment of High Blood Pressure. Hypertension 42(6):2560-2571. |
|
|
Dahiru, T., Aliyu, A. A. & Shehu, A. U. (2016). A review of population-based studies on diabetes mellitus in Nigeria. Sub-Saharan African Journal of Medicine 3:59-64. |
|
|
Danjin M, Usman NU, Adamu D (2016). Prevalence of diabetes mellitus in a tertiary health institution in Gombe Metropolis, Nigeria. Sudan Medical Monitor 11:113-11. |
|
|
Fikadu G, Lemma S (2016). Socioeconomic Status and Hypertension among Teachers and Bankers in Addis Ababa, Ethiopia. International journal of hypertension. Article ID 4143962. |
|
|
Fleiss JL, Levin B, Paik MC (2003). Statistical methods for rates and proportions. Third Edition. Wiley Series in Probability and Statistics. John Wiley & Sons. Inc. Hoboken, New Jersey pp. 64-73. |
|
|
Gilberts ECA, Arnold MJCWJ, Grobbee DE (1995). "Hypertension and determinant,s of blood pressure with special reference to socioeconomic status in a rural south Indian community. Journal Epidemiology Community Health 48(3):258-261. |
|
|
Govindarajan G, Sowers JS, Stump CS (2006). Hypertension and Diabetes. European Cardiovascular Disease 2(1):1-7. |
|
|
Health, United States. (2006). Chartbook on Trends in Health of Americans: 71 p. |
|
|
Ige K, Nwachukwu C (2008). Health Care Seeking Behaviour Among Market Traders in Ibarapa Central Local Government, Nigeria. The Internet Journal of Health 9(2):1-5. |
|
|
Ihaji E, Eze UG, Ogwuche CHE (2014). Educational Level, Sex and Church Affiliation on Health Seeking Behaviour among Parishioners in Makurdi Metropolis of Benue State. Journal of Educational Policy and Entrepreneurial Research 1(2):311-316. |
|
|
Mackenzie CS, Gekoski WL, Knox VJ (2007). Age, gender, and the underutilization of mental health services: The influence of help-seeking attitudes. Aging and Mental Health 10(6):574-582. |
|
|
Makusudi MA, Liman HM, Yakubu A, Isah MDA, Jega RM, Adamu H (2013). Prevalence of non-communicable diseases and its awareness among inhabitants of Sokoto Metropolis; outcome of a screening program for hypertension, obesity, diabetes mellitus, and overt proteinuria. Arab Journal of Nephrology and Transplantation 16(3):189-91. |
|
|
Mendez MA, Cooper R, Wilks R, Luke A, Forrester T (2003). "Income, education, and blood pressure in adults in Jamaica, a middle-income developing country. International Journal of Epidemiology 32(3):400-408. |
|
|
Nwafor A, Owhoji A (2001). Prevalence of Diabetes Mellitus among Nigerians in Port Harcourt Correlates with Socio-Economic Status. Journal of Applied Sciences and Environmental Management 5(1):75-77. |
|
|
Ogurtsova K, da Rocha Fernandes JD, Huang Y, Linnenkamp U, Guariguata L, Cho NH, Cavan D, Shaw JE, Makaroff LE (2017). IDF Diabetes Atlas: Global estimates for the prevalence of diabetes for 2015 and 2040. Diabetes Research and Clinical Practice 128:40-50. |
|
|
Okoduwa SIR, Umar IA, Ibrahim S, Bello F, Ndidi US (2015). Socio-Economic Status of Patients with Type 2 Diabetes and Hypertension Attending the Ahmadu Bello University Teaching Hospital, Zaria, North-West Nigeria. Global journal of health science 7(1):280-287. |
|
|
Okpara IC, Utoo PM, Bako IA (2015). Prevalence and awareness of hypertension amongst staff and students of a tertiary institution in Nigeria. GARJMMS 4(1):61-66. |
|
|
Oyedeji GA (1985). Socio-economic and cultural background of hospitalized children in Ilesha. Global Journal of Health Science 12:111-117. |
|
|
Sechi LA, Melis A, Tedde R (1992). Insulin hypersecretion: a distinctive feature between essential and secondary hypertension. Metabolism 41(11):1261-1266. |
|
|
Shittu RO, Kasali FO, Biliaminu SA, Odeigah LO, Sule AG, Musah Y (2017). Prevalence of Diabetes and Pre-Diabetes in Oke-Ogun Region of Oyo State, Nigeria. Journal of Medical Research and Health Education 1(16):1-7. |
|
|
Soudarssanane MB, Karthigeyan M, Stephen S, Sahai A (2006). Key predictors of high blood pressure and hypertension among adolescents: a simple prescription for prevention. Indian Journal of Community Medicine 31(3):164. |
|
|
Sowers JR, Epstein M, Frohlich ED (2001). Diabetes, hypertension, and cardiovascular disease: an update. Hypertension 37(4):1053-1059. |
|
|
Ulasi II, Ijoma CK, Onwubere BJ, Arodiwe E, Onudogo O, Okafor C (2011). High prevalence and low awareness of hypertension in a market population in Enugu, Nigeria. International Journal of hypertension 869675. |
|
|
World Health Organization (2005). WHO STEPS Surveillance Manual: The WHO STEPwise approach to chronic disease risk factor surveillance. Geneva, World Health Organization. |
|
|
World Health Organization (2017). World health statistics 2017: monitoring health for the SDGs, Sustainable Development Goals. Geneva: Assessed May 16, 2018. |
|
Copyright © 2024 Author(s) retain the copyright of this article.
This article is published under the terms of the Creative Commons Attribution License 4.0


