ABSTRACT
This study was made with the aim of exploring Teff value chain and postharvest-losses in Ethiopia. Semi-structured survey questionnaire and interview of key informants were used to collect primary data. Characterizations, descriptive statistics, Probit, and Tobit regression models were used to analyze data collected. SPSS and Microsoft Excel were used to analyze the data. The result identified major chain actors in the supply chains. The supply chains were characterized by open and untraceable chains without any collaborative relationships among chain actors. The assessment on elements of logistics functions noted that donkey and human labor serving major role as means of transportation, gotara and gumbi/togogo as major storage facility, and plastic sacks as major packaging material. Using probit model, attendance of formal education was identified as the most determining factor for farmers’ value addition decisions. Farmers’ stage loss of 8.18% was identified as the highest percentage losses and could be considered as loss hotspot point in the chain. Using Likert scale assessment, farmers’ stage Teff post-harvest loss causing factors were identified in order of severity where threshing process was indicated as the severest problem. Using Tobit model, sex, family size, level of output, bad weather condition, distance to the nearest market, and storage facilities were found significantly affecting farmers’ stage post-harvest losses. Strengthening farmers’ cooperatives and the need of further work where all chain actors and stakeholders are engaged to break the self-centered mentality and create awareness towards established Teff supply chains characterized by win-win cooperation among chain actors was recommended.
Key words: Teff, value chain, value additions, post-harvest loss, Ethiopia.
Self-reliance in food supply has been a critical question in Ethiopia since long period of time. To this end, sound agricultural production performance plays a vital role. However, achievements in agricultural productions alone may not warranty the availability of food crops. This is because significant amount of food produced has been lost post-harvest before it reaches consumers (Kummu et al., 2012; Parfitt et al., 2010; FAO, 2014; Pedreschi et al., 2013). Therefore, assessment and management of food losses in food chains has become another important dimension to consider in the effort of food security. Value additions activities in food value chains could serve to improve productivity, reduce food losses, and increase the income of those engaged in the agribusiness and improve their livelihood.
Teff (Eragrostistef –Zucc): Ethiopia is native home of Teff Vavilov (1951) cited in Ketema (1997). In Ethiopia, Teff is important cereal crops that 24.02% of all land under cultivation is covered by Teff (first among all cultivated crops in terms land coverage) and contribute 17.57% to grain production, second next to maize in terms contribution to total grain production (CSA, 2015). Some reports indicated that Teff is getting wider acceptance in international market, too. As gluten-free cereal it is getting global attention and becoming one of the healthy grains (The Guardian, 2014). Therefore, there is potential for Teff to be the second gift of Ethiopia to the world after coffee.
Regardless of its economic contribution and potential, Teff is a very tiny cereal which is produced in a very drudgery system and has a number of problems in production and postharvest management. In production, the system is very drudgery and the yield was one of the lowest compared to other world cereals (Assefa et al., 2013). On the other hand, Teff is also a cereal which was subject to loss particularly during the harvesting and threshing processes.
The high loss behavior of Teff may emanate somehow from the tiny seed size of the cereal. Farmers express their pain of this loss by a proverb in Afaan Oromoo language ‘’amman baddu osoo beekanii silaa nanqottan’ jette Xaafiin’’ roughly translated, it means had the farmers know how much is lost, no one is willing to engage in Teff farming. From this proverb one can understand two important things: loss is serious problem of Teff farming system and knowing the exact loss amount is difficult.
Therefore, there is clear call for the stakeholders to continue both in yield increasing efforts on one hand and reducing losses on the other hand. Improving these has paramount contribution to food security in Ethiopia, which was a long standing agenda. With more than 35% of the population being under high prevalence of undernourishment between 2012 and 2014, Ethiopia was identified among countries where food security issue is prevailing agenda (WFP, 2014). The role of Teff in alleviating this problem is of paramount for many reasons. First, cultural attachments of the people of Ethiopia to Teff: with strong attachments to Teff production and consumption of Ethiopians, it involves zero cost of promotion. It is a cereal which is already in the favorite consumption list of the people of Ethiopia. Second, Teff has high nutritional values: 62% dietary fiber, 82% iron, 35% calcium, 47% carbohydrates, gluten free, and verity of vitamins (Nutrition Data, 2015), which is another aspect of food security. Third, Teff by-product is also used as animal feed thus contribute to meat and milk productions of the country. Fourth, Teff is important cash crop, second after coffee, generating about 464 million USD income per year for local farmers (CSA, 2015). With increasing trend of Teff consumption at international level, the importance of Teff as cash crop is expected to increase benefiting farmers.
Inefficiencies and ineffectiveness of management practices in food value chains are one of the major reasons for food losses. For instance, Kummu et al., (2012) stated that by making food supply chain efficient half of the food losses could be saved and that could feed one billion extra people. Hence analyzing and improving management practices in the food value chains could reduce food losses. Therefore, this study was made with main objective of analyzing Teff value chains with particular emphasis on farmers’ value addition decisions and post-harvest losses in two districts of central Ethiopia. The specific objectives were to:
(1) Map-out and analyze Teff supply and marketing chains,
(2) Analyze logistics activities,
(3) Identify factors affecting farmers’ value addition decisions, and
(4) Identify level of post-harvest losses and analyze factors affecting the post-harvest losses of Teff in the area.
Definitions of terms
Value additions
Value chain is defined by Kaplinsky and Morris (2001) as “ the full range of activities which are required to bring a product or service from conception, through the different phases of production (involving a combination of physical transformation and the input of various producer services), delivery to final consumers, and final disposal after use.” The word ‘value’ in value chain may refer to place values, which means getting the product or services in the right place; form value, which means getting the product or service with the right form (conversion of the product from one from to another), or it could refer to time value which means getting the product or service at the right time. In a broader sense, value is what the customer is willing to pay for.
In this study, by value activities we refer to farmer stage value activities which serve to improve production, quality, and convenience for chain actors downstream. These value activities includes: use of fertilizer, improved variety seeds, herbicides, and other inputs; on time harvesting, cleaning, storage, and transportation of produce to various market places.
Post-harvest food losses and waste
Following the recognition of reducing food losses as important element of food security equation, the phrases food loss, post-harvest loss, and food waste were commonly used in scientific and other reports. However, unless specifically defined for particular use, these terms may create confusions as different sources use these terms to refer to somehow different things. Often, the stages of the losses in the food supply chain were used to refer to the type of loss as the terms agricultural loss, processing loss, distribution loss, and consumption loss used as in the study by Gustavsson et al. (2011). Harris and Lindblad (1978) distinguished among pre-harvest, harvesting and post-harvest food losses using the period of time in production and distribution of food commodities. According to the source, losses that happen before harvesting process start such as losses due to weeds, insects or disease were termed as ‘pre-harvest food losses’. Losses during the harvesting process such as losses resulting from shattering during harvesting were classified as ‘harvesting losses’ while losses that happen between completion of the harvesting process to the human consumption was termed as ‘post-harvest losses’. Parfitt et al., (2010) indicated that some authors distinguish between food losses and food waste as “Food loss referring to the general decrease in food quantity or quality, which makes it unfit for human consumption while food waste refers to food loss at the end of food supply chains which generally results from human behavioral issues.” According to this distinction, food waste is part of food loss. However, Parfitt et al. (2010) preferred to use the term “food waste” to mean both food loss and food waste. Hodges et al. (2011a) referred post-harvest system as “interconnected activities from the time of harvest through crop processing, marketing, and food preparations, to final decision by the consumer to eat or discard the food product” and post-harvest loss as “measurable quantitative and qualitative food loss in the post-harvest system.” The author noted that food loss is subset of post-harvest loss and food waste is subset of food loss that is potentially recoverable for human consumption. Rembold et al. (2011) also noted post-harvest loss (PHL) to include losses that occur at time of harvest, though various postharvest operations on farm to the first level of market. The definitions by Hodges et al. (2011a) and Rembold et al., (2011)for PHL are similar with Harris and Lindblad (1978) definition for Post-production losses in terms of the losses included as losses occurring at all stages starting from harvesting and movements of food down to the consumption points. Hodges et al. (2011a) consideration of PHL as the broadest loss where food loss is subset of it and food waste was the subset of food loss is not in line with definitions by Harris and Lindblad (1978). The later defined PHL narrowly to indicate losses occurring at stages of the food supply chain after harvest process completed.
In this study, we preferred to use the term post-harvest loss with the reason that it was the term most often used. However, by post-harvest loss in this study, we mean losses of Teff both during harvesting process and during the post-harvest activities throughout the supply chains in the process of getting the cereal down to consumers. What was considered as post-harvest loss includes Teff losses that occur at all stages of the harvesting, post-harvest handling, processing, transportation, storage, packaging and marketing, and consumption.
Measuring/estimating losses
To our knowledge, there is no universally agreed method for food loss assessments methodology that fits to measuring food losses for all types of food commodities in all situations. However, two major approaches to measure/estimate food losses can be mentioned (Hodges et al., 2011b): (i) actual measurement of quantity (weight or volume) or quality (negatively altered conditions of the food products) losses in food chains and (ii) use of questionnaire to indicate subjective estimated losses by people experiencing the losses in food chains. Due to the difficulty of food loss measurement directly, Basavaraja et al. (2007) tend to use indirect method of addressing food losses in terms of factors causing food losses. The notion of trying to address food losses as latent variable measured in terms of the factors causing food losses has two advantages. First, we estimate or measure food losses not only to know the loss amount but also to reduce losses and reducing losses are possible through knowledge and interventions on factors causing losses. Second, it allows use of econometrics models, which enables to know both the level of losses and factors causing the loss in order of severity. Therefore, such method clearly indicates factors causing losses with level of significance and invite prioritized interventions to reduce food losses. But the limitation is that in subjective study, the complex interaction among the factors causing losses may not be easily grasped and a loss caused by one factor may be attributed to the other factor by the chain actors. Moreover, farmers and other chain actors may know, at least feel, the overall loss easily but it may be difficult when it comes decomposing losses according to many factors causing the losses.Definitions of terms
Value additions
Value chain is defined by Kaplinsky and Morris (2001) as “ the full range of activities which are required to bring a product or service from conception, through the different phases of production (involving a combination of physical transformation and the input of various producer services), delivery to final consumers, and final disposal after use.” The word ‘value’ in value chain may refer to place values, which means getting the product or services in the right place; form value, which means getting the product or service with the right form (conversion of the product from one from to another), or it could refer to time value which means getting the product or service at the right time. In a broader sense, value is what the customer is willing to pay for.
In this study, by value activities we refer to farmer stage value activities which serve to improve production, quality, and convenience for chain actors downstream. These value activities includes: use of fertilizer, improved variety seeds, herbicides, and other inputs; on time harvesting, cleaning, storage, and transportation of produce to various market places.
Post-harvest food losses and waste
Following the recognition of reducing food losses as important element of food security equation, the phrases food loss, post-harvest loss, and food waste were commonly used in scientific and other reports. However, unless specifically defined for particular use, these terms may create confusions as different sources use these terms to refer to somehow different things. Often, the stages of the losses in the food supply chain were used to refer to the type of loss as the terms agricultural loss, processing loss, distribution loss, and consumption loss used as in the study by Gustavsson et al. (2011). Harris and Lindblad (1978) distinguished among pre-harvest, harvesting and post-harvest food losses using the period of time in production and distribution of food commodities. According to the source, losses that happen before harvesting process start such as losses due to weeds, insects or disease were termed as ‘pre-harvest food losses’. Losses during the harvesting process such as losses resulting from shattering during harvesting were classified as ‘harvesting losses’ while losses that happen between completion of the harvesting process to the human consumption was termed as ‘post-harvest losses’. Parfitt et al., (2010) indicated that some authors distinguish between food losses and food waste as “Food loss referring to the general decrease in food quantity or quality, which makes it unfit for human consumption while food waste refers to food loss at the end of food supply chains which generally results from human behavioral issues.” According to this distinction, food waste is part of food loss. However, Parfitt et al. (2010) preferred to use the term “food waste” to mean both food loss and food waste. Hodges et al. (2011a) referred post-harvest system as “interconnected activities from the time of harvest through crop processing, marketing, and food preparations, to final decision by the consumer to eat or discard the food product” and post-harvest loss as “measurable quantitative and qualitative food loss in the post-harvest system.” The author noted that food loss is subset of post-harvest loss and food waste is subset of food loss that is potentially recoverable for human consumption. Rembold et al. (2011) also noted post-harvest loss (PHL) to include losses that occur at time of harvest, though various postharvest operations on farm to the first level of market. The definitions by Hodges et al. (2011a) and Rembold et al., (2011)for PHL are similar with Harris and Lindblad (1978) definition for Post-production losses in terms of the losses included as losses occurring at all stages starting from harvesting and movements of food down to the consumption points. Hodges et al. (2011a) consideration of PHL as the broadest loss where food loss is subset of it and food waste was the subset of food loss is not in line with definitions by Harris and Lindblad (1978). The later defined PHL narrowly to indicate losses occurring at stages of the food supply chain after harvest process completed.
In this study, we preferred to use the term post-harvest loss with the reason that it was the term most often used. However, by post-harvest loss in this study, we mean losses of Teff both during harvesting process and during the post-harvest activities throughout the supply chains in the process of getting the cereal down to consumers. What was considered as post-harvest loss includes Teff losses that occur at all stages of the harvesting, post-harvest handling, processing, transportation, storage, packaging and marketing, and consumption.
Measuring/estimating losses
To our knowledge, there is no universally agreed method for food loss assessments methodology that fits to measuring food losses for all types of food commodities in all situations. However, two major approaches to measure/estimate food losses can be mentioned (Hodges et al., 2011b): (i) actual measurement of quantity (weight or volume) or quality (negatively altered conditions of the food products) losses in food chains and (ii) use of questionnaire to indicate subjective estimated losses by people experiencing the losses in food chains. Due to the difficulty of food loss measurement directly, Basavaraja et al. (2007) tend to use indirect method of addressing food losses in terms of factors causing food losses. The notion of trying to address food losses as latent variable measured in terms of the factors causing food losses has two advantages. First, we estimate or measure food losses not only to know the loss amount but also to reduce losses and reducing losses are possible through knowledge and interventions on factors causing losses. Second, it allows use of econometrics models, which enables to know both the level of losses and factors causing the loss in order of severity. Therefore, such method clearly indicates factors causing losses with level of significance and invite prioritized interventions to reduce food losses. But the limitation is that in subjective study, the complex interaction among the factors causing losses may not be easily grasped and a loss caused by one factor may be attributed to the other factor by the chain actors. Moreover, farmers and other chain actors may know, at least feel, the overall loss easily but it may be difficult when it comes decomposing losses according to many factors causing the losses.
Study site, sampling, and data collection
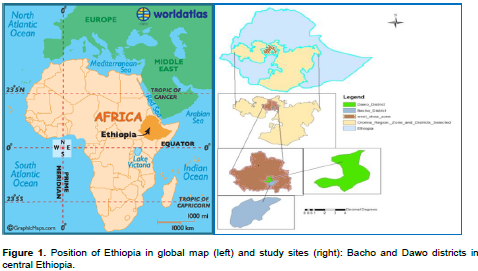
This study was conducted in Bacho and Dawo Districts of south West Shoa zone in central Ethiopia. These districts were purposefully selected from among high production areas of Teff (Figure 1). For farmers, simple random sampling formula by Olsson (2011) was employed with p value of 85% and confidence level of 95%. Thus, n value estimated using:
Where: n is sample size; z is value of standard variate from normal curve; p is estimated population proportion; q is 1-p; and e is error term (5%).
Even though p value of 50% could give highest sample size, with resource constraint and consistency observed during the pilot study it was limited to 85%. Therefore, the farmer respondent sample size was determined to be 196. Then the number was distributed to Kebeles under each districts based on stratification using the actual number of households.

However, in the data cleaning process we remained with 150 of the questionnaires from farmers to be validly discussed. Semi-structured questionnaire translated to local language was used to gather primary data. The data was collected during January to November, 2014. The sample size for other chain actors was determined purposefully based on their willingness to cooperate and other particular factors associated with each chain actors. Accordingly, out of 209 registered Teff traders in the two districts we have selected 54 traders and allocated proportionally based on the actual number of traders in each districts as 28 from Bacho and 26 from Dawo. The other actors included were: 20 consumers, 6 cooperatives, 2 union, 20 Enjera/Buden (soft bread made of Teff) sellers, 4 mill houses and 2 Teff flour sellers. For these chain actors (other than Farmers), we did not apply sampling formula because in some cases the number of chain actors were limited which we have included all to the study as in the case of cooperatives and union or majority of the chain actors like in the case of mill houses, Enjera/Buden sellers, and Teff flours sellers.
Data analysis
Combinations of analytical techniques were used in analysis of the data obtained. These include mapping the product flow chart, descriptive statistics, Probit, and Tobit models. The analysis was mainly quantitative but narrative-qualitative descriptions were also made regarding Teff farmers socioeconomic characteristics, logistics practices, and supply chain management issues in Teff supply and marketing chains, value addition decisions, and the extent of post-harvest Teff losses. The Probit and Tobit models were used to investigate factors affecting value addition decisions and post-harvest losses, respectively. The Probit and Tobit Models were preferred for their advantages of solving the two major problems under the linear probability model (LPM). That is under LPM, the fitted probabilities can be less than zero or greater than one and the partial effect of any explanatory variable is constant (Wooldridge, 2012). Using Probit and Tobit, which are binary response models overcome these problems and the fitted probabilities under these models lies between zero and one. In this study, farmers’ value addition decisions and farmer stage post-harvest losses of Teff were analyzed using Probit and Tobit models, respectively where farmers’ value addition decisions and farmer stage post-harvest losses of Teff were considered as latent variables, unobserved variables that are measured by multiple observed variables or the factors. The observed variables or the factors were element of our questionnaire which was developed based on the consultative workshop at the beginning of the study.
Probit model
The basic formula of Probit/ Logit (Wooldridge, 2012: 586) was:
The Probit model was preferred over the logit for the assumption and properties of normality distribution of disturbance terms (e) in the data and that we assumed the decision to add value is discrete, dichotomous and mutually exclusive. The goal was to explain the effects of the xj(factors in our case) on the response probability P(y = 1\x), farmers’ value addition decisions. We used the IBM SPSS Statistics Version 20 to compute the maximum likelihood estimation and we analyzed the marginal effects results between factors (explanatory variables) and the percentage probability change of farmers’ decisions to engage in value addition decisions or P(y =1). The explanation of factors (explanatory variables) on the probability of limit and non-limit responses, without regard for the value of non-limit responses of the value addition decisions(explained variable) were analyzed for which probit provides a suitable statistical model as noted by (Tobin, 1958).
Tobit model
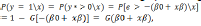
As stated by Wooldridge (2012) the Tobit model expresses the observed response (y), in terms of underlying latent variable, in this case the post-harvest loss of Teff were an underlying latent variables relating to factors determining these as independent variables to measure the latent variable. Here is the basic Tobit model formula (Wooldridge, 2012) with lower limit censoring at zero:
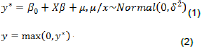
In the second equation above, it means the observed variable, y, equals y* when y* ≥ 0, but y =0 when y* < 0.Tobit model is one of the limited dependent variable models where there is a limit or boundary on the dependent variable and some of the observations hits this limit. The limits could be upper or lower. In this case, the values of dependent variables or Teff post-harvest loss, for a rational farmer relating to particular believed cause of Teff loss never go beyond zero. Therefore, there is lower limit. But for some respondent farmers the loss as a result of some factors hits zero. The choice of the Tobit model, as against the cob Douglas, probit or logit model, was based on the fact that with it, the intensity of loss as it relates to each independent variable or the loss causing factors can be determined. Thus, maximum likelihood Tobit estimation (Tobin, 1958) was used in the analysis of factors affecting amount of post-harvest losses of Teff.
Variables, expected effects, and research questions
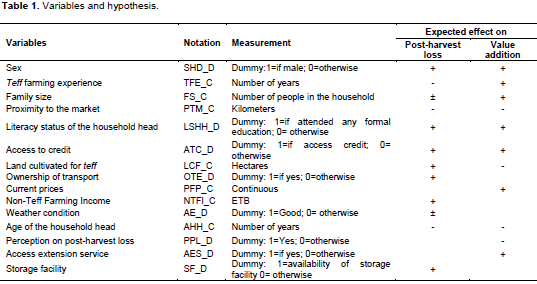
This study was designed and executed both in terms of research questions and testing expected effect of some variables on other variable approach. Factors affecting value addition decisions (Objective 2) and factors affecting post-harvest losses of Teff (Objective 4) were designed and answered in terms of testing the following hypothesized relationships between variables (Table 1). In addition to Table 1, the study answered the following research questions:
(1) How is the Teff value chain in the study area characterized? (Objective 1 and part of Objective 2),
(2) What is the level of losses across the stages of Teff supply and marketing chains, and where is the hotspot loss point in the stages? (Objective 3).
Map-out and analysis of Teff farming and post-harvest system in the study area
Socio-economic backgrounds of farmer respondents
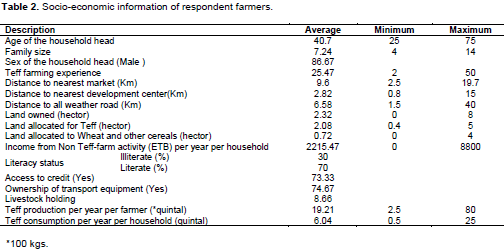
General information of the Teff farmers in the study area was presented in Table 2. The result showed the average Teff growing experience of the household head was 25 years, implying that respondent farmers have enough knowledge and competence in Teff farming and making informed farm management choices. The age of the respondent farmers were between 25 and 75 with 40 years as an average age of respondents. The average distances to the nearest market, to nearest development centers, and to the nearest all weather roads were 9.6, 2.82 and 6.58 km, respectively. Family size for the respondent farmers was high at an average of about 8 people per household; the head of the house hold were mostly (86.7%) men. The average land owned, average land allocated to Teff farming, and average land allocated to Wheat and other cereals in the area were 2.32 and 2.08 hectors (about 89% of land owned), and 0.72 hectors, respectively. The average land allocation indicated that majority of the land owned were allocated for Teff faming in the area and few of respondent farmers indicated they have no land and they are engaged in farming by renting land. The land rent as noted by the farmers could be paid in cash in advance or paid in kind. Payment in kind is when the land owner share produce during the harvest time. The farmer respondents reported that the common sharing ratio in the area was 1:2, where the land owner gets one third and the farmer who engaged in farming gets two third of the produce, this sharing ratio agreement is locally known as ‘siso’.The average production per farmer per year was 19.21 quintals or 1921 kg whereas the average consumption was 6.04 quintal or 604 kg of Teff per household per year in the area.
Flows of Teff products in the supply chain
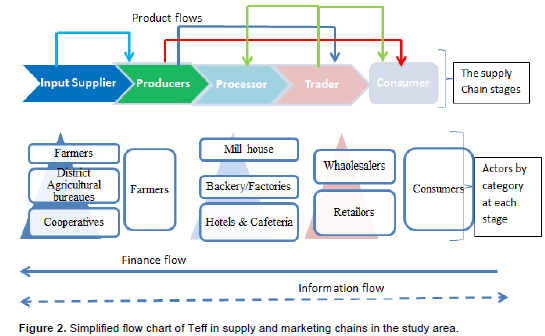
The simplified flow chart indicating the flows of products, information and finance in the supply chain for Teff in the study area was presented in Figure 2. The product flows sketched on the upper side of the figure was the representation of how the Teff reaches from producers to consumers and how the inputs reach from the input supplier to the producers. The study revealed that producers may sell their Teff to processors, traders or directly to consumers in an open market. The boxes below each stage of the supply chain indicate who the role players were at each stage. Accordingly, the input suppliers were identified as cooperatives (Farmers’ associations), the agricultural bureaus, and the farmers themselves. Producers in this case were farmers. Millhouses, bakery and food factories (bread factories), Enjera/Buden (soft bread, which is daily food in most households with different types of souses in Ethiopia) producing and selling institutions, and hotels and cafeteria were considered as processors. There were different types of traders operating in the chain. These traders were classified as wholesalers and retailers. The simplified flow chart indicates an overall insight to the major participants’ categories in the chain, otherwise in reality it was very complicated and was difficult to assign a chain actor to be classified only into one category. For instance, the same person can be both wholesaler and retailer. It was also not uncommon to find a person engaged in wholesale or retail trade of Teff cereal on one hand and engaged in processing Teff to flour (having Mill operation). Majority millhouses provide services to the consumers on fee basis but few were also engaged in buying Teff cereal and selling the flour. The background triangles at input suppliers, processors and traders indicate who was dominating the role played at the stage, for instance in input supply cooperatives play major role followed by agricultural bureaus, and farmers also supply input for other farmers, particularly seed. In most cases the relationships among these chain actors were random and they have no established partnership.
Finance flows were identified mostly simultaneously with the product flows where the payments were made immediately on transaction time. However, the study also obtained information that for few transactions relating to input purchase by farmers, credit were allowed, when the farmer considered was proved to be in financial problem by the local administration. In that case, the payment for the input price would be made the immediate coming harvesting time and the payment include calculated interest. As data obtained from chain actors indicated, information flows in the chain was very poor and the chain participants rarely know what the market looks could like ahead of the actual marketing time. Moreover, farmers claimed that the traders use oligopolistic power particularly during the harvesting season and offer lower price using the advantage that famers do not have price information in other markets down the chain including the central markets. Moreover, farmers also noted that they could not transport their Teff to far markets due to their lack of transportation capacity and time constraint; hence they prefer to sell at nearby local market.
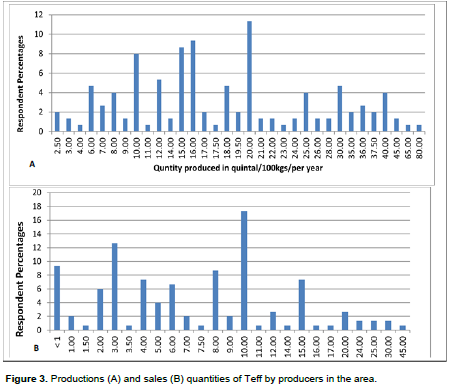
Production and marketing of Teff in the area
Figure 3 presented the production and sales quantities of Teff in the area. According to the result, the production of Teff in the area was dominated by farmers producing small quantity of Teff per year. The minimum production per farmer per year was 250 kg while the maximum production per farmer per year was 8000 kg. The total production was 2882 quintals or 288,200 kg of Teff per year for the 150 sampled households. The average production per year for the sampled farmers was 19.21 quintal or 1921 kg. The sales data also show the same situation with production where selling per farmer per year was described as smaller quantities. Of course, farmers sell the residual values of what they produced after home consumption and shrinkages due to losses at farmer stages. According to the result on Figure 3B, the minimum sales per farmer per year were less than 100 kg while the maximum sale was 4500 kg. For majority of the farmers the sales quantity was less than 10 quintals or 1000 kg of Teff per year. Total sales quantity from the sampled farmers was computed to be 798.33 quintal or 79833 kg and the average sales quantity was 5.32 quintal or 532 kg of Teff per year. This showed that, regardless of whether the farmers were producing large quantity or small quantity, majority (more than 90% were selling more than 100 kg per year) were selling Teff to get income in supporting their livelihood. If we relate sales quantity to production quantity for the sampled households, about 28% of Teff produced in the area was sold out by farmers. This is an indication that Teff is produced not only as food crop in the area but also as a cash crop.
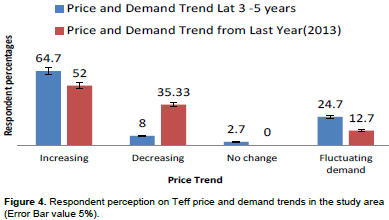
According to the result presented on Figure 4, significant proportion of respondents indicated an increasing trend of price and demand for the last three to five years as well as the trend with the last year harvest year. According to the result in Figure 4, 64.7% of respondent indicated that the demand and price over the last three to five years was increasing while 52% of the respondent noted the demand and price showed increasing trend with compared with the last percentage harvesting year. This price and demand trend is in line with a national inflationary trend for food commodities in Ethiopia (Headey et al., 2012).
Logistics practice, value activities and factors affecting value addition decisions
Logistics practices by Teff farmers
Storage and packaging: The storage system is a logistics used to store the product until the use for different motives which includes consumption at the later time, expectation of increase in price and grain saving for various contingencies in rural community such as wedding and death of family members for the feasts to be served to the community. As the result presented in Table 3 indicated, Gotara, gumbi/togogo, and sacks were indicated as storage facility used by farmers in the area with usage percentage of 53, 40 and 7%, respectively. The result indicated that Gotara and gumbi/togogo were important storage facilities, but the farmers use sacks as temporary storage facility when Gotara and gumbi/togogo were filled during harvesting time. Farmers stated they use sacks more as packaging material. All farmers stated that they use different kinds of sacks as packaging material for the Teff to be transported from threshing filed to home and from home to market and millhouses. Table 3 also showed the motive for storage where 37.33% of the participant households store their products expecting high price in the future, 24.67% store for saving purpose, and 38% store their product for home consumption. The pictures of Gotara and gumbi/togogo, which are main Teff storage facilities in the area, are presented in Figure 5. Gotara is made of Bamboo and the inside part is varnished by cattle dung whereas gumbi/togogo is made of purposively prepared mad glued by Teff straw. The advantage of these facilities is both are locally made and involve less cost. The disadvantage noted by the farmers was that Teff stored in these facilities is susceptible to damages caused by rats, floods, dampness, and fire. The chain actors’ in the area lack financial capacity to acquire small scale metallic silos that could potentially reduce such losses.
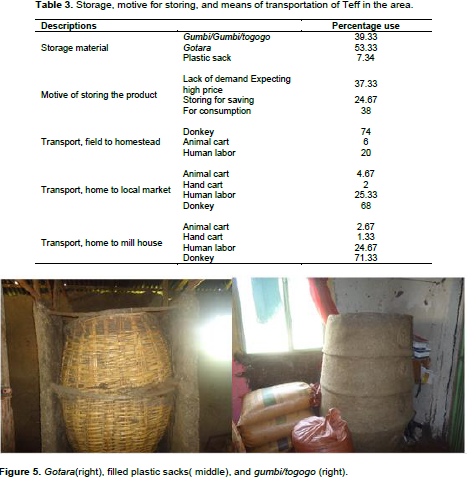
Transportation: The means of transportation used by farmers were human labor, donkey, animal cart, and hand cart. Donkeys play significant role as means of Teff transportation in the area. Majority of Teff transported by farmers were done by donkeys. As noted in Table 3, 74, 68 and 71% of Teff transported from field to homestead, from home to market, and from home to mill houses, respectively were done by donkeys. Next to donkeys, human labor based transport was used to transport higher proportion of Teff in the area with about 20, 25 and 25% of Teff transport from field to homestead, from home to market, and from home to mill houses were done by human labor, respectively. Animal cart and hand carts were also reported as means of Teff transport in the area but insignificant proportion of Teff was transported by these means.
Value adding activities and factors determining farmers’ value addition decisions
These value adding activities were assessed using Probit model as dichotomous response that the farmers either engaged in these activities (1) or not (0). Then, factors expected to have effect on these decisions were analyzed using marginal effect approach (Table 4).
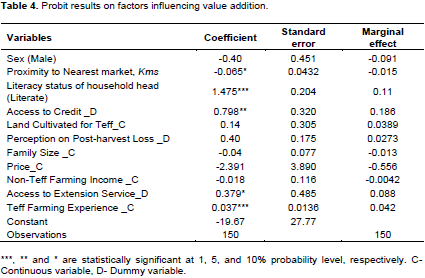
According to the result in Table 4, farming experience and literacy status of household head were identified as statistically significant factors influencing farmers’ value addition decisions at 1%, access to credit significantly affect farmers’ value additions at 5%, and access to extension services and proximity to nearest markets were influencing factors at 10%. According to the result (Table 4) at 1% statistical significance, the increase of Teff farming experience by one year and access to formal education at any level increases the probability of farmer’s participation in value addition by 4.2 and 11%, respectively. At 5% statistical significance, access to credit increases farmers’ probability of adding value by 18.6%. At 10% statistical significance, proximity to nearest market and access to extension service farmers’ probability of adding value by 15 and 8.8%, respectively.
Post-harvest losses of Teff in the supply chain
Level of Post-harvest losses as estimated by chain actors
The estimated post-harvest losses as percentages of Teff produced or handled at different stages are presented in Table 5. The loss at farmer stage which was estimated to be 8.49% was the highest in the chain indicating the farm level as the hotspot loss point for Teff in the study area. The losses at farm level were mainly caused by problems during harvesting, threshing, and transportation from harvesting site to homestead. Farmers reported lesser losses due to home storages and during transportation from home to market places and millhouses.
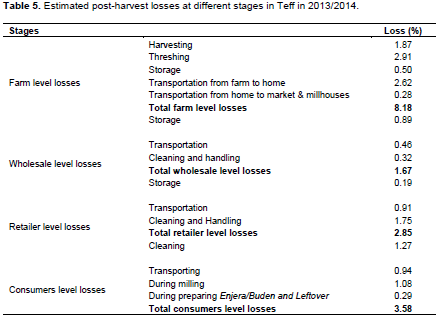
Teff losses during harvesting were estimated to be1.87%.These losses were mainly due to shedding of grains as a result of shattering during harvesting. Weather condition particularly rain sometimes aggravate this loss as noted by farmers. The farmers indicated losses during the threshing activities, which constitute the major part of farmer level loss (2.91%), were mainly due to activities during the process of separating the seed from the straw, eaten by cattle during threshing, and the field on which Teff threshing activity performed (stick to soil and mixed with soil that deteriorate quality).
The losses due to transportation from farm field to homestead were estimated to be 2.62%. These were mainly due to use of traditional methods of transportation used by the farmers. The losses as a result of problems of transportation from home to market and millhouses were estimated to be 0.28%. Majority of Teff was transported from field to homestead and from home to different market places using Donkeys. The farmers reported losses occur during loading and unloading of produce and while in the way to market. Farmers indicated the road condition contribute to this loss. Another element of the farmer level loss was losses that occur during storage (0.5%). As the information from farmers indicated, important factors leading to storage losses were non-availability of separate storage facility for various cereals, poor storage structures, and presence of rodents. Next to farmers, consumption level loss was high at 3.58%, which was caused during the cleaning process, during the milling, transporting, and preparation of Enjera/Buden. At wholesalers and retailers, storage, transportation, and cleaning and handling were reported as the activities associated with losses of Teff. These losses at different stages of Teff post-harvest system can’t be added to give us the overall percentage losses of Teff in the chain. This is due to: a) the percentage of purchases by different categories of traders and consumers directly from farmers and from each other was not known, b) the traders also buy Teff from other areas (out of these districts) for which the proportion was not known, c) the Teff produced in these districts could be consumed in other areas and Teff produced in other nearby districts could also be consumed in these districts. To sum, there is no clear Teff supply chain to exactly follow from production to consumption and under such situation it is not possible to sum the percentages. The percentage losses reported were for farmers from what they produced while for other chain actors from what they hold during specific period of time.
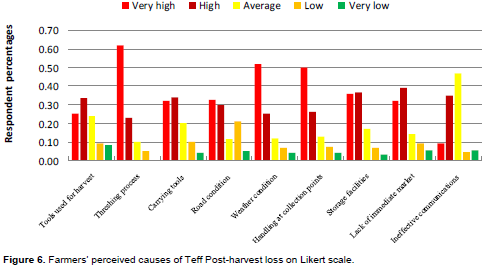
Figure 6 presented farmers’ perceived causes of post-harvest losses of Teff in the area. According to the result (Figure 6), majority of the farmer respondent believe that threshing process as one of the major cause of high level of post-harvest losses of Teff. If we just see the cumulative of very high and high (Red and Dark red) levels of losses, we may put threshing process, weather condition, handling at collection points (farmers’ cooperatives), storage facilities, lack of immediate market, harvesting tools used, and ineffectiveness of communication in the chain in order of severity (from harsh to lenient) as factors causing Teff post-harvest losses, as per the farmer respondent believe.
Determinates of Teff Post-harvest losses
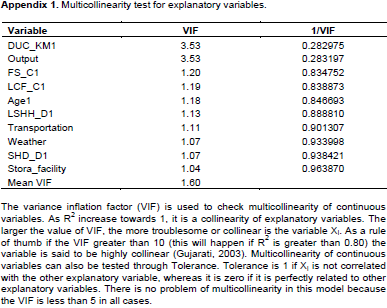
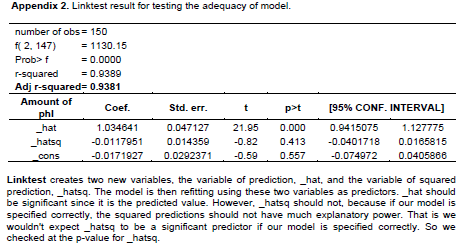
In addition to the subjective Likert scale loss factors assessment (Figure 6), Tobit model was used to assess factors that determine post-harvest losses of Teff at farmer stages in the area. Few of the factors included in the subjective Likert scale assessment were excluded from Tobit model because they don’t have clear measurement units or difficult to measure as dummy variables. Other variables included in Tobit model but excluded from subjective Likert scale were those which characterize the farmer and do not give sense asking them how these cause losses. According to the result presented in Table 6, statistically six of the variables included in the Tobit model significantly affect Teff post-harvest losses. Before running the Tobit model the hetroscedacity and multicollinearity problem were tested and proved that there were no problems of hetroscedacity and multicollinearity (Appendix 1 and 3). After running the Tobit model the model specification test was checked and from the result showed that there is no problem of model specifications (Appendix 2).
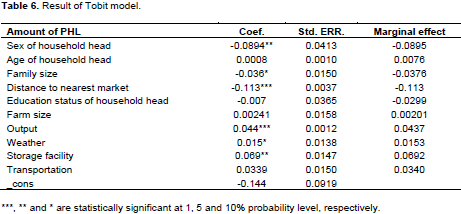
The result showed that sex of household head affects the amount of post-harvest loss at farm level negatively at less than 5% probability level. The marginal effect of sex on the amount of post-harvest loss was -0.8951 kgs per quintal among the Teff producers. This means that the fact that household head is female result in Teff Post-harvest losses of about 9% at 5% statistical significance. Household size was found to have a significant negative relationship with the level of post-harvest losses occurred at farm level at less than 10% probability level. This implies that when household size increases by one person the amount of post-harvest losses decreases by 0.036 kg per quintal. This means an addition of one person to the family reduces Teff post-harvest losses by 3.6%; note that in the model family size between the age of 8 to 60 years were used assuming these can be considered as active labor in the studied context. The post-harvest losses were also positively and significantly conditioned by total production of Teff at less than 1% probability level. The increases of Teff production by one quintal increase the amount of post- harvest by 0.044 kg or 4.4%. Bad weather conditions affect the amount of post-harvest losses at less than 10% probability level. This means the occurrence of bad weather condition (particular is rain) during different activities of post-harvest operation result in post-harvest loss of 0.0153 kg of Teff per quintal or 1.53% loss. Similarly, increase in the distance to the nearest market increase the quantity of Teff loss of 0.113 kgs per kilometer of distance. That means as the distance from the market center increases by one kilometer, Teff post-harvest loss increase by 11.3% at 1% statistical significance. Storage facility also affected the amount of post-harvest loss at farm level at 5% probability level. Post-harvest loss of Teff could decrease by 0.069 kg per quintal or 6.9% when the farmers use good storage facility.
Teff is an important cereal in Ethiopia both in terms of cultivated land coverage and value generated (Minten et al., 2013). However, this important cereal did not get enough attention from researchers and policy makers to the level required, particularly in areas of post-harvest losses and farmers’ value addition decisions. Assefa et al. (2013) stated “the low productivity status, and the lodging problem, still remain untouched and we have to be able to make as fast progress as possible before we can declare that the crop is no more an orphan crop.” According to the source, Teff, regardless of its economic importance and cultural heritage to Ethiopians, is among the orphan crops in terms of the research undertaking which needs attention from all concerned. The main results of this study, which may motivate further study and potential interventions, are discussed as follows.
This study identified similar findings with other sources (Assefa et al., 2013; Minten et al., 2013) in terms of the socio-economic importance of Teff. The proportion of land allocated for Teff in the area (89% of land owned) was far above the national proportion of cultivated land coverage by Teff of 24% (CSA, 2015) and other sources such as 32% (Refera, 2001) and up to 20% (Minten et al., 2013). This is because whereas the previous studies indicated national percentages of cultivated land covered by Teff, the current study was only for specific area where Teff was the major crop. This showed that Teff was the major livelihood support in the area. The production and consumption facts were other indications that Teff was major consumption cereal in the area. The fact that about 28% of Teff produced in the area was sold out and the fact that more than 90% the farmers in the area sold Teff indicated that Teff was also source of income for the farmers in the study area. This is an opportunity for Teff value chain development in this area. The increasing trend in demand and price and the fact that Teff is getting higher demand in central markets and also abroad to some extent (The Guardian, 2014) is another opportunity that has to be exploited with appropriate policies and interventions at different stages of Teff value chain.
The study result indicated the flows of Teff and associated information and finance in Teff value chain. The result noted that in the studied Teff value chain, the relationships among actors in the area can be argued as one characterized by silo mentality where each actor was more worried about his/her performance than the overall benefit to the supply chain. The study couldn’t even identify the conceptualization of mutual interest and benefit among the chain actors. The interview with key informants and chain actors showed that no one was concerned about the gain and losses of the other chain actor, their decisions purely lies on own cost-benefit trade-offs. Instead, the study identified an opposite situations where one chain actor try to exploit other chain actor. Farmers’ claim on traders for collectively and intentionally reducing Teff price particularly during harvesting time was an example. Famers’ cooperative institutions are trying to cope-up with this problem by buying Teff when price goes down and selling it when price goes up. However, significant number of farmers in the interview explained their worry on the situations of their cooperatives. Lack of transparency, bias in input distribution, and inefficiency related to management of the cooperatives were few problems the farmers noted regarding their cooperatives. Therefore, it needs further work to strengthen these cooperatives and establishment of trustful partnerships with other chain actors. Of course, this needs further work starting from awareness creation towards common goal and win-win cooperation among the chain actors. With such arrangements, smooth and effective flows of the product and associated finance and information could be attained.
Teff logistics practice in the area was one that could be argued as poor performing which causes post-harvest losses of Teff in the area. The means of transportation dominated by donkeys and human labor both before threshing and after threshing in conjunctions with poor road conditions were identified as major problems. The storage facilities used in the area were more of traditional; even though Teff by cereal nature is not much susceptible to insects, dampness and rats were major problems noted by chain actors causing losses due to the poor state of storage facilities. The study found farming experience, literacy status of household head, access to credit and extension services, and proximity to nearest markets as statistically significant factors influencing farmers’ value addition decisions.
Farming experience’s influence on farmers’ value addition decisions may arise due to the fact that with high experience, the farmers could identify the advantages and disadvantages of following certain value addition activities that is, experience gives time for learning that more experienced farmers have more accumulated information and knowledge regarding the value activities with their consequences. It may also influence value addition decision by influencing access to resources, that is, with long experience the probability for accumulated resources including land may increase and these could encourage the farmers to adopt the costly new inputs and farming technology easily than the farmers with less experience and less accumulated assets. This kind of result has been found by Ngore et al., (2011) where age of household was found to significantly affect the entrepreneurs’ meat value addition decisions in Kenya. Tough, age may not imply experience, experience implies age.
Literacy status of household head was found to influence farmers’ value addition decisions as expected. It was the most determining factor among the variables analyzed that an attendance of formal education by household head increases the probability of farmers’ value addition decisions by 11%. This may be attributable to the fact that education has capacity to influence other factors like management skills, household income, household size and access to capital, which would all have a positive effect on value addition. This result is in line with Mamo et al. (2014) that identified education status as significant factor affecting milk value addition decision in Walmara district in Ethiopia.
Access to credit is statistically significant at 5% probability level, which means farmers’ access to credit increases probability of engaging in adding value by 18.6%. This may be due to the fact that credit use enables the Teff producer to procure improved inputs and more efficient equipment that help to reduce the cost of operations. This finding is consistent with the finding reported by Ngore et al. (2011) who highlighted access to credit as a key determinant to value addition by meat agribusiness operators in Kenya. The discussion made with the farmers also noted high demand for purchase of inputs on credit in the two districts, tough only those proved to be financially constrained by the bureaucratic structure could access it.
Access to extension service is another variable that is expected to influence farmers’ value addition decisions. The result confirmed to the expectation and access to extension services was found to increase the probability of farmers’ values adding decisions by 8.8 at 10% statistical significance. This implies that access to extension services enables Teff producers to use modern inputs and other value addition activities and access market information which makes farmers to know the demand for his/her value added produce. Doss and Morris (2001) found similar findings that farmers’ number of contact with extension agent had a positive effect on adoption of agricultural innovations in Ghana. This result is also consistent with Kuma et al. (2011) that explained positive relationship between farmers’ value addition decision on milk and access to extension services.
Proximity to nearest market from a household home increased the probability of participation of farmers in value addition by 15%. That is, the nearer the Teff farmer to the market, the higher the probability to participate in value addition. This may be due to the fact that when the market is near to them the farmers understand what the consumers demand in terms quality and variety, hence willing to engage in value adding activities. This suggests that investing in infrastructures like rural road and market could bring better quality Teff to the market.
Based on the subjective estimate by chain actors, the levels of losses at different stages of Teff value chain were identified. The result noted farmers’ stage as a hotspot loss points. However, with lack of literature for detailed actual loss measurements at different stages of the Teff value chain against which to compare these facts, it may be difficult to exactly trust the loss percentages. However, the observation made in the farming practice and farmers feeling which was expressed through their proverb were convincing for the existence of significant amount of Teff loss in the studied value chain. Sources such as (Rembold et al., 2011), indicated out of total annual production of Teff 11.7% was lost postharvest. The overall loss estimated in this study seems somehow similar to this fact. However, as both the previous study and current study were based on subjective estimates, the important aspect we may take for grant was only the existence of significant Post-harvest losses of Teff. The lack of objective loss assessment methods for Teff and similar cereals were claimed since long time (Harris and Lindblad, 1978), though no satisfactory solution has been given so far. This may be the reason why researchers were not attracted to study Teff and other similar cereals postharvest losses. The current study found difficult to obtain scientific paper dealing with postharvest loss of Teff. Therefore, it is worth mentioning the limitation in this regards and a call to stakeholders to deal with this problem with required resources and knowledge.
Using the Likert scale loss assessment by farmers, threshing process was identified as the major activity where highest losses of Teff happen. Using the Tobit model, this study attempted to identify what factors were significantly causing the losses of Teff at farmer stages. Accordingly, sex, family size, level of output (production), bad weather condition, distance to the nearest market, and storage facilities were found significantly affecting Teff Post-harvest losses in the area.
Gender impact: Female farmers were found to be more prone to high levels of losses than their male counterparts. This could be due to the fact that Teff is very labor intensive. Generally, male headed households tend to have more man- hours available for Teff harvesting and other farming activities compared to their female counterparts who have additional tasks or family responsibilities at home reducing their available man-hour. In addition to these, female farmers may not be physically as strong as male farmers due to biological and sociological gender (socially constructed and accepted) matters. Therefore, ceteris paribus, women tend to use longer period for Post-harvest activities of Teff which results in high levels of Post-harvest losses.
Impact of family size: Referring to the labor intensive Teff farming practice, increase in active labor family size is expected to reduce Post-harvest losses. As expected the result showed that when household size increases by one person the amount of post-harvest losses decreases by 3.76%. This is complementary with the gender result, that more available man-hour is critical to reduce Post-harvest losses of Teff.
Level of Output: The study identified increase in production level associated with high level of Post-harvest losses. This may be due to the fact that as the amount of Teff production increases, it became difficult for farmers to harvest on time the whole production due to lack of manpower. This finding is consistent with the finding of (Basavaraja et al., 2007) who showed positive relationship between the amount of post-harvest losses and amount of wheat and rice produced in India.
Impact of weather condition: As expected, bad weather condition was associated with high post production losses in the area. Particularly, rain during post production activities was claimed causing losses. This is also similar with Basavaraja et al. (2007) findings.
Distance to the nearest market: Higher Post-harvest losses are expected to be associated with far distance of farmers’ homestead from market centers. This is because as the distance increases, the hassles in transportations increase. Particularly, in situation of bad road conditions and poor transport facilities this may result in more losses. The result of the Tobit model confirmed to the expectation that a one kilometer increase in distance may result in 11.3% increase in Teff Post-harvest losses at 1% statistical significance. This result is similar with studies by Ayandiji et al. (2011) on Tomato. High losses of Tomato with long distance to market may be attributable not only to distance and hassles in transport but also the time it takes in transport that contributes to losses as perishable produce. But in case of Teff, the reason of loss in relation to long distance could be argued only from transportation problems as Teff is not perishable that is, Teff is susceptible to loss of spillages and dampness due to long and poor state of transportation.
This study attempted to explore Teff value chain in two districts of central Ethiopia. Accordingly, major chain actors were identified as: farmers and their cooperatives, district agricultural bureaus, wholesale and retail traders, millhouses, Enjera/Buden sellers, hotels and cafeteria, and individual consumers. The nature of relationships and flows of products, information, and finance were described by open and untraceable chain without any standing relationships among chain actors. The study couldn’t identify the concept of mutuality and trust among the chain actors rather a silo mentality where each actor was more worried about own benefit than the overall benefit to the supply chain. Particularly, farmers’ relationships with traders seemed scary to the farmers that most farmers claimed that traders in the area use oligopolistic power to reduce price particularly during the harvesting time. However, farmers’ cooperatives stated their major objectives was balancing the price of Teff by buying during harvest time when price gets down and selling at the time price gets better .On the other hand, majority of all category chain actors indicated an increasing price and demand trend overtime, therefore farmers’ claim were against their expectations. The relationships between production, sells and land allocation issues in the area indicated that Teff is not only food crop but also cash crop that supports the livelihood of the farmers in the area.
The assessment on elements of logistics functions noted that donkey and human labor serving major role as means of transportation, gotara and gumbi/togogo as major storage facility, and plastic sacks as major packaging material.
The probit model result revealed farming experience, access to extension services, proximity to nearest markets, level of education of household head, and access to credit as statistically significant factors influencing farmers’ value addition decisions. Attendance of formal education was statistically the most determining factor for farmers’ value addition decisions with an attendance of formal education at any level leading to an increase in probability of farmers’ value addition decisions by 11% at 1% statistical significance.
Post-harvest losses of Teff at different stages of the value chain were estimated by the chain actors as percentages of what they produced or hold during specific period of time. Accordingly, the farmers’ stage loss was reported as the highest percentage losses hence could be considered as hotspot loss point. However, due to the open flows of Teff from/to the area it was not possible to add the losses at different stages of Teff value chain to know the overall loss percentages. On the other hand, for the farmers’ stage loss farmers were asked what they know causing the losses on a Likert scale where factors were assessed as causing from very high losses to very low losses. Accordingly, farmers’ identified factors in order of severity (from harsh to lenient) that stakeholders need to give attention to reduce Teff losses in the area as: threshing process, weather condition, handling at collection points (farmers’ cooperatives), storage facilities, and lack of immediate market, harvesting tools used, and ineffectiveness of communications.
The result of the Tobit model on determining factors of Teff Post-harvest losses at farmers’ stage revealed that sex, family size, level of output (production), bad weather condition, and distance to the nearest market were found significantly affecting Teff Post-harvest losses in the area.
The authors have not declared any conflict of interests.
We are grateful to RELOAD project for funding the activities of this study. Particularly, we are thankful to Professor Oliver Hensel and Mr Michael Hesse (RELOAD project coordinators), Ambo University, and Swedish University of Agricultural Science, department of Energy and Technology for supporting this study in all dimensions. Our special thanks also go to all chain actors who provided with the data and technical support. Thank you all.
REFERENCES
|
Assefa K, Chanyalew S, Tadele Z (2013). Achievements and Prospects of Tef Improvement, International Workshop Proceedings, University of Bern, Institute of Plant Sciences, Switzerland.
|
|
|
|
Ayandiji A, Or A, Omidiji D (2011). Determinant Post Harvest Losses Among Tomato Farmers In Imeko-Afon Local Government Area Of Ogun State, NIgeria. Glob. J. Sci. Front. Res. P 11.
|
|
|
|
|
Basavaraja H, Mahajanashetti S, Udagatti NC (2007). Economic analysis of post-harvest losses in food grains in India: a case study of Karnataka. Agric. Econ. Res. Rev. 20:117-126.
|
|
|
|
|
CSA (2015). The Federal Democratic Republic of Ethiopia Central Statistical Agency Agricultural Sample Survey: Area And Production Of Major Crops.
|
|
|
|
|
Doss CR, Morris ML (2001). How does gender affect the adoption of agricultural innovations? The case of improved maize technology in Ghana. Agric. Econ. 25:27-39.
Crossref
|
|
|
|
|
FAO (2014). Food Loss Assessments: Causes and Solutions: Case Studies in Small-scale Agriculture and Fisheries Subsectors in Kenya. Food & Agriculture Organization of The United Nations, Rome.
|
|
|
|
|
Gustavsson J, Cederberg C, Sonesson U, Van otterdijk R, Meybeck A (2011). Global food losses and food waste. Food and Agriculture Organization of the United Nations, Rome.
|
|
|
|
|
Harris KL, Lindblad CJ (1978). Post-harvest grain loss assessment methods. Minnesota, America Association of Cereal Chemist, P 193.
|
|
|
|
|
Headey D, Nisrane FB, Worku I, Dereje M, Taffesse AS (2012). Urban Wage Behavior and Food Price Inflation: The Case of Ethiopia. ESSP-II Working Paper, 41.
|
|
|
|
|
Hodges RJ, Buzby JC, Bennett B (2011a). Postharvest losses and waste in developed and less developed countries: Opportunities to improve resource use. J. Agric. Sci. 149:37-45.
Crossref
|
|
|
|
|
Hodges RJ, Buzby JC, Bennett B (2011b). Postharvest losses and waste in developed and less developed countries: Opportunities to improve resource use. J. Agric. Sci. 149:37-45.
Crossref
|
|
|
|
|
Kaplinsky R, Morris M (2001). A handbook for value chain research, IDRC Ottawa.
|
|
|
|
|
Ketema S (1997). Tef-Eragrostis Tef (Zucc.), Bioversity International. Vol. 12.
|
|
|
|
|
Kuma B, Getnet K, Baker D, Kassa B (2011). Determinants of participation decisions and level of participation in farm level milk value addition: The case of smallholder dairy farmers in Ethiopia.
|
|
|
|
|
Kummu M, De Moel H, Porkka M, Siebert S, Varis O, Ward PJ (2012). Lost food, wasted resources: Global food supply chain losses and their impacts on freshwater, cropland, and fertiliser use. Sci. Total Environ. 438:477-489.
Crossref
|
|
|
|
|
Mamo T, Tefera T, Byre N (2014). Factors influencing urban and peri-urban dairy producers' participation in milk value addition and volume of milk value added in Welmera Woreda, West Shewa Zone of Oromia Regional State, Ethiopia. Int. J. Livest. Prod. 5:165-172.
Crossref
|
|
|
|
|
Minten B, Tamru S, Engida E, Kuma T (2013). Ethiopia's value chain on the move: the case of teff. ESSP Working Paper series 52, 1-26.
|
|
|
|
|
Ngore P, Mshenga P, Owuor G, Mutai B (2011). Socioeconomic factors influencing meat value addition by rural agribusinesses in Kenya. Curr. Res. J. Soc. Sci. 3:453-464.
|
|
|
|
|
Nutrition Data (2015). http://nutritiondata.self.com/facts/cereal-grains-and-pasta/10357/2
|
|
|
|
|
Olsson U (2011). Statistics for life science. Studentlitteratur.
|
|
|
|
|
Parfitt J, Mark B, Sarah M (2010). Food waste within food supply chains: quantification and potential for change to 2050. Philosophical Transactions of the Royal Society B: Biological Sciences 365(1554):3065-3081.
Crossref
|
|
|
|
|
Pedreschi R, Lurie S, Hertog M, Nicolaï B, Mes J, Woltering E (2013). Postâ€harvest proteomics and food security. Proteomics 13:1772-1783.
Crossref
|
|
|
|
|
Refera A (2001). TEF: Post-harvest operations. Institute of Agricultural Research Organization, Holetta Agricultural Research Center (IARO), P 60.
|
|
|
|
|
Rembold F, Hodges R, Bernard M, Knipschild H, Léo O (2011). The African Postharvest Losses Information System (APHLIS). European Union, Luxembourg.
|
|
|
|
|
The Guardian (2014). Move over quinoa, Ethiopia's Teff poised to be next big super grain
|
|
|
Tobin J (1958). Estimation of relationships for limited dependent variables. Econometrica: J. Econ. Soc. pp. 24-36.
|
|
|
|
|
WFP (2014). Hunger Map of 2014. World Food Programme.
|
|
|
|
|
Wooldridge J (2012). Introductory econometrics: A modern approach, Cengage Learning.
|
|
APPENDIX
Appendix 3. Heteroskedasticity test result.
Breusch-Pagan / Cook-Weisberg test for heteroskedasticity
Ho: Constant variance
Variables: fitted values of AmountofPPL
chi2(1) = 41.11
Prob > chi2 = 0.15
The null hypothesis residuals variance is homogenous. Therefore, if the p-value is less than 10% probability, we would have to reject the hypothesis and accept the alternative hypothesis that the variance is not homogenous. Based on the rule we can conclude that there is no problem of here skedasticity in the model.