ABSTRACT
In the analysis of variance, the comparison of means is essential when the calculated F is significant at 0.05 or 0.01 probability level and there are more than two treatments, because the significant F only rejects the null hypothesis, according to which the treatments or samples do not differ statistically. This study was aimed at to evaluate the similarities and differences between the classifications of means of Tukey, SNK, Scott-Knott and Duncan tests, as well as to demonstrate the performance of the software Assistat in the analysis of experimental data of the agricultural research. Data of agricultural experiments were analyzed using the models of the analysis of variance (ANOVA), as completely randomized and randomized block experiments. It was concluded that the Tukey test provides more-detailed results in comparison to the tests of Duncan, Scott-Knott and SNK, but not very different, and it is the most used test. The tests of Duncan, Scott-Knott and SNK tend to show similar results, except for the fact that, in the Scott-Knott test, no mean can belong to more than one group. The tests of Duncan and SNK, for being similar, except for the utilized distribution, almost always show the same results.
Key words: Assistat, Tukey test, Duncan test, Scott-Knott test, SNK test.
For the comparison of means, according to Zimmermann (2004), currently there are more than ten tests, but the most common are: t or LSD, Tukey or HSD, Duncan, Student-Newman-Keuls or SNK, Scheffé and Dunnett. Comparatively, each one of them has advantages and disadvantages and can be used in the comparisons between all pairs of treatments (Tukey, Duncan, SNK and LSD), or between groups of treatments (Scheffé, LSD and Scott-Knott), or between each treatment against one of them (control), which is the case of the Dunnett test. The selection of the test to be used depends solely on the researcher, according to the type of hypothesis formulated. Two of these tests are different; Dunnett’s, which compares each one of the means with the control (Zimmermann, 2004), and Scott-Knott’s, which is actually a grouping technique that separates the means in different groups; its advantage is that no mean can belong to more than one group. The other tests compare the means and classify them with letters.
Vieira (2006) claims that, in order to answer questions comparison of means, but there is no test better than the of the researchers on which is/are the best mean(s) and which is/are different, it is necessary to apply a test of others; all of them have advantages and disadvantages, and it is also worth remembering that the tests of comparison of means must be seen more as indicators of the reality than as exact solutions.
For Santos et al. (2008), the knowledge on the power of the tests is extremely limited and variable, to the point of allowing the selection of procedures with very discrepant characteristics (error rate through experiments or through comparisons). This causes these procedures to lose credibility, since the conclusions can be different according to the procedure employed. In the field of biology, there are also restrictions, because often it is more adequate an estimation procedure than a test of hypothesis, since a difference statistically significant could be depreciable from the biological point of view.
According to Gomes (2009), the application of the Duncan test is more laborious than that of Tukey’s, but more-detailed results are obtained, that is, Duncan’s indicates significant results in cases in which the Tukey test does not allow to obtain statistical significance. As the Tukey test, Duncan’s, for being exact, requires that all treatments have the same number of replicates. Still according to Gomes (2008), the Scheffé test is of more general use compared with Tukey’s and Duncan’s and the Bonferroni test is an improvement over the t-test, which is very good for a small number of contrasts. This study aimed at to evaluate the similarities and differences between the classification of means of the Tukey, SNK, Scott-Knott and Duncan tests, as well as to show the performance of the software Assistat in the analysis of experimental data of the agricultural research.
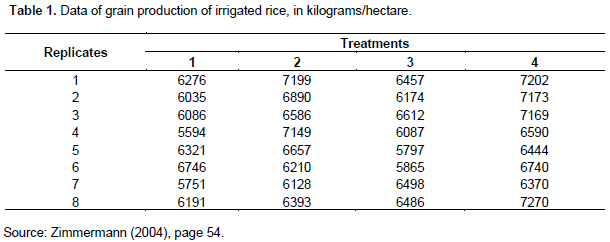
The evaluations used data of agricultural experiments found in the literature, for completely randomized and randomized block designs. For the completely randomized design, data of one experiment (Zimmermann, 2004) were used. This experiment tested four forms of application of nitrogen fertilization in irrigated rice, and the response variable was the production, whose data are shown in Table 1. The treatments were the following amounts of fertilizer in kilograms/hectare:
1= 80 at planting;
2 = 40 at planting and 40 at 40 days after emergence (DAE);
3 = 13.2 at planting and 66.8 at 40 DAE; and,
4 = 13.2 at planting and 33.4 at 40 and 60 DAE.
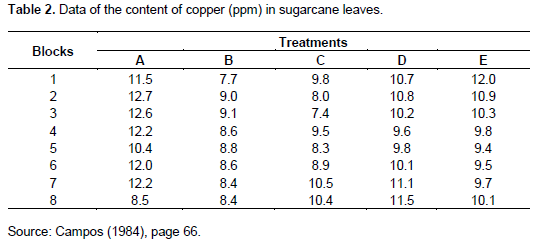
For the randomized block design, data of two experiments were used. In the first one (Campos, 1984), the response variable was the content of copper (in ppm) in sugarcane leaves (Table 2), with eight blocks, testing the following treatments:
A = Leaves with no cleaning;
B = Leaves cleaned with only the passing of an attached brush and vacuum cleaner;
C = Leaves washed with running water and rinsed off in distilled and demineralized water;
D = Leaves washed in diluted detergent solution (at 0.1%), then distilled water, 0.1% N HCL and finally demineralized water; and,
E = Leaves washed in diluted detergent solution (at 0.1%), rinsed off with distilled water to remove the detergent and finally with demineralized water.
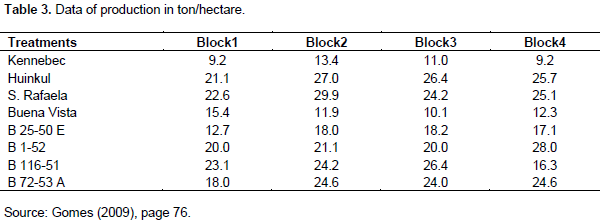
The second experiment in randomized blocks (Gomes, 2009) evaluated the competition between potato varieties and the response variable was the production, with eight treatments and four blocks, as shown in Table 3.
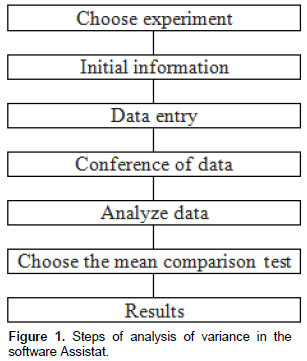
The software Assistat (Silva and Azevedo, 2006) was used to evaluate the data. The comparison of means was performed through the tests of Tukey, SNK (Student, Newman and Keuls), Scott-Knott and Duncan, which are according to Gomes (2009), Scott and Knott (1974) and Zimmermann (2004). The software Assistat is available at http://www.assistat.com. The software Assistat was developed by Professor Francisco de A. S. e Silva of the Federal University of Campina Grande, Brazil. This software is distributed free of charge. Figure 1 shows the steps of an analysis, in the results screen you can go back and choose another test of comparison of means.
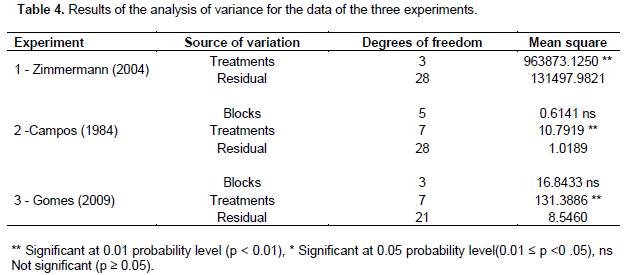
Table 4 shows the result of the analysis of variance for the three experiments, whose data were shown in Tables 1, 2 and 3. The effect of treatment was significant in the three cases, which means that there is a difference between the treatments and that it is necessary to apply a test of comparison of means. For better evaluation of the differences between treatments, the means of the data in Table 1 were compared using four tests of comparison of means, as shown in Table 5. This allows to evaluate the most concordant and discordant ones. It is noted that the tests of SNK, Scott-Knott and Duncan showed identical classifications, but the Tukey test showed a more detailed classification; however, for the means 2, 3 and 4, their classification was the same.
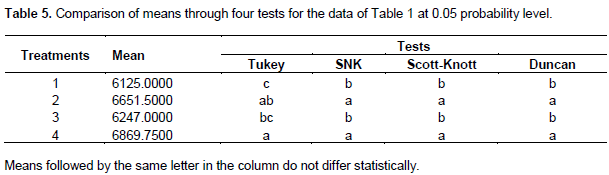
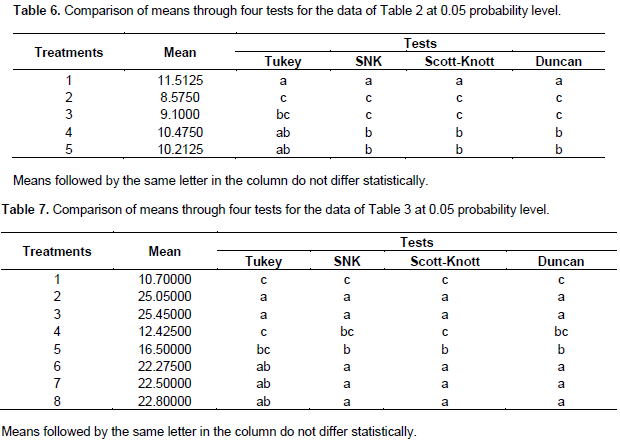
In addition, it is observed that the four tests agreed with respect to the difference existing between the means 1 and 4.The comparison of means for the treatments of the data in Table 2 was also performed through four tests, as shown in Table 6. As in the previous analysis, the classification of means by the tests of SNK, Scott-Knott and Duncan was the same and, again, the Tukey test showed a more detailed classification, demonstrating a pronounced sensitivity to small differences between means, which always occurs with this test. In regard to the means 1 and 2, the four tests agreed on their classification.
Table 7 shows the comparison of means for the data of Table 3. It is observed that the four tests showed the same results for the treatments 1, 2 and 3 and, considering the first letters, they were concordant in the treatments 5, 6, 7 and 8. For the treatment 4, the tests of Tukey and Scott-Knott showed a result different from those of SNK and Duncan, which were in agreement, as the first two. Once more, the Tukey test was sensitive to the smallest differences, showing a more detailed result.

The classifications of the means of Tables 5, 6 and 7 indicate that, for number of treatments lower than or equal to 8 and well defined differences between them, the tests of SNK, Scott-Knott and Duncan tend to show the same results, and that the Tukey test tends to show results that partially agree with those of the other three, but with a more detailed classification. This more detailed classification of the Tukey test may be due to a somewhat excessive rigor of this test, according to Gomes (2009), and to a higher control of Type I error, reported by Sousa et al. (2012) and Girardi et al. (2009), who observed lower percent rates of this error in comparison with the tests of Duncan and SNK.
In the three tables, it is also noted that the tests of Duncan and SNK have precisely the same results, which was expected, since the only difference between them is basically that the SNK test uses the q distribution of Tukey, whereas Duncan’s uses the z distribution (Zimmermann, 2004). Although there is no reason for the Tukey test to be the most used, because definitely there is not a test better than the others, all of them have advantages and disadvantages (Vieira, 2006). In spite of that, it is by far the most used. Twenty articles that used the software Assistat were reviewed and, in sixteen of them, the Tukey test was applied. Therefore, sixteen out of twenty, i.e., 80% used the Tukey test and this is consistent with Caeirão (2006), who observed that, in 103 tests with barley, the Tukey test was used in 79.9% of them.
The Tukey test showed more-detailed results compared with Duncan, Scott-Knott and SNK, but not very different, and it is the most used test. The tests of Duncan, Scott-Knott and SNK tend to show similar results, except for the fact that, in the Scott-Knott test, no mean can belong to more than one group. The tests of Duncan and SNK, for being similar, except for the utilized distribution, almost show the same results.
The authors have not declared any conflict of interests.
REFERENCES
|
Caeirão E (2006). Aplicação dos testes de comparação de médias em ensaios de cevada. PESQ. AGROP. GAÚCHA, PORTO ALEGRE 12(1-2):51-55.
|
|
|
|
Campos H (1984). Estatística experimental aplicada à experimentação com cana-de-açucar. São Paulo: FEALQ 292 p.
|
|
|
|
|
Girardi LH, Cargnelutti Filho A, Storck L (2009). Erro tipo I e poder de cinco testes de comparação múltipla de médias. Rev. Bras. Biom., São Paulo 27(1):23-36.
|
|
|
|
|
Gomes FP (2009). Curso de estatística Experimental. 15ed. Piracicaba: FEALQ 451 p.
|
|
|
|
|
Santos JW, Almeida FAC, Beltrão NEM, Cavalcanti FB (2008). Estatística experimental aplicada. 2ed. Campina Grande: EMBRAPA. 461 p.
|
|
|
|
|
Scott AJ, Knott MA (1974). A Cluster analysis method groupig means in the analysis of variance. Biometrika 30:507-512.
Crossref
|
|
|
|
|
Silva FAS, Azevedo CAV (2006). A New Version of The Assistat-Statistical Assistance Software. In: WORLD CONGRESS ON COMPUTERS IN AGRICULTURE, 4, Orlando-FL-USA: Anais... Orlando: Am. Society Agric. Biol. Eng. pp. 393-396.
|
|
|
|
|
Sousa CA, LiraJunior MA, Ferreira RLC (2012). Avaliação de testes estatísticos de comparações múltiplas de médias. Rev. Ceres vol.59 no.3 Viçosa May/June 2.
Crossref
|
|
|
|
|
Vieira S (2006). Análise de variância (ANOVA). São Paulo: Atlas 204 p.
|
|
|
|
|
Zimmermann FJP (2004). Estatística aplicada à pesquisa agrícola. Santo Antônio de Goiás: Embrapa Arroz e Feijão 402 p.
|
|