ABSTRACT
The present study was carried out to analyze chemical descriptors present in the raw coffee bean and to establish an association of these descriptors with the sensorial quality of the coffee beverage, based on expressions resulting from the interactions of coffee genotype, environment, and processing. The chemical descriptors caffeine, trigonelline, sucrose, and isomers of chlorogenic acid (3-CQA, 4-CQA, and 5-CQA), were analyzed through the use of high performance liquid chromatography (HPLC). Trained and qualified cuppers, certified as judges of specialty coffees, carried out the sensorial analysis using the methodology proposed by the Specialty Coffee Association of America (SCAA). Based on the cultivation environment, altitude and the genotype, it was possible to associate the chemical composition of the raw coffee bean with the coffee beverage sensorial quality. Yellow Bourbon cultivated above 1,200 m of altitude present higher contents of trigonelline and 3-CQA in the raw beans as well as high sensorial quality in the beverage.
Key words: Altitude, multidimensional scaling, slope exposure, Yellow Bourbon, coffee processing.
Classical genetics theory defines phenotype as a characteristic that describes an organism through its gene expression, the influence of its environment, and through the possible interaction between these two factors. Genotype, in turn, is defined as the hereditary information present in an organism’s genome. These definitions can be used for a better understanding of the coffee quality phenomenon through the expression of chemical compounds present in coffee beans (Figueiredo et al., 2013; Leroy et al., 2006; Taveira et al., 2014).
The quality of the beverage, represented by flavor and aroma formed in the roasted beans is associated directly with the chemical composition of the raw bean. On the other hand, chemical compounds present in the coffee beans are influenced by various factors throughout the production chain (Sunarharum et al., 2014).
Several researchers throughout the world have investigated the phenomenon of coffee sensorial quality. These studies involve various analyses such as the effect of environmental and genetic factors and of interferences that arise from coffee processing (Avelino et al., 2005; Bertrand et al., 2012, 2006; Borém et al., 2013; Decazy et al., 2003; Figueiredo et al., 2013).
Some environmental factors are strongly associated with the production of coffees of high sensorial quality. This association is especially true for factors that have a greater impact on the origin of chemical compounds present in the raw bean. Examples of these are the altitude and slope exposure of the coffee field as well as climatic factors such as temperature and precipitation (Avelino et al., 2005; Barbosa et al., 2012; Decazy et al., 2003; Guyot et al., 1996; Joët et al., 2010).
The genetic variability between and within coffee species results in beverages with distinct sensorial profiles. One of the explanations for this fact is related to the differences observed in the chemical composition of the beans as a function of the genetic material analyzed (Leroy et al., 2006). These differences become even more significant when the effect of processing is taken into account, because the metabolism of fruits and beans remains active even after they are harvested. Thus, the extension of certain metabolic reactions that occur in the bean depend on stimuli that result from the type of processing used, such as the action of removing or leaving intact parts that constitute the fruit (Bytof et al., 2005, 2007).
Another determining factor in the evaluation of coffee sensorial quality is related to the stage of fruit maturation. If the coffee fruits are harvested still immature, the lot will present beans with several chemical compounds associated with sensorial perceptions disfavored by consumers, such as astringency. Conversely, fruits harvested in a more advanced stage of maturation are subject to microorganism attacks, which accelerate the bean deterioration process. In addition, several toxins are generated as a byproduct of the action of these microorganisms (Borém et al., 2014).
In an attempt to supplement the coffee sensorial description, some chemical compounds present in the raw bean have been associated with coffee beverage quality. Currently, the main compounds being investigated are chlorogenic acid isomers (3-CQA, 4-CQA, and 5-CQA), caffeine, trigonelline, and sucrose (Farah and Donangelo, 2006; Franca et al., 2005; Malta et al., 2003; Silva et al., 2005).
Nevertheless, there are still unanswered questions that require a deeper technical and scientific investigation, especially regarding compound groups resulting from interactions between environmental, genetic, and technological factors that are involved in the processes of coffee production.
The lack of knowledge regarding coffee beverage quality is an obstacle to the development of some strategies, such as launching new varieties through genetic improvement with the aim of producing coffees with exotic flavors and aromas in unsuitable areas. Thus, it is essential to develop a scientific and fundamental base that amply identifies chemical descriptors associated with coffee beverage quality. In order to do that, it is necessary to restrict the studied area to geographical regions that present large environmental variation and express coffee sensorial quality in an evident, well-known, and consistent way (Barbosa et al., 2012).
Therefore, the objective of the present study was to analyze, during consecutive harvests, the effect of genotype, environment, and processing interaction on the contents of trigonelline, caffeine, sucrose, 3-CQA, 4-CQA, and 5-CQA present in the raw bean. More specifically, the present study attempted to verify the relation between the analyzed contents of chemical compounds and the sensorial quality of the coffee beverage.
Experiment description
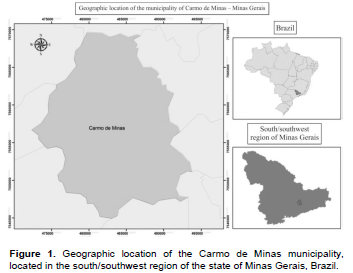
Coffee samples of the C. arabica L. were collected during three growing seasons (2009/2010, 2010/2011 and 2011/2012) in commercial plantations from properties located in the municipality of Carmo de Minas, Minas Gerais, Brazil (Figure 1).
The experimental design was based on the investigation of the interaction between environmental, genetic, and processing variables.
The coffee field environment was stratified into three altitude categories (more less or equal to 1,000 m, between 1,000 and 1,200 m, more than or equal to 1,200 m) and two slope exposure groups, Sun and Shade, resulting in six environmental variable combinations. The slope exposure groups were defined using cardinal points. The samples collected from crops with the slope aspect facing the W, NW, N, and NE represented the Sun group, and the samples collected from crops with the slope aspect facing the E, SE, S, and SW represented the Shade group.
Fruits of Yellow Bourbon genotype, yellow fruits and Acaiá genotype, red fruits were collected from each environment. Three repetitions were collected and processed using either the dry or the wet method, for all combinations involving environment and genotype, totaling 72 samples per harvest.
Coffee harvesting and processing
In order to evaluate the maximum potential of sensorial quality, harvesting was carried out manually and selectively, ensuring that only mature fruits were picked. Thereafter, fruits were separated by density, with only denser fruits being selected. After this hydraulic separation, another manual selection was carried out to ensure that the samples constituted only dense fruits in their maximum stage of maturation. In addition, all procedures related to processing and drying were performed based on recommendations for coffee post-harvest best practices (Borém et al., 2014).
Sample storage and processing
After drying, the samples were packaged in paper sacks that were then placed in plastic bags, identified, and stored in a chamber under a controlled temperature of 10°C and relative humidity of 60% for 30 days. Thereafter, samples were hulled and the beans were separated by shape and size. Only flat-sided beans of screen size 16/64 to 18/64 inches were used. Flat beans retained in the 19/64 inch screen as well as peaberries retained by a screen with oblong perforations of 11 × 3/4 inches were eliminated. Subsequently, all defective beans were removed from the sample. This procedure guaranteed bean uniformity, thus minimizing interferences nor related to the genetic material, different combinations of environmental factors in field locations, and methods of processing. Subsequently, the coffee samples were prepared for chemical and sensory analysis.
Moisture content
The moisture content of the raw coffee beans was determined by the oven method, at 105±1°C, for 16±0.5 h, based on ISO 6673 (2003). The results were expressed as a percentage in wet basis (%wb).
Chemical analyses
Chemical analyses were carried out in the raw coffee beans. The contents of caffeine, trigonelline and the isomers of chlorogenic acids (3-CQA, 4-CQA, and 5-CQA) were determined simultaneously based on the adapted methodology of Farah et al. (2005). Sucrose determination was carried out through another analysis, according to the adapted methodology of Trugo et al. (1995).
Sample preparation
In preparation for the chemical analyses, raw beans were ground in an IKA brand analytical mill, Model A11 Basic, with liquid nitrogen. For the extraction of the oils and other apolar substances, 1.0 ml of hexane was added to approximately 100 mg of each ground sample of raw coffee beans and thereafter weighed in micro-centrifuge tube, and placed in an ultrasonic bath for 10 min and centrifuged at 6.000 rpm (Casal, 2004).
Extraction and analysis of chlorogenic acids, caffeine, and trigonelline
One hundred milligrams of each ground and degreased sample was placed in a microcentrifuge tube that was then suspended in 1.0 mL of HPLC grade methanol at 60% for the extraction of the chlorogenic acids, caffeine, and trigonelline. Tubes were placed in an ultrasonic bath for 15 min. After centrifuging, at 6.000 rpm, the supernatant solution was diluted at 1:10 in ultrapure water. After filtration in membrane of 0.20 μm, 20 μl of the samples were injected in liquid chromatography.
The system consisted of UV-Vis SPD-20A detector (Shimadzu, Kyoto, Japan). Samples and standardized solutions were analyzed in a Nucleodur 100-5C18 column, 250 mm × 3.0 mm, 5 μm (Macherey-Nagel). Analyses were carried out through the isocratic elution of methanol for HPLC/10 mM of citric acid pH 2.5 (25:75) at room temperature and with a flow of 0.7 mL.min-1.
Results were defined by the relation of the peak areas of caffeine, trigonelline and 5-CQA compared to known concentration standards. The quantification of the other isomers, 3-CQA and 4-CQA, was carried out using the standard area of 5-CQA, combined with coefficients of molar extinction, in accordance with adapted methodology of Farah et al. (2005). The final contents of caffeine, trigonelline, 3-CQA, 4-CQA, and 5-CQA were given in g kg-1 (dry basis - db).
Extraction and analyses of sucrose
One hundred milligrams of each ground and degreased sample were suspended in 1.0 mL of ultrapure water. The tubes that contained the samples were placed in an ultrasonic bath. An aliquot of 500 μl of the extract was transferred to another tube and centrifuged at 5.500 rpm. The supernatant was directly injected and a stock solution containing 60.0 mg of sucrose (Sigma ≥ 99%) was prepared in 5 mL of water for the calibration curve. Diluted standard solutions (10% to 100% of stock solution) were used for establishing the calibration curve.
The liquid chromatography used consisted of a ProStar pump (Varian), a RID-410 refraction index detector (Waters) and a Rheodyne injection valve. The samples and standard solutions were analyzed using Dextropak 100 mm × 8 mm columns (Waters) inserted into a RCM-100 compression radial system (Waters) with a line filter (0.22 um) and a C18 pre-column (50 × 4.6 mm) in series. The mobilephase used water filtered through a Milli-Q system at room temperature with a flow of 1.0 mL min-1.
The association between the sucrose peak area in the sample and the respective known concentration standard defined the result (Kuo, et al., 1988). The final sucrose content was given in g kg-1 (db).
Sensorial analysis
One hundred grams of each sample were roasted and roasting was done within 24 h prior to the coffee sensory analysis, or “cupping.” The roast point was determined visually, using a color classification system that employs standardized color discs (Lingle, 2011). After roasting, samples were selected one more time and beans with an off coloration that differed from the sample standard coloration were eliminated. This process allowed for the isolation of possible interferences from the roasting process and other interferences not related to the interactions of the factors investigated.
The sensorial analysis was carried out by four trained and qualified cuppers, certified as judges of specialty coffees, using the proposed methodology by the SCAA (Lingle, 2011).
Statistical analyses
Statistical analyses were carried out using the R software, version 3.1.0 (R Core Team, 2014), considering the average values of the three harvests. After the verification of the assumptions of normality and of the homoscedasticity, the results of the contents of trigonelline, caffeine, sucrose, chlorogenic acids, and of the final scores (grade) were subjected to analysis of variance (ANOVA). The Tukey test was applied at 5% significance in order to verify significant differences detected in Test F. However, the results obtained from univariate analyses limit the comprehension of highly complex phenomena. Therefore, the present study chose to investigate the combined interactions from multivariate analysis, using multidimensional scaling (MDS) associated with the Biplots technique as a statistical tool. The investigation of the effect of the interaction among genotype, environment, and processing in the chemical composition of the raw bean and in the sensorial quality of the coffee beverage was carried out using multidimensional scaling (MDS) associated with the Biplots technique. The objective of this type of statistical analyses is to allow a more accessible visual inspection and a less limited exploration of the data. In addition, it allows for the rearranging of the variable distribution in order to detect the smallest significant dimensions to explain their similarities or dissimilarities (Torgerson, 1952).
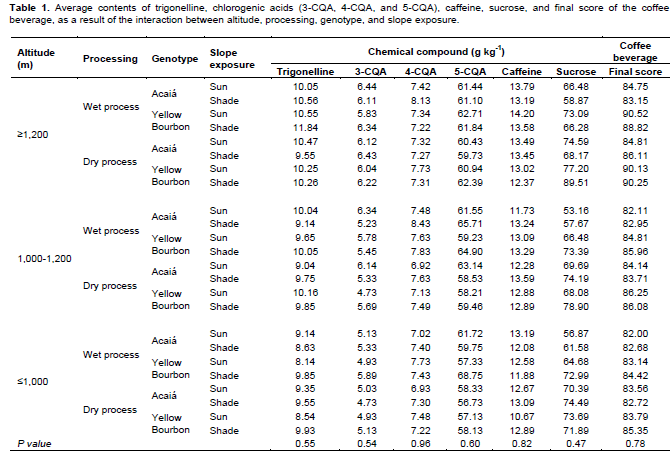
The average contents in g kg-1 (db) of trigonelline, chlorogenic acids (3-CQA, 4-CQA, and 5-CQA), caffeine, sucrose, and the final score of the coffee beverage in relation to the interaction of altitude, processing, genotype, and slope exposure are shown in Table 1.
Average scores found for trigonelline varied from 8.14 to 11.84; from 4.73 to 6.44 for 3-CQA; from 6.92 to 8.43 for 4-CQA; from 56.73 to 68.75 for 5-CQA; from 10.67 to 14.20 for caffeine, and from 53.16 to 89.51 for sucrose, and all were in accordance with scores described in the literature (Duarte et al., 2010; Knopp et al., 2006; Ky et al., 2001; Monteiro and Farah, 2012). Nevertheless, it was verified that significance (P<0.05) of fourth-order interaction was not found.
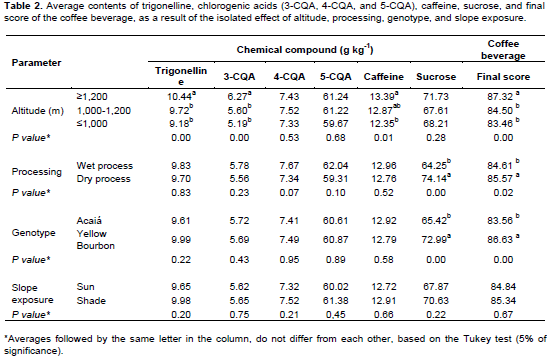
Significant differences were found in the average contents of trigonelline, 3-CQA, and caffeine as a function of altitude as well as in the average levels of sucrose and total beverage score as a function of the isolated effect of processing and genotype. It is important to emphasize that significant differences for the isolated effect of slope exposure type for all variables analyzed were not found (Table 2).
The highest average contents of trigonelline (10.44 g kg-1 - db) were found in altitudes higher than 1,200 m. Regarding the chlorogenic acids investigated in the present, 3-CQA was the only isomer that presented a significant difference and its highest average content was found in coffees produced above 1,200 m (6.27 g kg-1 - db). However, in regards to caffeine, only the average contents of samples collected above 1,200 m (13.39 g kg-1 - db) and below 1,000 m (12.35 g kg-1 - db) differed significantly from each other (Table 2).
Environmental factors such as lower temperatures recurring in higher altitudes, associated with physiological events such as longer periods of beans filling, are reported in the literature and provide evidence to explain the differences found in the chemical variables (Fagan et al., 2011; Geromel et al., 2008; Vaast et al., 2006). The temperature effect is especially observed between the stages of coffee fruit endosperm development and maturation, and the extending of these stages, caused by lower temperatures, is directly related to a higher relative accumulation of dry material in coffee beans (Laviola et al., 2007). Nevertheless, even though variations in the coffee quality have already been described as a function of genotype and altitude (Avelino et al., 2005; Decazy et al., 2003), further studies on the correlation of these factors and the combined effect of chemical variables are needed. The highest average levels of sucrose content (74.14 g kg-1 – db) were found in coffees processed using the dry method, independent of genotype, altitude or slope exposure (Table 2).
Among the technological factors involved in the process of coffee production, the processing method alters significantly the sugar content of the raw beans (Duarte et al., 2010; Knopp et al., 2006).
During post-harvest processing, several metabolic processes occur in the interior of coffee beans, altering significantly the chemical composition of the raw bean (Bytof et al., 2005; Selmar et al., 2006). Therefore, the difference found in the present study reinforces these reports, and possibly demonstrates the isolated effect of coffee processing in altering significantly the sucrose content. Coffee quality also presented a significant difference as a function of coffee processing (Table 2). The highest average values of the final score of the coffee beverage were found in coffee processed using the dry method (85.57).
There are reports in the literature that describe coffees produced by the dry process as having a quality comparably inferior to those produced by the wet process (Silva et al., 2004; Vincent 1985; Wilbaux 1963).
fermentations and lower quality (Borém et al., 2014).
The present study evaluated the coffee quality from positive sensorial attributes, in the absence of any type of defect in the beverage. Under these conditions, results found in the present study contradict what is traditionally described in the literature, since the total average score of dry process coffees was higher than wet process coffees.
Regarding the factor of genotype, the highest average sucrose contents were found in Yellow Bourbon (72.99 g kg-1 - db). The main reports found in the literature that describe the isolated effect of genotype on the chemical composition of coffee are principally in regards to different species of the Coffea genus (Campa et al., 2004; Ky et al., 2001). Differences in the sucrose content among distinct varieties of Arabica coffee may be associated with differences in gene expression in both the syntheses and degradation of the compound. Molecular analyses are necessary for a better understanding of the variations in the sucrose content found for the genotype in the present study.
The results obtained from univariate analysis limit the comprehension of highly complex phenomena. For instance, the combined interactions involving environ-mental factors and different cultivars and forms of processing impact the chemical composition of the raw bean which in turn impacts the expression of the sensorial quality of the resulting coffee beverage. Therefore, the present study chose to investigate the combined interactions from multivariate analysis, using MDS associated with the Biplots technique as a statistical tool.
The determination of the variables that represented the larger contributions for the grouping of samples were not characterized by the weight analysis of the principal components. It was performed basing on the axes of predictive values, for each respective variable. Therefore, we used a minimum square regression for each variable to be calibrated (Graffelman and Eeuwijk, 2005) and mean centered for other variables. The compounds that characterize the axes were obtained as a function of the dissimilarity matrix and the covariance matrix. Therefore, it is feasible to obtain the ellipsis that characterizes the confidence regions. This way, the present ellipses do not represent a confidence region but simply an illustration to facilitate the visualization of the group of samples identified in the figures.
The chemical composition, when analyzed jointly, largely contributed to the formation of groupings as a function of the coffee beverage final score, altitude, genotype, and the post-harvest processing (Figures 2 and 4). The Biplot that was established represented each object (genotype, altitude, slope exposure, and processing) as a dot and each dependent variable (chemical and sensorial) as a vector with representative scales of the average values (Figure 2).
Biplot with MDS of genotypes, altitude categories, slope groups, and processing types for the following variables trigonelline, 3-CQA, 4-CQA, 5-CQA, caffeine, sucrose, and of the coffee beverage final score are shown in Figure 2. Three distinct group formation were observed as follows: Group I (GI) constituted of the Yellow Bourbon genotype cultivated in altitudes higher than 1,200 m; Group III (GIII) consisted of the Acaiá genotype processed using the wet method, and Group II (GII) constituted of objects that represent the interaction of all independent variables investigated, except when the interaction is the combination of Yellow Bourbon above 1,200 m and wet processed Acaiá. This last group represents a confounding zone, since objects occur near the origin with scores around 85 points, objects to the right of the origin and to the left with differing sensorial quality scores.
The variable score, in combination with the mean of the other dependent variables, contributed to this distinction. Analyzing the chemical variables adjustment, it was observed that the higher contents of sucrose and trigonelline largely contributed to the formation of GI. On the other hand, the lowest contents of trigonelline and sucrose and the highest contents of 4-CQA were the main contributors to the formation of GIII. The remaining variables 3-CQA, 5-CQA, and caffeine presented high similarity to each other and contributed little to the formation of GI and GIII.
The Yellow Bourbon genotype cultivated above 1,200 m of altitude, independent of the slope exposure or type of processing applied (GI), presented tendencies towards higher contents of sucrose and trigonelline and the highest potential for the expression of coffee beverage sensorial quality, with a final score of approximately 90 points (Figure 2).
It can also be seen in Figure 2 that the wet processed Acaiá genotype (GIII), except when cultivated above 1,200 m of altitude on a sun-facing slope, presented tendencies of lower contents of sucrose and trigonelline, higher 4-CQA and a beverage sensorial quality with scores below 85 points.
The combined effect of variables characterized by chemical compounds and coffee beverage sensorial quality were found for both interactions, genotype x altitude (GI) and genotype x processing (GIII). Based on this understanding, MDS was applied for wet and dry processes with the purpose of analyzing the interactions between environmental and genetic factors in the chemical composition and sensorial quality, taking into account characteristics of coffees obtained from different processes. Therefore, established Biplots presented objects characterized by the combination of genotype, altitude, and slope exposure, in addition to vectors with representative scales of average values found for chemical and sensorial variables (Figures 3 and 4).
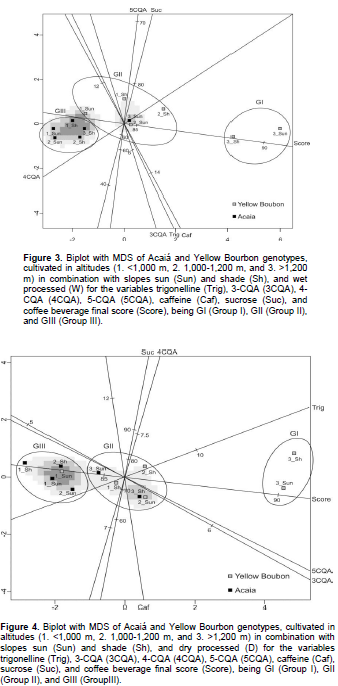
Figure 3 represents Biplot with MDS of genotypes, altitude categories, slope groups, and wet processing for the variables trigonelline, 3-CQA, 4-CQA, 5-CQA, caffeine, sucrose, and coffee beverage final score.
The highest scores, highest contents of caffeine, trigonelline, and 3-CQA and the lowest of 4-CQA largely contributed for the formation of GI. On the other hand, the lowest scores along with the lowest contents of sucrose and highest of 4-CQA were also relevant for the formation of GIII. The variable 5-CQA contributed little for the grouping formation.
Yellow Bourbon genotype cultivated above 1,200 m and wet processed (GI) presented a tendency of higher contents of caffeine, trigonelline, and 3-CQA, and lower for 4-CQA. In addition, this genotype exhibited average final score of 90 points, demonstrating a high potential for the expression of beverage sensorial quality.
For wet processing, the genotype Acaiá, except when cultivated above 1,200 m altitude on a sunny slope facing (GIII), present a tendency towards higher levels of 4-CQA, lower levels of sucrose, and a beverage sensorial quality with scores to the left of origin, and therefore below the mean.
The genotype Yellow Bourbon cultivated below 1,200 m altitude, independent of slope exposure, presented a sensorial beverage quality similar to that of Acaiá cultivated above 1,200 m altitude on a sunny slope exposure (GII), when submitted to processing via the wet process (Figure 3).
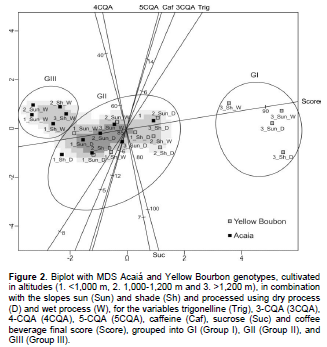
The Biplot with MDS of the genotypes, altitude classes, slope groups, and processing via the dry process for the variable trigonelline, 3-CQA, 4-CQA, 5-CQA, caffeine, sucrose, and total sensorial beverage score, can be found in Figure 4.
The highest levels of trigonelline, 5-CQA and 3-CQA, together with the highest scores, were principally responsible for the formation of GI. On the other hand, the lower levels of these same compounds and lower scores contributed in an expressive way to the formation of GIII, creating two contrasting groups. The remaining variable 4-CQA, caffeine, and sucrose, presented high similarity between themselves with little contribution to the formation of groups.
The genotype Yellow Bourbon cultivated above 1,200 m and processed using the dry method (GI) presented a tendency towards higher levels of trigonelline, 5-CQA, 3-CQA, and a notable expression of the quality of the coffee beverage, with a final score of around 90 points (Figure 4).
For dry processing, the genotype Yellow Bourbon cultivated below 1,200 m presented a sensorial beverage quality similar that that of Acaiá cultivated above 1,200 on both sun and shade slopes exposure (GII).
Dry processed coffee of the genotype Acaiá cultivated below 1,200 m, as well as coffee of the Yellow Bourbon genotype processed below 1,000 m, with a sun slope facing (GIII), had a tendency towards lower levels oftrigonelline, 5-CQA, 3-CQA, and sensorial beverage quality with notes below 85 (Figure 4).
It should be noted that the relation between the chemical composition of the raw bean and the sensorial quality of the coffee beverage arising from the interaction genotype x environment was distinct in regards to processing type. The grouping formed by dry process coffees presented the combined effect of the compounds trigonelline, 5-CQA and 3-CQA with the total beverage score. On the other hand, pulped and demucilaged coffees presented distinct groups in function of the combined effect of all of the compounds analyzed with a total beverage score, with the exception of the chlorogenic acid isomer 5-CQA.Their differences reinforce the hypothesis that the metabolism of the bean remains active after the harvesting of the fruits and that the extension of these metabolic processes depends on the type of processing applied (Knopp et al., 2006). Another possible cause is the stimulus promoted in the germination metabolism by the wet process in function of the pulping of the fruit (Bytof et al., 2007).
No interaction of the factors: Coffee cultivar, altitude, slope exposure and processing type were observed by performing univariate analyses. In addition, it is clear that slope exposure does not affect the chemical composition of raw coffee beans and the sensory quality of arabica coffee Yellow Bourbon cv. and Acaiá cv., neither by itself nor interacting with other factors.
Considering all chemical and sensorial variables together, specific trends for each cultivar, altitude range and processing type, were clearly observed by using MDS. Of which was possible to take the following specific conclusions:
a. The genotype Yellow Bourbon cultivated above 1,200 m altitude and processed using the wet processing method present in the raw coffee bean a tendency towards higher levels of caffeine, trigonelline and 3-CQA, lower levels of 4-CQA, and a sensorial beverage quality with a mean score of around 90 points.
b. The genotype Acaiá processed using the wet processing method, except when cultivated above 1,200 m on a sun-facing slope, present in the raw coffee beans a tendency towards higher levels of 4-CQA, lower levels of sucrose, and a sensorial beverage quality with scores below 85 points.
c. The genotype Yellow Bourbon cultivated above 1,200 m altitude and processed using the dry processing method, present in the raw coffee bean a tendency towards higher levels of trigonelline, 5-CQA, 3-CQA and a sensorial beverage quality with an average score around 90 points.
d. Dry process coffee of the genotype Acaiá cultivated below 1,200 m altitude, as well as Yellow Bourbon cultivated below 1,000 m with a sun-facing slope, present in the raw coffee beans a tendency towards lower levels of trigonelline, 5-CQA, 3-CQA, and a sensorial beverage quality with scores below 85 points.
The authors have not declared any conflict of interests.
REFERENCES
|
Avelino J, Barboza B, Araya JC, Fonseca C, Davrieux F, Guyot B, Cilas C (2005). Effects of slope exposure, altitude and yield on coffee quality in two altitudeterroirs of Costa Rica, Orosi and Santa María de Dota. J. Sci. Food Agric. 85:1869-1876.
Crossref
|
|
|
|
Barbosa JN, Borem FM, Cirillo MA, Malta MR, Alvarenga AA, Alves HMR (2012). Coffee Quality and Its Interactions with Environmental Factors in Minas Gerais, Braz. J. Agric. Sci. 4:181-190.
|
|
|
|
|
Bertrand B, Boulanger R, Dussert S, Ribeyre F, Berthiot L, Descroix F, Joët T (2012). Climatic factors directly impact the volatile organic compound fingerprint in green Arabica coffee bean as well as coffee beverage quality. Food Chem. 135:2575-2583.
Crossref
|
|
|
|
|
Bertrand B, Vaast P, Alpizar E, Etienne H, Davrieux F, Charmetant P (2006). Comparison of bean biochemical composition and beverage quality of Arabica hybrids involving Sudanese-Ethiopian origins with traditional varieties at various elevations in Central America. Tree Physiol. 26:1239-1248.
Crossref
|
|
|
|
|
Borém FM, Isquierdo EP, Taveira JHS (2014). Coffee Processing. In Handbook of Coffee Post-Harvest Technology (F. Borémed., Gin Press, Norcross, Georgia.), pp. 49-68.
|
|
|
|
|
Borém FM, Ribeiro FC, Figueiredo LP, Giomo GS, Fortunato VA, Isquierdo EP (2013). Evaluation of the sensory and color quality of coffee beans stored in hermetic packaging. J. Stored Prod. Res. 52:1-6.
Crossref
|
|
|
|
|
Bytof G, Knopp S-E, Kramer D, Breitenstein B, Bergervoet JHW, Groot SPC, Selmar D (2007). Transient occurrence of seed germination processes during coffee post-harvest treatment. Ann. Bot. 100:61-6.
Crossref
|
|
|
|
|
Bytof G, Knopp S-E, Schieberle P, Teutsch I, Selmar D (2005). Influence of processing on the generation of ?-aminobutyric acid in green coffee beans. Eur. Food Res. Technol. 220:245-250.
Crossref
|
|
|
|
|
Campa C, Ballester J., Doulbeau S, Dussert S, Hamon S, Noirot M (2004). Trigonelline and sucrose diversity in wild Coffea species. Food Chem. 88:39-43.
Crossref
|
|
|
|
|
Casal SIP (2004). Compostos nitrogenados do café. Universidade do Porto.
|
|
|
|
|
Decazy F, Avelino J, Guyot B, Perriot JJ, Pineda C, Cilas C (2003). Quality of Different Honduran Coffees in Relation to Several Environments. J. Food Sci. 68:2356-2361.
Crossref
|
|
|
|
|
Duarte GS, Pereira AA, Farah A (2010). Chlorogenic acids and other relevant compounds in Brazilian coffees processed by semi-dry and wet post-harvesting methods. Food Chem. 118:851-855.
Crossref
|
|
|
|
|
Fagan EB, Henrique C, Souza E De (2011). Efeito do tempo de formação do grão de café (Coffea sp) na qualidade da bebida. Biosc. J. 27:729-738.
|
|
|
|
|
Farah A, De Paulis T, Trugo LC, Martin PR (2005). Effect of roasting on the formation of chlorogenic acid lactones in coffee. J. Agric. Food Chem. 53:1505-1513.
Crossref
|
|
|
|
|
Farah A, Donangelo CM (2006). Phenolic compounds in coffee. Brazilian J. Plant Physiol. 18:23-36.
Crossref
|
|
|
|
|
Figueiredo LP, Borém FM, Cirillo MÂ, Ribeiro FC, Giomo GS, Salva TDJG (2013). The Potential for High Quality Bourbon Coffees From Different Environments. J. Agric. Sci. 5:87-98.
Crossref
|
|
|
|
|
Franca AS, Oliveira LS, Mendonça JCF, Silva XA (2005). Physical and chemical attributes of defective crude and roasted coffee beans. Food Chem. 90:89-94.
Crossref
|
|
|
|
|
Geromel C, Ferreira LP, Davrieux F, Guyot B, Ribeyre F, Brígida dos Santos Scholz M, Protasio Pereira LF, Vaast P, Pot D, Leroy T, Androcioli Filho A, Esteves Vieira LG, Mazzafera P, Marraccini P (2008). Effects of shade on the development and sugar metabolism of coffee (Coffea arabica L.) fruits. Plant Physiol. Biochem. 46:569-79.
Crossref
|
|
|
|
|
Graffelman J, Eeuwijk F Van (2005). Calibration of Multivariate Scatter plots for Exploratory Analysis of Relations Within and Between Sets of Variables in Genomic Research. Biomet. J. 47:863-879.
Crossref
|
|
|
|
|
Guyot B, Gueule D, Manez JC, Perriot JJ, Giron J, Villain L (1996). Influence de l'altitude et de lómbrage sur la qualité des cafés Arabica. Plant Rech. Dév. 1:272-283.
|
|
|
|
|
ISO 6673 (2003). Green coffee: Determination of loss in mass at 105 °C. Int. Stand. ISO 66732003(E) 4.
|
|
|
|
|
Joët T, Salmona J, Laffargue A, Descroix F, Dussert S (2010). Use of the growing environment as a source of variation to identify the quantitative trait transcripts and modules of co-expressed genes that determine chlorogenic acid accumulation. Plant. Cell Environ. 33:1220-1233.
Crossref
|
|
|
|
|
Knopp S, Bytof G, Selmar D (2006). Influence of processing on the content of sugars in green Arabica coffee beans. Eur. Food Res. Technol. 223:195–201.
Crossref
|
|
|
|
|
Kuo TM, VanMiddlesworth JF, Wolf WJ (1988). Content of raffinose oligosaccharides and sucrose in various plant seeds. J. Agric. Food Chem. 36:32-36.
Crossref
|
|
|
|
|
Ky CL, Louarn J, Dussert S, Guyot B, Hamon S, Noirot M (2001). Caffeine, trigonelline, chlorogenic acids and sucrose diversity in wild Coffea arabica L. and C. canephora P. accessions. Food Chem. 75:223-230.
Crossref
|
|
|
|
|
Laviola BG, Martinez HEP, Salomão LCC, Cruz CD, Mendonça SM (2007). Acúmulo de nutrientes em frutos de cafeeiro em quatro altitudes de cultivo: cálcio, magnésio e enxofre. Rev. Bras. Ciênc. Solo 31:1451-1462.
Crossref
|
|
|
|
|
Leroy T, Ribeyre F, Bertrand B, Charmetant P, Dufour M, Montagnon C, MarracciniI P, Pot D (2006). Genetics of coffee quality. Brazilian J. Plant Physiol. 18:229-242.
Crossref
|
|
|
|
|
Lingle RT (2011). The coffee cupper’s handbook: systematic guide to the sensory evaluation of coffee’s flavor. 4th ed. S.C.A.A. SCAAed. Long Beach.
|
|
|
|
|
Malta MR, Nogueira FD, Guimarães PTG (2003). Composição química, produção e qualidade do café fertilizado com diferentes fontes e doses de nitrogênio. Ciênc. Agrotecnol. 27:1246-1252.
|
|
|
|
|
Monteiro MC, Farah A (2012). Chlorogenic acids in Brazilian Coffea arabica cultivars from various consecutive crops. Food Chem. 134:611-614.
Crossref
|
|
|
|
|
R Core Team (2014). A language and environment for statistical computing.
|
|
|
|
|
Selmar D, Bytof G, Knopp SE, Breitenstein B (2006). Germination of coffee seeds and its significance for coffee quality. Plant Biol. (Stuttg). 8:260-264.
Crossref
|
|
|
|
|
Silva EA, Mazzafera P, Brunini O, Sakai E, Arruda FB, Mattoso LHC, Carvalho CRL, Pires RCM (2005). The influence of water management and environmental conditions on the chemical composition and beverage quality of coffee beans. Brazilian J. Plant Physiol. 17:229-238.
Crossref
|
|
|
|
|
Silva RF da, Pereira RGFA, Borém FM, Muniz JA (2004). Qualidade do café-cereja descascado produzido na região sul de Minas Gerais. Ciênc. Agrotecnol. 28(6):1367-1375.
Crossref
|
|
|
|
|
Sunarharum WB, Williams DJ, Smyth HE (2014). Complexity of coffee flavor: A compositional and sensory perspective. Food Res. Int. 62:315-325.
Crossref
|
|
|
|
|
Taveira SJH, Borém FM, Figueiredo LP, Reis N, Franca AS, Harding SA, Tsai CJ (2014). Potential markers of coffee genotypes grown in different Brazilian regions: a metabolomics approach. Food Res. Int. 61:75-82.
Crossref
|
|
|
|
|
Torgerson WS (1952). Multidimensional scaling: I. Theory and method. Psychometrica 17:401-419.
Crossref
|
|
|
|
|
Trugo LC, Farah A, Cabral L (1995). Oligosaccharide distribution in Brazilian soya bean cultivars. Food Chem. 52:385-387.
Crossref
|
|
|
|
|
Vaast P, Bertrand B, Perriot JJ, Guyot B, Génard M (2006). Fruit thinning and shade improve bean characteristics and beverage quality of coffee (Coffea arabica L.) under optimal conditions. J. Sci. Food Agric. 86:197-204.
Crossref
|
|
|
|
|
Vincent JC (1985). Green coffee processing. In Coffee: chemistry, Elsevier, London, New York. pp. 1-33.
|
|
|
|
|
Wilbaux R (1963). Agricultural Engineering. F.O. line Cataloguesed. FAO, Rome - Italy.
|
|