Full Length Research Paper

ABSTRACT
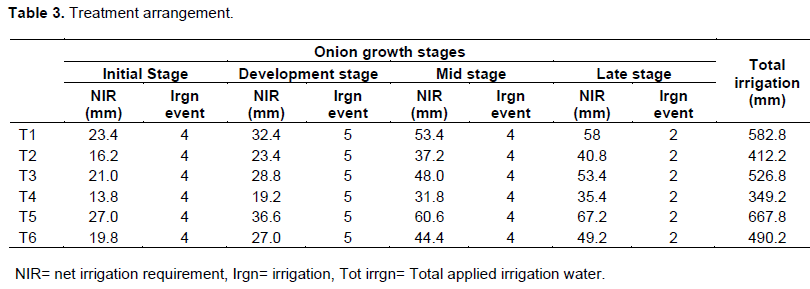
The field experiment were performed on the site of Werer Agricultural Research Center (Ethiopia) to study optimal irrigation scenario by taking in to account the leaching requirement and drainable excess water for three successive years. Six irrigation treatments were evaluated at different growth stages of onion plant namely at initial growth stage four irrigation event 23 mm (T1), 16.2 mm (T2) 21.0 mm (T3), 13.8 mm (T4), 27.0 mm (T5), 19.8 mm (T6), at development growth stage five irrigation event 32.4 mm (T1), 23.4 mm (T2), 28.8 mm (T3), 19.2 mm (T4), 36.6 mm (T5), 27.0 mm (T6), at mid growth stage four irrigation event 53.4 mm (T1), 37.2 mm (T2), 48.0 mm (T3), 31.8 mm (T4), 60.6 mm (T5), 44.4 mm (T6), and at late stage two irrigation event 58.0 mm (T1), 40.8 mm (T2), 53.4 mm (T3), 35.4 mm (T4), 67.2 mm (T5), 49.2 mm (T6) applied respectively. The irrigation amount and amount of water added for leaching had no significant difference on onion bulb diameter and bulb length across the years. The highest marketable yield (21784 kg/ha) and water use efficiency (1.89 kg/m3) were recorded at the first year. The maximum bulb diameter were recorded from T6 (5.41 cm) and the lowest recorded from T2 (4.81 cm). Treatment T2 were recommended for the production of onion at middle awash. The developed optimal irrigation scheduling and drainable excess water can be used as a guide to yield potential allocation decision related to soil salinity management.
Key words: Drainage, optimal, leaching, onion.
INTRODUCTION
The accumulation of excess soluble salts in the root zone of arid and semi-arid irrigated soils is a widespread problem that seriously affects crop productivity throughout the world. The predominant mechanism causing the accumulation of salt in irrigated agricultural soils is evapotranspiration, which concentrates salts in the remaining soil water (Rhoades and Loveday, 1990). Onion is an important crop especially in developing countries. Determining the best production models in marginal soil and water conditions is important in terms of yield and quality. In addition, it is also important in terms of sustainable soil and water management. In Ethiopia onion is cultivated for local consumption and export (Kifle et al., 2008; Nigussie et al., 2015; Etana et al., 2019). The economy of Ethiopia largely depends on the agricultural sector, whose transformation is possible only through fundamentally transforming sector (Block, 1999; Mellor and Dorosh, 2010; Abera et al., 2020). The ever increasing world population and the demand for additional water supply by industrial, municipal, and agricultural sectors exert a lot of pressure on renewable water resources forcing the agricultural sector to use the available irrigation water efficiently to produce more food to meet the increasing demand (Andarzian et al., 2011).
A growing world population and rising living standards are increasing the demand for agricultural products. At the same time, globalization, markets liberalization, growing pressure on natural resources, and environmental concerns are heightening the need for improved agricultural productivity (Calicioglu et al., 2019). Right management of irrigation is of vital importance to preserve water resources, quantitatively and qualitatively, and to produce more food with the available water. Irrigation scheduling is one of the most important tool for developing best management practices for irrigated areas (Al-Jamal et al., 1999). Onions need frequent irrigation to maintain high soil moisture (Shock et al., 1998). Irrigation scheduling is directly related to profitable onion production and sustainable agricultural practices. Optimal irrigation scheduling leads to maximum yields and good bulb quality.
Over-irrigation leads to soil erosion, bulb disease susceptibility, water loss, extra energy costs for pumping. Onions are extremely sensitive to water stress. Regardless of the type of irrigation system used, both yield and quality can suffer if irrigation is delayed and available soil moisture is allowed to drop too low (Shock et al., 2010). Errors in irrigation scheduling can also have negative environmental consequences. This is particularly the case in semi-arid areas subject to frequent droughts, high evapotranspiration rate and with limited water resources. The effects of irrigation scheduling on yield, water root uptake, and shoot density have been investigated for various crops (Camposeo and Rubino, 2003; Hanson et al., 2003; Jordan et al., 2003). Onion is an important crop especially in developing countries.
Determining the best production models in marginal soil and water conditions is important in terms of yield and quality. In addition, it is also important in terms of sustainable soil and water management. Therefore, innovations are needed to increase the efficiency of use of the water that is available. One approach is the development of new irrigation scheduling techniques such as deficit irrigation within drip system, which are not necessarily based on full crop water requirement. Deficit (or regulated deficit) irrigation is one way of maximizing water use efficiency (WUE) for higher yields per unit of irrigation water applied. Effect of irrigation scheduling by taking into account leaching requirement and drainable excess irrigation water have not been explored in the study area middle awash (Ethiopia) but several studies have been conducted on water requirement of onion at the study area (Haile et al., 2020; Candiah, 1981; Bekele et al., 2016; Mekonnen et al., 2017; Kebede, 2019).
MATERIALS AND METHODS
Description of the study area
The experiment was conducted by Research Station of Werer Agricultural Research Center in Afar Region from 2017 to 2019. It is located at 9° 16 ’8” latitude; 40° 9’ 41”E longitudes and 740 m above mean sea level. The area is classified as semi-arid with average annual rainfall of 590 mm. Bestowing to meteorological data recorded at Agro meteorological observatory of experimental site the average minimum and maximum temperature is 19 and 40.8°C respectively. The topography of the middle awash valley reflects the history of the middle awash valley, through which deposits from the Awash River have constructed an extensive alluvial plain. Gradients are generally very low, predominantly lying in the range of 1-2% (Awulachew et al., 2007).
Crop water demand determination
The seasonal onion water demand in the study area was computed by using the FAO CROPWAT for windows software version 8 and also the soil water budget calculation procedure. Onion grown during the dry and relatively cooler months of November to January.
Cropwat procedure
Average monthly climatic data (maximum and minimum temperatures, wind speed, relative humidity, and sunshine hour) were used to compute monthly reference evapotranspiration values on daily basis for every month and each year of record by using the FAO- CropWat software which applies the modified FAO Penman Monteith formula. Then the long-term monthly reference evapotranspiration daily rates data series generated of each month as discussed above were fitted to different probability distributions by using Easy fit software from which a most fitting distribution is identified and used to estimate the reference evapotranspiration value that corresponds to the 80% probability of exceedance for each months of the year.
Monthly rainfall values were determined as the average values from the 30-year monthly rainfall data record for each months of the year. Effective rainfall is then calculated with the help FAO-Cropwat software which applies the dependable rain (FAO/AGLW) formula. Further required inputs for the Cropwat software such as soil types, planting dates, and length of growing period of the study crops were adjusted to the local conditions; while other required inputs such as allowable soil moisture depletion levels and crop coefficient values were set to be at the default values provided in the software.
Soil water budget procedure
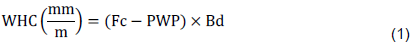
For this computation procedure, data requirements that are related to crop growth behaviors, such as planting dates, length of growing period and depth of rooting for each growth stages of the crops were set to represent the locally growing circumstances of each study crop. In calculating key moisture content parameters such as water holding capacity (WHC), root zone available water content (AWRz), and allowable soil moisture depletion (ASMD), that explain the soil water-plant interactions, the following relationships, assumptions, and equations have been employed (Allen et al., 1998).
 \
\
Where FC: water content at field capacity, PWP: water content at permanent wilting point, Bd: bulk density, WHC: water holding capacity
Soil of the study area
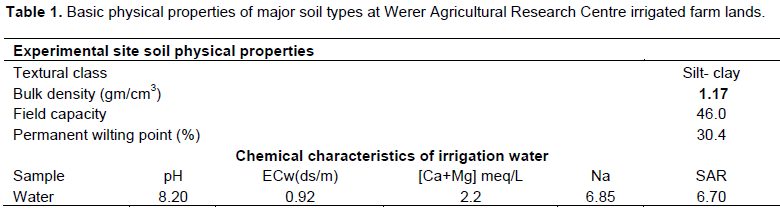
Laboratory analysis result the dominant soil types of study area are dark vertisol type with silty-clay to clay textures. Generally, the wide-spread occurrence of salinity and sodicity problem in the experimental site is mainly due to weathering of Na, Ca, Mg and K rich igneous rocks and poor irrigation water management. Recent study indicated that the salt affected soils were generally clayey to silt clay loam, slightly alkaline to strongly alkaline (7.53 to 8.45) and low in organic matter with high soluble salt (Table 1).
Infiltration characteristics of study area
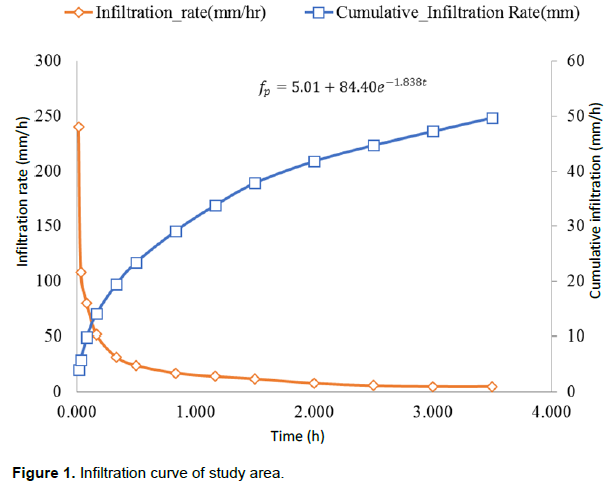
The infiltration rate which is the speed at which water enters into the soil is measured by the depth (mm) of the water layer that can enter the soil in one hour. The basic infiltration rate in this experiment site was found to be 5.2 mm/h. Which was in the upper range of clayey soil (1-5 mm/h?) (Hillel, 2004). This means that a water layer of 5.1 mm on the soil surface will take one hour to infiltrate (Figure 1).
Bulk density
The bulk density undisturbed soil sample of known volume was taken from representative places in the trial plot at three different depths (0-30 cm, 30-60 cm, and 60-90 cm). The sampled soil was oven dried at 105°C for 24 h to a constant weight and weighed to determine the dry weight fraction. Then the bulk density was calculated as the ratio of dry weight of the soil to known cylindrical core sampler volume (Hillel, 2000).
where, rb: Bulk density (g/cm3), Mc: Dry weight of soil (g), Vt: Volume of core cutter (cm3).
Total available water (mm)
The experimental field was determined by using the following equation (Allen, 2000).

where, TAW: Total available water (mm), FC: Field Capacity (%), PWP: Permanent wilting point (%), rd: Bulk density (g/cm3), D: Effective root depth of crop(m), rw: Water density (g/cm3),
Moisture content (cm/cm)
This is obtained by the following formula (Batjes, 2012).

where, MC (%): Moisture content (g), Wws: Weight of wet soil (g), Wds: Weight of dry soil (g).
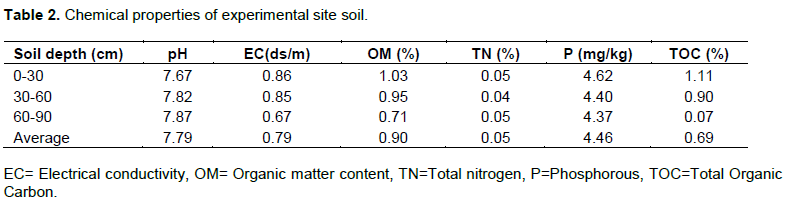
Chemical properties of soil
The sodium absorption ratio is estimated in order to determine the sodicity or alkalinity hazard of irrigation waters. According to Richards (1954) sodium adsorption ratio classification of < 10 is safe. The SAR value of irrigation water of the study area was safe (Table 2).
Climate condition of the study area
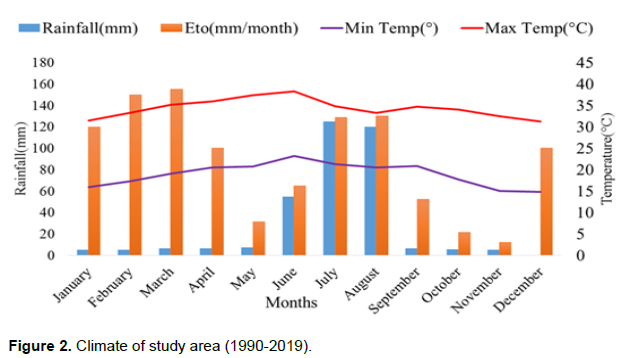
The experimental site meteorological station data shows that, the average annual rainfall is 590 mm. More than 85% of the rain occurs from June to September, with July and August being the wettest months. The average minimum and maximum temperature is 19 and 40.8°C respectively. Mean relative humidity is lowest in June at 36% and the maximum in August which is 58%. Annual evapotranspiration rate of experimental site is 2829 mm. According to long term climatic data (1990 - 2019), the relative humidity ranges between 37 and 52.5%. The mean monthly rainfall distribution indicates that, July and August are the main rainy season followed by March and April (short rainy season) (Figure 2).
Treatment arrangement
The treatment arrangement (Table 3) include optimal irrigation application efficiency and leaching requirement at different rates. The study was carried out in two phases. The first phase of the study was a preliminary investigation to generate a base line data for field experimental treatments of irrigation. The drainable excess water was estimated for onion 320.9 mm at 60% application efficiency. The groundwater observation at Werer Agricultural research center indicate that the water table is getting shallower. Currently, the ground water table in the farm area of the research center is found in the ranges of 2-4 m below the ground level. This increasing rise in the ground water level clearly indicates the lack of sufficient drainage system that can safely remove the excess drainable water from the irrigated lands.
Leaching requirement determination
According to Corwin et al. (2007) leaching requirement is an agricultural concept that was originally based on an assumption of steady-state conditions. However, worries to the system (e.g., change in crop, alteration of irrigation management, introduction of varying irrigation water quality, etc.) result in transient circumstances, which reduce the general applicability of the traditional LR model approach, rendering a temporal tracking of the system with transient approaches more suitable. The level and distribution of salinity in cultivated soils are the result of time-dependent interactions of rainfall, irrigation, evapotranspiration, leaching, and drainage. These interactions and relationships involving crop yield, root water extraction, soil salinity, irrigation, salt-loading, leaching, and drainage are complicated and are not fully quantified. Leaching requirement was calculated to see whether the drainage excess is sufficient for leaching or not by employing the following relationships (Maas and Tanjii, 1990). Leaching requirement depends on salt tolerance of the crop and irrigation water salinity (Corwin et al., 2007).
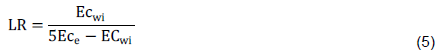
LR: leaching requirement; Ece: electrical conductivity of soil at threshold or dS/m; Ecwi: Electrical requirement of irrigation water (ds/m).
The threshold soil salinity level (ECe) values for 10% yield potential for test crop were taken from FAO 56. Average value of electrical conductivity of Awash River near Werer Research center that was used for this calculation was 0.31 dS/m for the high flow period (around July to August); 0.61 dS/m for the medium flow period (November to December).
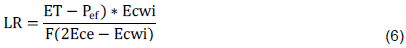
LR: Leaching requirement (mm), Peff: Effective rainfall (mm), F: Leaching fraction, ET: Seasonal evapotranspiration (mm).
The threshold soil salinity level (ECe) values for 100% yield potential for each test crop were taken from FAO 56. Average value of electrical conductivity of Awash River near Werer Research center that was used for this calculation was 0.31 dS/m for the high flow period (around July to August); 0.61 dS/m for the medium flow period (around November to December).
RESULTS AND DISCUSSION
The results of this experiment indicate that the bulb diameter and bulb length had no significant difference throughout the three years. However, there is a significance difference between marketable yield and water use efficiency. Onion requires frequent irrigation because most of the crop water requirement is extracted from the top 30 cm depth very little water depth beyond 60 cm; thus, the upper soil areas must be kept moist to simulate root growth and provide adequate water from the plant (Anisuzzaman et al., 2009).
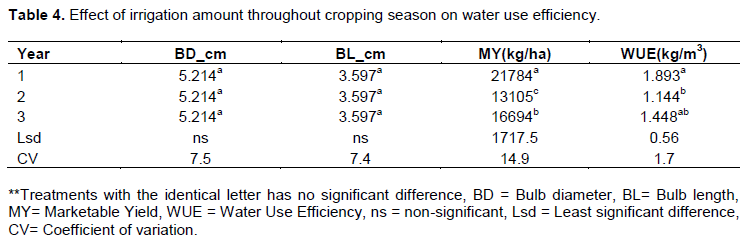
Effect of irrigation amount on water use efficiency and yield parameter
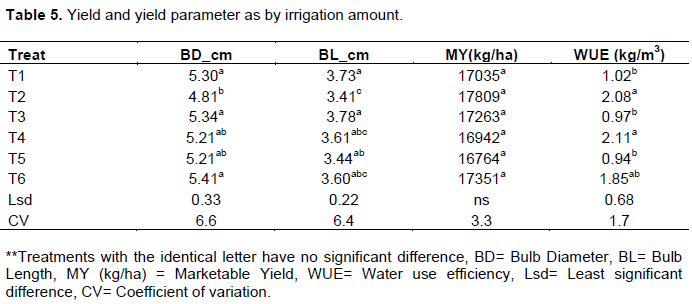
The result (Table 4) of three years experiment indicate that there is no significance difference between irrigation treatments in terms of marketable yield. However, there is significance difference between Treatment (T2 and T3) in terms of bulb diameter. The highest marketable yield (17809 kg/ha) and water use efficiency of (2.08 kg/m3) has been recorded from treatment with four irrigation at initial growth stage each (16.2 mm), five irrigation at development growth stage each (23.4 mm), four irrigation at mid-growth stage each (37.2 mm), two irrigation (40.8 mm) at late growth have been applied. Irrigation water use efficiency was higher at lower levels of irrigation water applied (Kebede, 2003; Kirnak et al., 2005; Sarkar et al., 2008). Ground water contribution to the crop water demand is zero. This finding results had agreed with the results reported by (Al-Jamal et al., 2000; Anisuzzaman et al., 2009) onion yield and bulb were very responsive to careful irrigation scheduling and maintenance of optimum soil moisture and that any soil moisture stressed below field capacity caused yield reduction (Shock et al., 1998, 2010). The lowest bulb diameter (4.81 cm) was recorded from treatment with optimal irrigation application efficiency without leaching requirement (T2) by using 412.2 mm total irrigation water. The water requirements for optimum yield (35,000 ± 45,000 kg/ha) might vary from 350 to 550 mm of water using furrow irrigation (Doorenbos and Kassam, 1979). Variability in irrigation water demands for onions is a function of location and irrigation methods (Table 5).
CONCLUSION
The result of this study suggests that applying four irrigation (16.2 mm) at initial, five irrigation (23.4 mm) at development, four irrigation (37.2 mm) at mid-stage, two irrigation (40.8 mm) at late growth stage and 412.2 mm total irrigation water have been recommended for onion production. Appropriate irrigation and drainage water management strategies, optimal irrigation application efficiencies was used based on generating minimum drainable water incorporating the non-consumptive use that is beneficially used for leaching out salts from the root zone. In this regard, from the efficiencies tested in this study, the 60% application efficiency generated by far the lowest excess drainable water.
CONFLICT OF INTERESTS
The authors have not declared any conflict of interests.
ACKNOWLEDGEMENTS
The authors are grateful to Ethiopian Institute of Agricultural Research, for providing funds for the experiment and technical support. The authors are also indebted to Werer Agricultural research Centre for all staff of irrigation and water harvesting research program.
REFERENCES
|
Abera D, Liben FM, Shimbir T, Balemi T, Erkossa T, Demiss M, Tamene L (2020). Guideline for agronomy and soil fertility data collection in Ethiopia: National standard. Ethiopian Institute of Agricultural Research 31 p. |
|
|
Al-Jamal MS, Sammis TW, Ball S, Smeal D (1999). Yield-based, irrigated onion crop coefficients. Applied Engineering in Agriculture 15(6):659. |
|
|
Al-Jamal M, Sammis T, Ball S, Smeal D (2000). Computing the crop water production function for onion. Agricultural Water Management 46(1):29-41. |
|
|
Allen RG (2000). Using the FAO-56 dual crop coefficient method over an irrigated region as part of an evapotranspiration intercomparison study. Journal of Hydrology 229(1-2):27-41. |
|
|
Allen RG, Pereira L S, Raes D, Smith M (1998). FAO Irrigation and drainage paper No. 56. Rome: Food and Agriculture Organization of the United Nations 56(97):e156. |
|
|
Andarzian B, Bannayan M, Steduto P, Mazraeh H, Barati M, Barati M, Rahnama A (2011). Validation and testing of the AquaCrop model under full and deficit irrigated wheat production in Iran. Agricultural Water Management 100(1):1-8. |
|
|
Anisuzzaman M, Ashrafuzzaman M, Ismail M R, Uddin M, Rahim M (2009). Planting time and mulching effect on onion development and seed production. African Journal of Biotechnology 8(3):412-416. |
|
|
Awulachew SB, Yilma AD, Loulseged M, Loiskandl W, Ayana M, Alamirew T (2007). Water resources and irrigation development in Ethiopia. Colombo, Sri Lanka: International Water Management Institute (IWMI). 66p. (IWMI Working Paper 123) doi: http://dx.doi.org/10.3910/2009.305. |
|
|
Batjes NH (2012). ISRIC-WISE derived soil properties on a 5 by 5 arc-minutes global grid (ver. 1.2). ISRIC-World Soil Information. |
|
|
Bekele M, Feyisa K, Getu S (2016). Challenges and Opportunities of Marketing Fruit and Vegetables at Logia, Northeastern Ethiopia. The Case of Onion, Tomato and Banana. Journal of Marketing and Consumer Research 22:51-58. |
|
|
Block SA (1999). Agriculture and economic growth in Ethiopia: growth multipliers from a four?sector simulation model. Agricultural Economics 20(3):241-252. |
|
|
Calicioglu O, Flammini A, Bracco S, Bellù L, Sims R (2019). The future challenges of food and agriculture: An integrated analysis of trends and solutions. Sustainability 11(1):222. |
|
|
Camposeo S, Rubino P (2003). Effect of irrigation frequency on root water uptake in sugar beet. Plant and Soil 253(2):301-309. |
|
|
Candiah A (1981). Water requirement of some selected crops in the Middle Awash environment. http://hdl.handle.net/123456789/832 |
|
|
Corwin DL, Rhoades JD, Šim?nek J (2007). Leaching requirement for soil salinity control: Steady-state versus transient models. Agricultural Water Management 90(3):165-180. |
|
|
Doorenbos J, Kassam AH (1979). Yield response to water. FAO. Irrigation and drainage paper 33:193-201. |
|
|
Etana MB, Aga MC, Fufa BO (2019). Major onion (Allium cepa L.) production challenges in Ethiopia: A review. Journal of Biology, Agriculture and Healthcare 9:42-47. |
|
|
Haile A, Hordofa T, Meskelu E, Mohammed M, Dririsa G, Derese RA, Kebede E, Mamo F, Admasu W, Bekele S, Tefera T (2020). Estimation of Crop Water Requirement and Irrigation Scheduling of Major Crops for Different Agro-ecology of Ethiopia. Results of Natural Resources Management Research. |
|
|
Hanson B, May D, Voss R, Cantwell M, Rice R (2003). Response of garlic to irrigation water. Agricultural Water management 58(1):29-43. |
|
|
Hillel D (2000). Salinity management for sustainable irrigation: integrating science, environment, and economics. The World Bank. |
|
|
Hillel D (2004). Introduction to Environmental Soil Physics.Elsiviers Academic Press, Amesterdam. |
|
|
Jordan J, White R, Vietor D, Hale T, Thomas J, Engelke M (2003). Effect of irrigation frequency on turf quality, shoot density, and root length density of five bentgrass cultivars. Crop Science 43(1):282-287. |
|
|
Kebede W (2003). Shallot (Allium cepa var. ascalonicum) responses to nutrients and soil moisture in sub humid tropical climate. Unpublished thesis dissertation Swedish University of Agricultural Sciences, Agraria. |
|
|
Kebede NT (2019). Effects of Deficit Irrigation and Mulch Levels on Growth, Yield and Water Productivity of Onion (Allium Cepa L.) at Werer, Middle Awash Valley, Ethiopia. Haramaya University. |
|
|
Kifle M, Tilahun K, Yazew E (2008). Evaluation of surge flow furrow irrigation for onion production in a semiarid region of Ethiopia. Irrigation Science 26(4):325-333. |
|
|
Kirnak H, Higgs D, Kaya C, Tas I (2005). Effects of irrigation and nitrogen rates on growth, yield, and quality of muskmelon in semiarid regions. Journal of Plant Nutrition 28(4):621-638. |
|
|
Maas E, Tanjii K (1990). Agricultural salinity assessment and management. Asce manualsandreportsonengineering. New York: American Society of Civil Engineers pp. 262-304. |
|
|
Mekonnen DA, Mihretu FG, Woldetsadik K (2017). Farmyard manure and intra-row spacing on yield and yield components of Adama Red onion (Allium cepa L.) cultivar under irrigation in Gewane District, Afar Region, Ethiopia. Journal of Horticulture and Forestry 9(5):40-48. |
|
|
Mellor JW, Dorosh P (2010). Agriculture and the economic transformation of Ethiopia. |
|
|
Nigussie A, Kuma Y, Adisu A, Alemu T, Desalegn K (2015). Onion production for income generation in small scale irrigation users agropastoral households of Ethiopia. Journal of Horticulture pp. 1-5. |
|
|
Rhoades J, Loveday J (1990). Salinity in irrigated agriculture. Agronomy 30:1089-1142. |
|
|
Sarkar S, Goswami S, Mallick S, Nanda M (2008). Different indices to characterize water use pattern of micro-sprinkler irrigated onion (Allium cepa L.). Agricultural Water Management 95(5):625-632. |
|
|
Shock CC, Feibert EB, Saunders LD (1998). Onion yield and quality affected by soil water potential as irrigation threshold. HortScience 33(7):1188-1191. |
|
|
Shock CC, Feibert EBG, Jensen L, Klauzer J (2010). Successful onion irrigation scheduling. |
|
Copyright © 2024 Author(s) retain the copyright of this article.
This article is published under the terms of the Creative Commons Attribution License 4.0


