ABSTRACT
Women’s participation in the agricultural labour force (38.87 and 55.67%) in India and the State of Andhra Pradesh, India (Census of India, 2001) plays a distinctive role in earning a livelihood for the family. The objective of the study was to examine the pattern of women work force in agricultural activities in Andhra Pradesh (AP), India and is based on secondary data taken from the census of 2001 and 2011 and primary survey undertaken in six selected districts of Andhra Pradesh. The proportion of women agricultural labour is more than male labour in all the districts. With respect to gender gap, the participation gap has been narrowed but remuneration and advancement gap between male and female workers still exists. The OLS regression was employed to estimate the various factors which affect the female work force participation in Andhra Pradesh. At the district level a high inter district variation has been observed for the work force participation for men and women. With the emerging commercialization of agriculture and introduction of new technologies, capacity building of women workforce is important for achieving sustainable agricultural growth and improving the rural livelihood security.
Key words: Women’s participation, agricultural labour, gender gap, livelihood security.
Women are 48.5% of the general population of India and agricultural sector is the largest employer of women. According to official statistics (National Sample Survey 68th round), in the rural areas, 59% men work in agriculture, but the figures are 75% for women. Women’s participation in agriculture has been growing relative to men who not only implies increased dependence of women on agriculture but also reiterates their crucial role in the sustainable growth and future of this sector. Mahapatra (2002) highlighted that women's economic productivity is a critical factor, as the dependence of the family on their contribution to household resources increases with the poverty status of the household. Valipour (2014, 2015) also used the important indices of rural population to total population and total economically active population in agriculture to total economically active population to estimate the values of area equipped for irrigation.
Agriculture is the main occupation and 66% of population is engaged in agriculture and related activities in Andhra Pradesh, India. Rice is the major food crop and staple food of the state. Other important crops are Jowar, Bajra, maize, ragi, small millets, pulses, tobacco, cotton and sugar cane. Women agricultural workers constitute a large majority of the work force in Andhra Pradesh, India. The main agricultural operations performed by women in paddy cultivation are transplanting, weeding harvesting, sowing, harvesting and threshing of other crops like sorghum, ground nut, cotton and maize. Except for ploughing all the agricultural work is carried out by women labour.
The movement of men out of agriculture has led to an increase in women's share of the agricultural workforce and an expansion of their role in the sector. However, with labour absorption in agriculture on the decline, particularly in terms of paid jobs, more than two thirds of women workers are self-employed, working as managers and helpers on the family farm without any remuneration. Those who continue to work as casual labour earn wages less than the statutory minimum. Women in agriculture face increasing responsibility for ensuring household food security under adverse economic conditions and an intensification of their work burden (Aruna, 2010).
Closing gender gaps is thus not only a matter of human rights and equity; it is also one of efficiency (Global Gender Gap Report, 2012). The Global Gender Gap Index examines the gap between men and women in four fundamental categories (sub indexes): economic participation and opportunity, educational attainment, health and survival and political empowerment. In the present study one variable each under first three categories of the sub indexes were analysed in terms of female work force participation, female literacy rate and sex ratio for the state of Andhra Pradesh.
The need for gender statistics in formulating policies and programmes can hardly be over-emphasized. To understand women’s work force participation in agriculture and the gender gaps this paper analyses the data from the census reports of 2001 and 2011 with the following main objectives. The Census of India is a veritable mine of information on demographic, social and economic aspects of population. It is the only source of population characteristics at the lowest administrative levels; village in rural areas and ward in urban areas (Census of India, 2011).
Objectives
1. Understand the gender gap and trends and pattern of women’s workforce participation in agriculture at the district level in Andhra Pradesh between 2001 and 2011.
2. Identify the determinants of female labour force participation in Andhra Pradesh.
Sampling design
The present study is based on both secondary data taken from the census of 2001 and 2011 and primary survey undertaken in purposively selected six districts, Nalgonda, Mahbubnagar, Warangal, West Godavari, Guntur and Kurnool representing the three regions of Andhra Pradesh, namely Coastal, Rayalseema and Telangana having high participation of women agricultural labour especially in the rice sector. Data was collected from 420 farmers on labour requirement and availability especially for rice cultivation. The analysis of data from the 2001 and 2011 census was undertaken to gain an understanding of the increasing or decreasing trends of women agricultural workers and what would be its implications for the rice sector. The State Primary Census Abstract 2011, Figures at a Glance-census 2011 of the Directorate of Census Operations AP were primarily referred to arrive at the different male and female work participation rates used in the study.
The variables in the study have been defined and derived in the following manner:
1. Worker: Based on the definition of work in census 2011, a worker is a person who has participated in any economically productive activity with or without compensation or profit.
2. Work participation rate: Is defined as the number of workers per hundred population
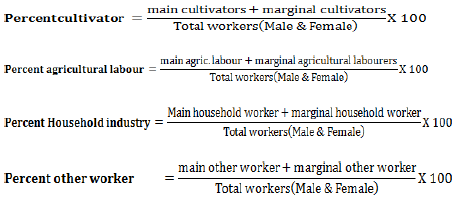
Female Work Participation Rate and Male Work Participation Rate was worked out in the following manner:

3. Gender gap: The difference between the female – male participation was calculated to find the gap between the sexes.
4. Sex ratio: Defined as the number of females per 1000 males in a population.
5. % Scheduled caste population: Percent of scheduled caste persons to total population.
6. Gender gap index: Examines the gap between men and women in four fundamental categories (sub indexes): economic participation and opportunity, educational attainment, health and survival and political empowerment. In the present study one variable each under first three categories of the sub indexes were analysed in terms of female labour force participation, female literacy rate and sex ratio for the state of Andhra Pradesh.
7. Economic participation and opportunity: This sub index is captured through three concepts: the participation gap, the remuneration gap and the advancement gap. The participation gap is captured using the difference in labour force participation rates.
8. Educational attainment: In this sub index, the gap between women’s and men’s current access to education is captured through ratios of the female literacy rate to the male literacy rate
9. Health and survival: This sub index provides an overview of the differences between women’s and men’s health and uses the variable sex ratio at birth and political empowerment was not included in the present study.
In order to analyse the determinants of female labour force participation OLS regression was worked out. Sex ratio, female literacy rate, percent scheduled caste population and male work participation rate were the independent variables and female labour force participation was dependent variable. Time was taken as a continuous dummy variable. Ordinary least square method (OLS) was employed because of its unique advantages/characteristics such as the possibility of negative and positive residuals getting cancelled can be avoided by using OLS. The regression line passes through the sample means and is as close as possible to the data points. The mean of the residuals is zero. The residuals are uncorrelated with the predicted Y and also uncorrelated with the observed values of independent variables.
The OLS model fitted was as follows:
Where, Yi = FWFP; βo = Coefficient for the constant/intercept; Xi are the independent variables/regressors; βi = coefficients of the respective independent variables / regressors; Dt = 0 for 2001; Dt = 1 for 2011, and U = Constant variance disturbance term.
Proportion of workers in AP
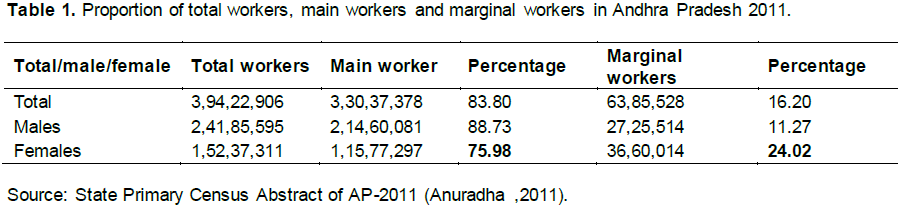
In AP according to 2001 census, the population of the state was 762.10 lakhs of which women were 376.82 lakh and it has increased to 846.65 lakh in 2011 with 421.55 lakh women (Census 2001 and 2011) and 66.6% population living in rural areas is depending on agriculture and allied activities. Table 1 shows the distribution of workers into main, marginal and total workers in AP. It can be observed that majority (83%) of the overall population and also the male (88%) and female (75%) fall in the main worker category. However the proportion of females is more in the marginal workers category as compared to males. Women agricultural workers constitute a large majority of the work force in AP. The main agricultural operations performed by women in paddy cultivation are transplanting, weeding harvesting, sowing, harvesting and threshing of other crops like sorghum, ground nut, cotton and maize. Except for ploughing all the agricultural work is carried out by women labour. The figures speak and indicate there is an increase in total women agricultural labour from 2001 to 2011 census year. It was 7179601 persons in 2001 which has increased to 8837732 persons according to 2011 census.

Work participation rate in Andhra Pradesh in 2001 and 2011
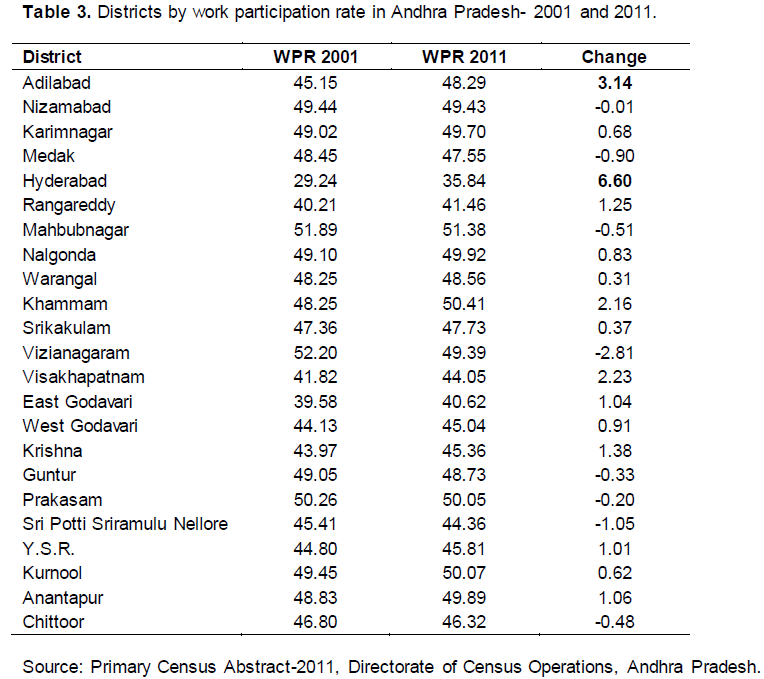
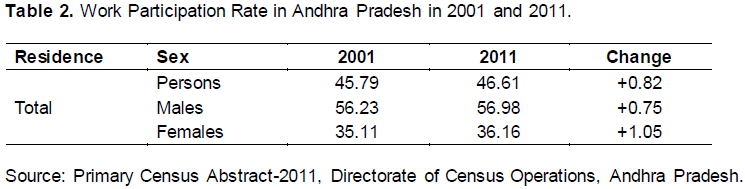
The findings in Table 2 show the rural female work force participation rates in AP in 2001 and 2011. The female work participation rate was 35.11 in 2001 and it is 36.16 in 2011 indicating an increase in 1.05% over the last decade which is twice as that of male work participation rate. This may be due to the change in the definition of work, which according to the 2011 census defines a worker as a person who has participated in any economically productive activity with or without compensation or profit and the work participation rate is defined as the number of workers per 100 population (Primary Census Abstract, 2011). The work participation rate for females has been showing an increasing trend. District wise work participation rate in AP (Table 3) indicated that Vizianagaram and Mahbubnagar recorded the highest work participation rate in 2001 with a slight fall in both the districts in 2011. Districts like Hyderabad, Vishakapatnam and Khammam recorded increase probably due to their commercial status.

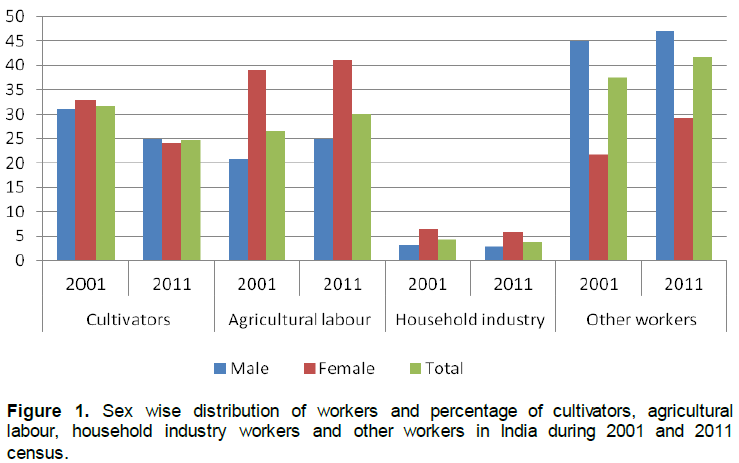
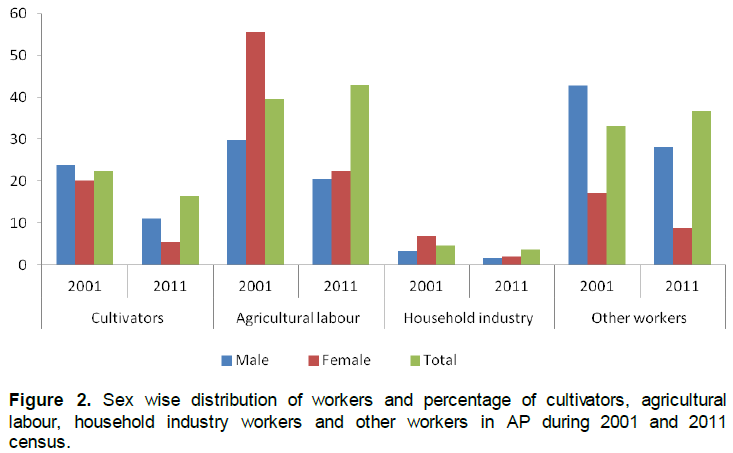
Sex wise distribution of workers and percentage of cultivators, agricultural labour, household industry and other workers in India and AP in 2001 and 2011
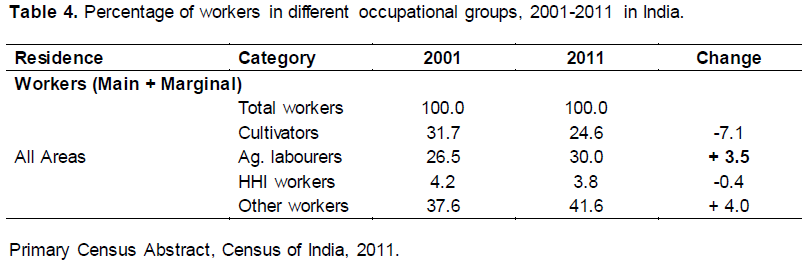
The numbers of agricultural cultivators (Table 4) has gone down by 7.8 million, that is, from 103.6 million in 2001 to 95.8 million in 2011, that is, a decrease of 7.1%. At the same time the number of agricultural labourers has increased by 3.5% only. The neglect of the agriculture sector and the limited employment opportunities it has are further shown through the decrease in the number of total workers by 3.6% in agriculture and allied activities. Another interesting fact that comes to light from this analysis is that most of the agricultural labourers who are classed as ‘marginal workers,’ or people getting work for less than six months in a year, are males whereas about 40% of the female agricultural workers are classed as ‘main workers’ who get more than six months of work in a year. These figures reiterate the fact of feminization of agriculture in India. Women are mainly wage labour they are also as main workers, marginal workers in agriculture (Vepa, 2005). This pattern is also reflected in the overall employment trend where the total number of male workers getting employment for more than six months in a year has declined by five percent between 2001 and 2011. In sharp contrast, the overall pattern of female work is that the number of female workers getting employment for more than six months a year has gone up by 2.3%. Thus the move towards the expansion of the informal sector is gendered in character.
From Figure 2, we can observe that the proportion of male cultivators in AP in 2001 was 24.01% and it has decreased to 11.05% in 2011 and female cultivators in 2001 were 20.08% and it is 5.41% in 2011. It shows that the proportion of both male and female cultivators has decreased in 2011. The female agricultural labour which was 55.67% in 2001 has decreased to 22.42% in 2011. The reduction in the women agricultural labour force is consistent with the overall reduction in the agricultural work between the census periods of 2001 and 2011. There is a marked decline in the cultivators and agricultural labour category of workers for both males and females. This is in conformity with the fact that India is witnessing the phenomenon of fewer farmers’ every day (Sainath, 2013). It can be observed from the table that there is a shift from cultivators to agricultural labour in AP. This shift at all India level is 24.60 in 2011 from 31.65 in 2001 (Figure 1). An increase in the workers in the other category can be observed both at all India and AP level from 2001 to 2011 census year which is not a healthy sign for an agrarian country like India.


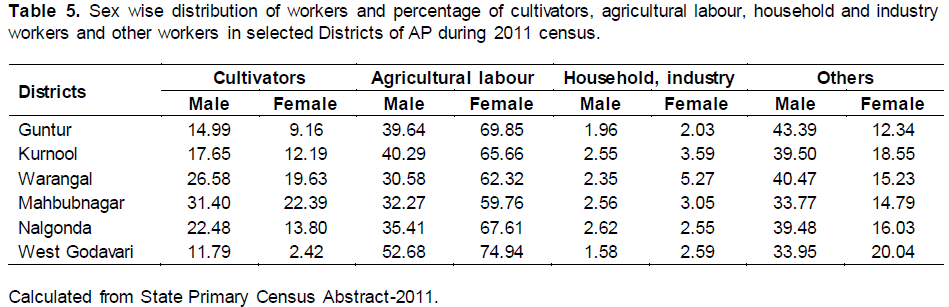
Sex wise distribution of workers and percentage of cultivators, agricultural labour, household industry and other workers in selected districts of AP in 2011
The proportion of female cultivators is less than males in all the districts of the study area the probable reason may be that land is still in the names of the male member of the household. The best performing district for female cultivators is Mahbubnagar with 22.39%. The percentage of female agricultural labour is higher than that of male agricultural labour in all the districts of the study area. For men agriculture is not the only avenue for wage earning and other casual work provides more wages than agriculture, therefore they seek work as construction labour, and other such skilled and unskilled work. Whereas women have the responsibility of family care and therefore seek work close to their homes and thus continue to work as agricultural labour. The percentage of male workers in household industry is less than the females in all the districts of the study area which is in contrast for the other workers category where males outnumber females in all the districts. The reasons that can be attributed are the casualisation of the workforce and men are still considered as the bread winners of the family so their participation in wage earning is high. The drop in agricultural employment shows that the agricultural workers have been compelled to seek work in the casual labour market (Archana, 2013).
From the findings in Table 5 we can infer that women form the major agricultural labour work force in all the selected districts of the study area. Moreover if we combine the percentage of women agricultural labour and the cultivators they constitute about 77 to 82% of the agricultural work force where as men constitute 54 to 64%. The movement of men out of agriculture as reflected in their higher participation 33 to 43% in the other category of workers in all the districts of the study area probably has led to an increase in women's share of the agricultural workforce and an expansion of their role in the sector. Women agricultural workers are finding it harder to shift out of agriculture than men, and their stake is increasing in a sector that is riddled with adverse economic conditions and where they have little rights, authority, access to or control of resources required for enhancing production and household income (Aruna, 2010).

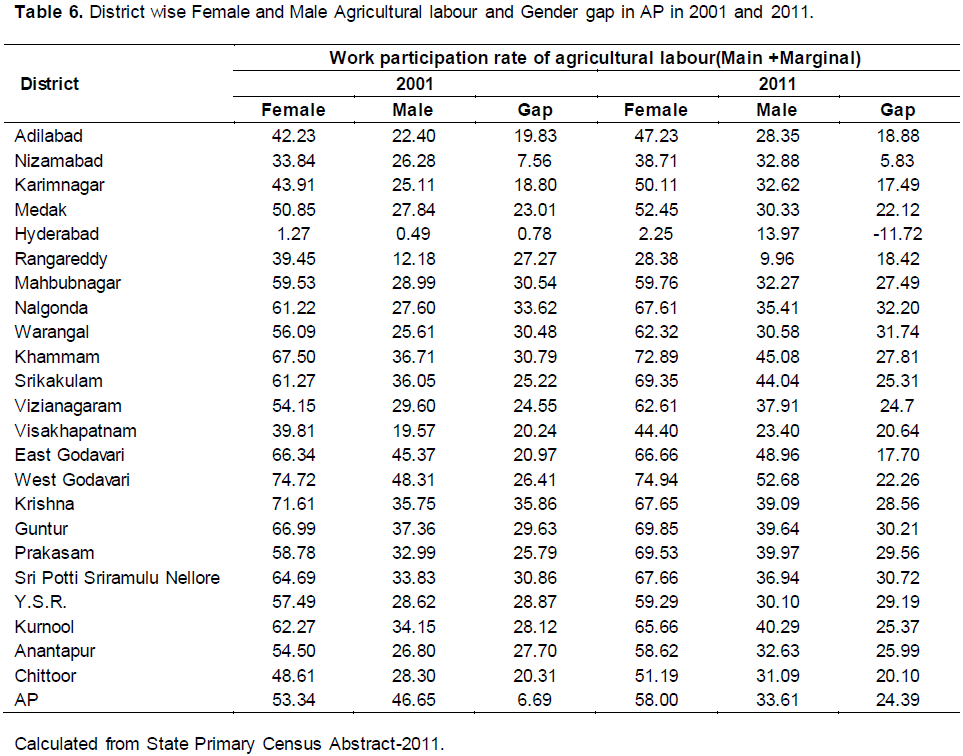
District wise female and male agricultural labour and gender gap in AP in 2001 and 2011
From the Table 6 it can be seen that among all the districts of AP, West Godavari recorded the highest work participation rate for females 74.72 in 2001 and 74.94 in 2011 followed by Krishna 71.61 in 2001 and Khammam 72.89 in 2011. The overall participation of women as agricultural labour in AP is 53.34 and 58% compared to 46.65 and 33.61 for males with a female male gender gap of 6.69 and 24.39% in 2001 and 2011 respectively. It can be seen that agricultural work is wholly dependent on the services of the female labour force. Similarly, most of the districts of AP have a high female agricultural labour force participation ranging from 33 to 74% with only six districts showing a percentage below 40.

From the findings in Table 6, we can observe a wide, 18 to 35% female to male gender gap in agricultural labour force in all the districts reiterating the fact that women make up a considerable work force in agriculture in AP. An analysis was undertaken in the selected districts for understanding the labour availability for rice sector and data was collected from 420 farmers from six major rice growing districts of Andhra Pradesh representing all the three Coastal, Rayalseema and Telangana regions. Farmers’ in the study area reported a high dependence on hired women labour for activities like transplanting, weeding and harvesting. Though the figures in the table indicate a high availability of women labour, but certain factors like competing demands for labour in rice cultivation and cotton and of late the availability of work under MGNREGA scheme there is scarcity of labour being faced by the rice cultivators. This phenomenon has provided a better bargaining power to the women agricultural labour with serious repercussions for the rice cultivators.
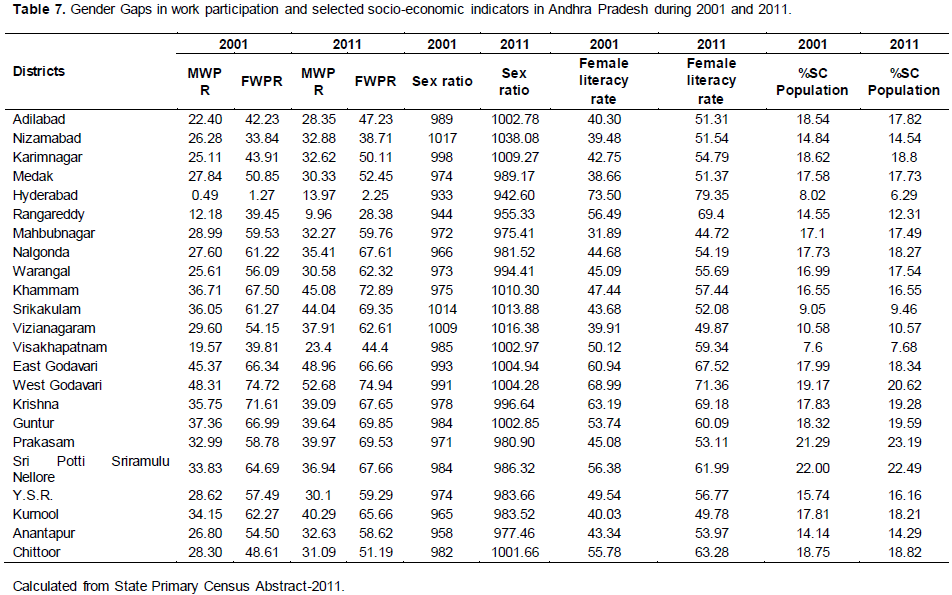
The findings in Table 7 indicate that female work participation is higher than males in both the census years. Moreover there is substantial improvement in the socio-economic factors like female sex ratio and female literacy rate which is a good indicator towards the gender equality in these factors. Though the participation gap has been narrowed but it should not mislead one to believe that all is well with women agricultural workers as a wide remuneration (wage) gap exists between males and females both in agricultural and non-agricultural wages. From the primary survey in the selected districts a wide wage differential was reported by women labour where the rates for men were as high as Rs.500 per day while the highest being paid to women for transplanting rice was Rs.300 per day. In the rural areas, wages earned per day by a regular wage/salaried employee is Rs 322 for men and Rs 202 for women (Kumar, 2013).

The male-female disparity in wages has widened and the disparities continue to be highest for operations in which women specialize (Aruna, 2010). The advancement gap for women workers has not improved due to the fact that the movement of men out of agriculture has led to an increase in women's share of the agricultural workforce and an expansion of their role in the sector. However, with labour absorption in agriculture on the decline, particularly in terms of paid jobs, more than two thirds of women workers are self-employed, working as managers and helpers on the family farm without any remuneration.
Determinants of female labour participation
In the agricultural sector, there is a negative relationship between literacy and rural female labour participation as literacy enhances their employability and aspirations for better jobs and to shift from agriculture to non-farm work. The factors like sex ratio, percentage of male agricultural workers to total agricultural workers, percent of scheduled caste population and female literacy percentage are expected to have a direct effect on female rural work participation. To study the relationship between rural work participation rate and the socio-economic factors the OLS regression was worked out.
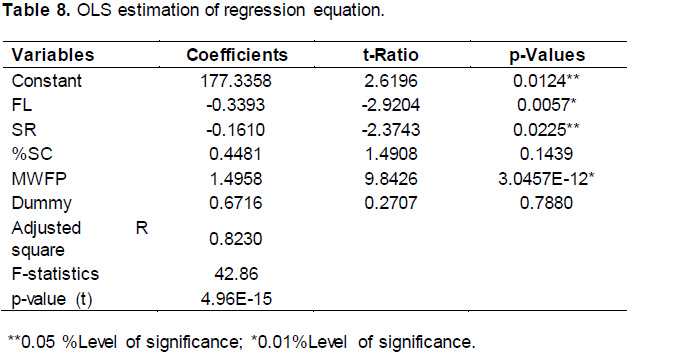
The relationship between the female literacy rate and female labour participation is negative. It is clear that that the female labour participation is affected by literacy and it is found to be significant at 0.01% level of significance with a P value of 0.002184 (Table 8). It means that higher the level of education, lower the level of women’s participation in agriculture. Similar findings have been reported by Mazumdar and Guruswamy (2006), Kaur and Kaur (2012) and Shilen (2012).
Another variable, which is considered as the determinant of Female Labour Force Participation rate is the sex ratio which was found to be significant at 0.01% level of significance. The relationship between sex ratio and female labour force participation rate is negative and significant with a P value of 0.017966 at 0.05% level of significance. This means to say that, the districts with higher sex ratio have fewer women available to join labour force and low female participation in economic activities.
Male work participation rate is the important variable included in the model to capture the inter district variations in female labour force participation in Andhra Pradesh. The sign of co-efficient of variable percent scheduled caste population is positive, which implies that higher workforce participation of scheduled caste population is more likely to bring about high level of female workforce. Earlier studies have indicated that the scheduled caste women workers have a significantly higher odds ratio of being an agricultural labourer. Similarly, in the districts selected for the study the proportion of scheduled caste population is high (20.62%) especially in West Godavari district which has the highest percentage of women agricultural labour (74.94%).
The adjusted R for the OLS model fitted for the study was found to be 0.8275. The equation is found to be a good fit as it explains as much as 82% variation in rural female labour participation. However among the explanatory variables, sex ratio, female literacy rate and percent Scheduled Caste population were found to be statistically significant.
In the present study it was observed that the proportion of both cultivators and agricultural labour has fallen for males and females in 2011. The proportion of women agricultural labour is higher than males in all the selected districts of the study area.
One of the reasons could be that more males have moved out of the agricultural labour force but women still tend to be employed as wage labour in agricultural activities. It is imperative therefore, to provide technical knowledge and skills to build capacity of women agricultural labour to harness their potential to contribute towards sustainable agricultural growth. The variables like sex ratio, female literacy rate were found to be negative and significantly correlated with female work participation rate whereas percent scheduled caste population was positive indicating that the presence of a large population of scheduled caste provides more women to the work force.
Strategies for improving position of women labour
1. The generation of productive and gainful employment to absorb our growing women labour force must form a critical element in the strategy for achieving inclusive growth,
2. In order to promote gender equity, steps have to be taken to increase women’s participation in the labour force with necessary skill development, labour policies and also the social security framework,
3. Giving women farmers’ equal access to equipment and services such as seeds, tools, credit and land will help in achieving sustainable agricultural growth,
4. Labor demands in agriculture are high and competing for sowing, transplanting and harvesting, Women Self-Help Groups as contractual labor could be trained and promoted to provide labor for peak activities.
The authors have not declared any conflict of interest.
REFERENCES
|
Anuradha YV (2011). Figures at a Glance – Census 2011 (Primary Census Abstract), Directorate of Census Operations, Andhra Pradesh, India.
|
|
|
|
Archana P (2013). Distressing signals for workers and farmers, People's Democracy, Weekly organ of the Communist Party of India (Marxist), 37(9).
|
|
|
|
|
Aruna K (2010). Women workers in Agriculture:Expanding responsibilities and shrinking oppurtunities. ILO Asia specific working paper series, Sub regional office for South Asia, New Delhi.
|
|
|
|
|
Census of India (2011). Census of India 2001 and 2011, RGI, GOI.
|
|
|
|
|
Global Gender Gap Report (2012). The Global Gender Gap Report: World Economic Forum, 91-93 route de la Capite CH-1223 Cologny/Geneva Switzerland. Available at:
|
|
|
|
|
Kaur P, Kaur G (2012). Factors affecting female labour force participation in Punjab: An inter-district analysis. J. Res. Peace Gender Dev. 2(4):81-88.
|
|
|
|
|
Kumar NDS (2013). Times News Network: Unemployment rate increases in India, Jun 23, 2013. Available at: Mahapatra S (2002). "Women Participation in Labour Force", New Delhi: Rajat Publications. pp. 46-54.
|
|
|
|
|
Mazumdar S, Guruswamy M (2006). Female Labour Force Participation in Kerala: Problems and Prospects. International Institute for Population Sciences Mumbai, India. Available at:
View
|
|
|
|
|
Primary Census Abstracts (2011). Government of India. Available at:
View
|
|
|
|
|
Sainath H (2013). Over 2000 fewer farmers every day, The Hindu Newspaper. Available at:
View
|
|
|
|
|
Smita P (2012). Determinants of Women's Labour Force Participation Rate in India: An Econometric Analysis, University of Nottingham, UK. Project presented in part fulfilment of the requirements for the completion of an undergraduate degree in the School of Economics, University of Nottingham.
|
|
|
|
|
Valipour M (2014). Future of agricultural water management in America. J. Agric. Res. 52(2):245-267.
|
|
|
|
|
Valipour M (2015). A comprehensive study on irrigation management in Asia and Oceania. Archiv. Agron. Soil Sci. 61(9):1247-1271.
Crossref
|
|
|
|
|
Vepa S (2005). "Feminisation of Agriculture and Marginalisation of their Economic State". Econ. Polit. Wkly 40(25):2563-2568.
|
|