Full Length Research Paper

ABSTRACT
Plant residues influence the energy balance and water vapor flux on the soil surface. The aim of this research was to quantify the effect of the amounts and distribution of crop mulching on evaporation of soil water. The study was carried out at the Instituto Agronômico do Paraná, located in Londrina City, State of Paraná, Brazil. In experiment 1, soil water evaporation was determined according to the quantity of soybean and wheat residues applied (0, 2, 4 and 6 t ha-1); while in experiment 2, soil water evaporation was determined based on the distribution of 4 t ha-1 residue of soybean and wheat, which was applied in 33, 66 and 100% as soil cover. Eight weighing lysimeters were used with two replications, and denominated cycles for each experiment period. The results showed that compared to bare soil, reduced evaporation at the end of the evaluations were 17% for 2 t ha-1, 28% with 4 t ha-1 and 25% for 6 t ha-1 of residues of soybeans, in the first cycle during winter. During spring cycle, evaporation reductions in cycle 1 were 10, 12 and 23% for 2, 4, and 6 t ha-1, respectively. Soil water evaporation decreased, compared to the bare soil, as soon as soybean residues rate increased. This showed the largest reduction (29 to 33%) when the residues were distributed uniformly over the lysimeters.
Key words: Lysimeter, water balance, soil moisture.
INTRODUCTION
Tillage system due to the maintenance of crop residue on the soil surface and its minimum tillage may lead to reduction of soil loss by erosion (Lal, 2007; Triplett Júnior and Dick, 2008) as well as runoff (Castro et al., 2006). On the other hand, the crop residue maintenance increases the rate of infiltration (Alves Sobrinho et al., 2003), and decrease the temperature range of soil (Torres et al., 2006), retaining more water (Freitas et al., 2004a).
Although there are several positive effects of straw on soil water evaporation, these inferences may not represent the loss of water. This is because the evaluations are based on gravimetric measurements in the soil moisture (Hillel, 1973), which are influenced by solar radiation, wind speed, temperature and humidity (Soares et al., 2001; Lyra et al., 2004), and also by the quantity (Freitas et al., 2004b) and distribution of plant residue in the soil surface.
The irregular distribution of crop residue in the soil surface causes the occurrence of localized accumulation; as consequence, problems like planter stuck, irregular seed emergence and rows under different soil fertility may occur. However, a proper distribution of residue in the soil surface operates as a physical barrier between the atmosphere and soil. This may prevent increased soil water evaporation, when soil is bare or in the initial phases of crop development (Stone et al., 2006; Souza et al., 2008). Soil water evaporation depends primarily on irrigation frequencies, soil texture and percentage of ground cover.
The irregular straw distribution through harvesters justifies the necessity of accurate measurements of soil evaporation and plant evapotranspiration using estimated models that can be obtained by lysimeters. The weighing lysimeters system allows measurements in short periods, usually less than one day, with greater accuracy. Lysimeters, developed by Fariaet al. (2006), have the accuracy to detect mass changes of 0.01 mm at intervals smaller than 1 h, which is adequate for most field applications.
In this sense, the evapotranspiration estimations in crops under incomplete cover may also be obtained by models of water movement in the soil-plant-atmosphere, which separate evapotranspiration in evaporation and transpiration components. Thus, the aims of this study were to quantify the effect of amounts and distribution of crop mulching on soil water evaporation in the region of Londrina, Paraná State, Brazil.
MATERIALS AND METHODS
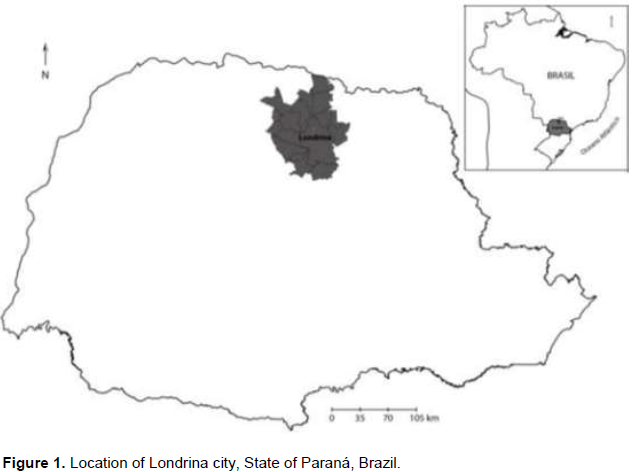
The experiments were performed at the Agronomic Institute of Parana (IAPAR) located in Londrina City, State of Paraná, Brazil (latitude of 23°18’S, longitude of 51°09’W and altitude of 585 m) (Figure 1). The climate is classified as humid subtropical (Cfa) according to Köeppen classification and the average annual temperature is 21°C. Although the rainy season occurs between the months of October and March, with annual average rainfall of 1,500 mm, there is no occurrence of defined dry season (IAPAR, 2000). The soil of the experimental area was classified as Oxisol (Embrapa, 2013).
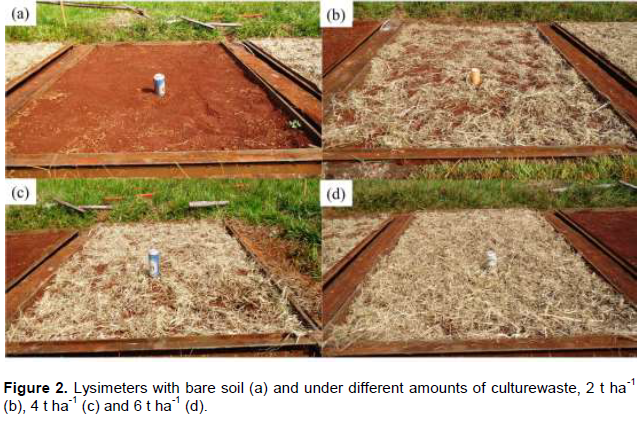
Measurements of evaporation on different levels of crop residue were performed in eight weighing lysimeters installed and maintained fallow. The lysimeters are metal tanks with dimensions of 1.4 m wide, 1.9 m long and 1.3 m deep. They were filled with local soil and placed at ground level (Figure 2), as described in detail by Faria et al. (2006).
Each tank is setup over a scale. The scales are a system of levers used for mass reduction; they are able to detect changes in mass equivalent to 0.1 mm at intervals of up to 1 h. The mass changes are measured by a load cell armored type “S” according to the manufacturer (Alpha Electronic Instruments Ltda, São Paulo, Brazil) and has capacity for 100 kgf tension, sensitivity of 10% ± 2 mV V-1 and IP67 protection index.
The load cells used had chart of calibration and certifying operation; however, preliminary tests in laboratory with known masses were performed to detect possible errors.
The storage variation readings occurred every three seconds and the data acquisition system (Datalogger CR21X Campbell Scientific, Logan, USA) stored the average of intervals of 10 min for each load cell, to avoid instantaneous fluctuations in measures caused by wind.
An external battery of 12 V powered the data acquisition system. The logger data were firstly transferred to a memory module, then to a computer by the software PC208W.
Test calibrations for each lysimeter were performed according to the procedure described by Mariano et al. (2015) before the experiment begins. Subsequently, the data were converted to millimeters using the values ​​obtained in individual initial lysimeter calibration.
Soil water evaporation was determined by accounting for input, output and storage water in each lysimeter, according to the following equation:
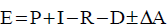
where E is evaporation of water soil (mm); P is precipitation (mm) measured at the IAPAR weather station, located next to the experiment; I is irrigation (mm); R is runoff, considered zero because of the edge of the lysimeter tank; D is drain (mm); ΔA is variation in storage, given by the difference in weight in the period.
The evapotranspiration reference (ETo) was calculated daily by the Penman-Monteith method using the CLIMA software (FARIA et al., 2003).
Experiment 1 consisted of the determination of water evaporation from the soil with four amounts of crop residues (0, 2, 4 and 6 t ha-1) in two periods: winter and spring (Figure 2).
To define the rate of crop residues used, we considered the average yield of wheat crop residue of 8 to 11 t ha-1 in a population density of 350 seeds m2 (Heinemann et al., 2006) and soybean of 3.5 to 5.5 t ha-1 with a population density of 52 seeds m2. These average values ​​depend on genetic, edaphoclimatics and cultural practices factors.
The applications of soybean crop residues occurred during the winter and the wheat crop residues occurred during spring, respectively. Two replicates of each experimental treatment called cycles 1 and 2 were carried out. Before starting each cycle, lysimeters were covered with fine nylon net to prevent a possible removal of residues by wind.
Lysimeters were calibrated with soil moisture at field capacity. Moreover, at the beginning of each measurement cycle, a water depth of 50 mm was applied by sprinklers for a better accommodation of the residues on the soil surface. During this initial water application, treatments without residues were covered by the use of disks of natural and synthetic fibers, aiming to protect the area.
The experimental periods during the winter were May 13 to 22th (11 days) and from May 28 to June 7th, 2011 (13 days). During spring period, measurements were carried out from September 24 to October 10th (26 days) and November 21 to December 9th, 2011 (22 days). Crop residues of soybean and wheat were dried in oven with forced air circulation for 48 h at a temperature of 65°C until constant weight was obtained; then the quantities of residues required in each treatment according to the area of the lysimeters were determined.
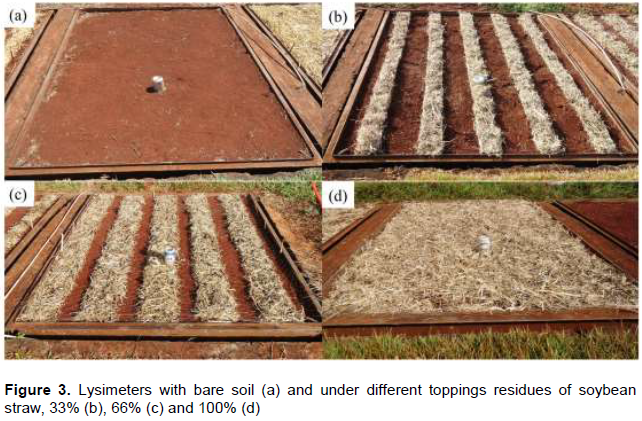
In Experiment 2, evaluations were conducted to determine the water evaporation from the covered soil with 4 t ha-1 of soybean residues during the fall/winter, and wheat residues during the spring/summer, with three uniformity of distribution (33, 66 and 100%) and a control treatment without residues, similar to those described by Freitas et al. (2014). Like in Experiment 1, two replications of each treatment called cycles (Figure 3) were performed and mass measurements from lysimeter were initiated after the irrigation of 50 mm.
The cycles were performed during periods of June 12 to 21th (winter) and July 08 to 18th, 2011 (winter), a total of 9 and 10 days. While the cycles from the second period were conducted in October 21 to 29th (spring) and December 16th, 2011 to January 09th, 2012 (summer), a total of 8 and 24 days, respectively.
Crop residue of soybean and wheat were obtained and managed in the same way as Experiment 1. To determine the amount of residue required for the distribution, 33 and 66% were divided into five band lysimeters of 9.33 and 18.66 cm depending on the distribution model proposed (Figure 3b and c); and calculation was performed by the total amount of residue (4 t ha-1) applied in the lysimeter area.
At the end of each experimental cycle, soil samples at depths of 5 cm in each lysimeter were sampled to determine the soil moisture. In all the evaluations, lysimeter drainage was performed
RESULTS AND DISCUSSION
Experiment 1
Soil evaporation was determined based on the different quantities of soybean and wheat residues in two cycles during winter and spring (Figure 4).
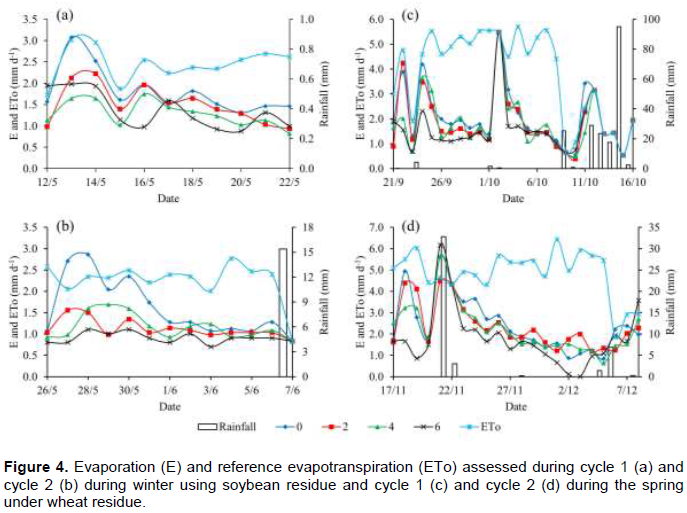
During each cycle evaluation, it was observed that evaporation increased with the occurrence of precipitation in all treatments. The water demand remained mostly constant during the evaluation periods, where the ETo average rates were 2.5 and 2.3 mm day-1 for cycles 1 and 2 in winter (Figure 4a and b). Furthermore, cycle 2 showed a rainfall accumulation of 15.4 mm in the last evaluation day (June 7th), a fact which disallows the beginning of a new drying period (Figure 4b).
Similar behaviors were observed during the spring; however, the average ETo rates were higher and ranged between 3.8 and 4.9 mm day-1 (Figure 4c and d).
In the evaluation, precipitations that increased evaporation in all treatments were recorded. In addition, it was observed that bare soil evaporation was greater than ETo, because of the high moisture conditions presented in the soil surface, which allowed a free water evaporation (Figure 4d).
In spring cycle 1, cumulative rainfall was 200 mm starting with irrigation on September 21th (Figure 4c). The precipitation volume recorded identified the reason for high rate of evaporation from all treatments. On the other hand, cycle 2 presented a cumulative rainfall of 45 mm, starting with irrigation on November 17th (Figure 4d).
The gradual reductions of evaporation rate based on time after the start of each cycle evaluated were due to the gradual soil surface layer drying (Figure 4). The effect was more pronounced in treatments with no residues, when soil water evaporation rate was equal to ETo on the first evaluation day, after the initial irrigation and rainfall that occurred over the two cycles. This indicates a short period (<1 day) for the phase 1 of the evaporation method proposed by Ritchie (1972).
The first stage of evaporation may take from one to three days and the magnitude of this period rates can reach 90% depending on the soil depth and hydraulic properties. In treatments with residue, the evaporation variation was not observed during the transition from stage 1 to stage 2, because evaporation rates were low from the early days, occurring fast decrease along the time until the surface became totally drought. In the evaluated treatments, the soil water evaporation decreased as much as soil moisture decreased, featuring the second stage of evaporation. This began close to the 5th day of drying, during the evaluation cycles (Figure 4).
The crop residues quantity effect on evaporation reduction is shown by the curves of cumulative evaporation at the end of the drying cycle, which is presented in Figure 5 during the winter treatments, using soybean residues.
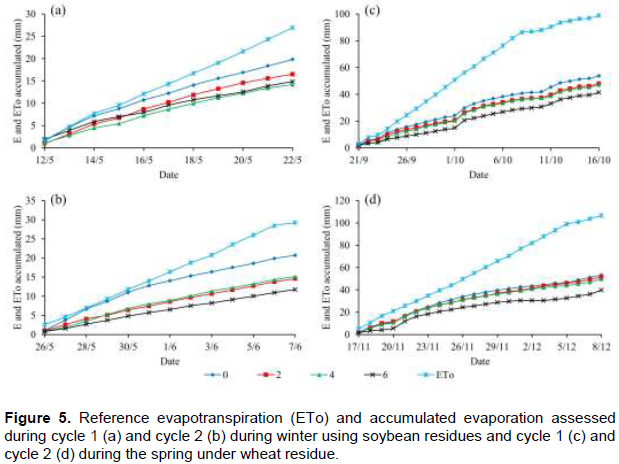
ETo values were 26.9 mm for cycle 1 and 29.2 mm for cycle 2. The cumulative evaporation for treatments 0, 2, 4 and 6 t ha-1 with soybean residues during cycle 1 from winter was 19.8, 16.5, 14.2, and 14.9 mm, respectively (Figure 5a). Moreover, in cycle 2 were recorded accumulated evaporation values of 20.7, 14.6, 15.2, and 11.8 mm for 0, 2, 4, and 6 t ha-1 treatments, respectively (Figure 5b). Analyzing Figure 5a and b, it has been found that the cumulative evaporation was lower in treatments of 4 and 6 t ha-1.
Drying cycles assessed during the spring showed reduced cumulative evaporation for 4 and 6 t ha-1 of wheat residues (Figure 5c and d), which emphasize the results obtained for the soybean waste (Figure 5a and b).
The ETo values accumulated during spring cycles were 98.8 and 106.7 mm (Figure 5c and d), consequence of an increased evapotranspiration. The cumulative evaporation during the cycle 1 for treatments 0, 2, 4, and 6 t ha-1 of wheat residue was 53.7, 48.1, 47.1, and 41.4 mm, respectively (Figure 5c). While in cycle 2, it was recorded cumulative evaporation of 53.2, 51.4, 49.6, and 39.8 mm for 0, 2, 4, and 6 t ha-1 of wheat residues, respectively (Figure 5d). Thus, it could be observed that cumulative evaporations obtained were similar, regardless of the differences between cycles.
The treatments carried out during the winter resulted in higher percentages of reductions in evaporation, in which cycles 1 and 2 under 4 and 6 t ha-1 treatments showed 28 and 43% evaporation reductions. During both spring cycles, 6 t ha-1 treatment showed reductions of 23 and 25%.
As daily ETo increased, the values of accumulated evaporation also increased, however, the soil moisture content (amount of water present in it) is the fact that drove the soil evaporation of each treatment. Overall, the cover residues were determinants before the fourth day after water application, because after this period, no effect from different soil cover residues on the phenomenon of water loss was observed.
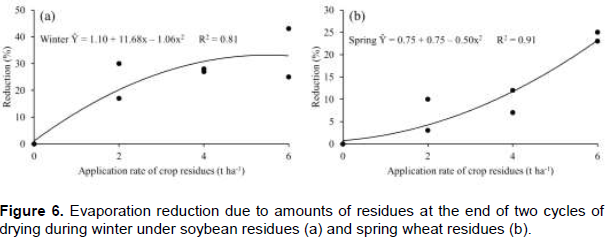
The second-degree polynomial model showed average reductions of 23, 28, and 34% in evaporation for rates of 2, 4, and 6 t ha-1 of soybean residues in both cycles during winter compared to bare soil (Figure 6a). The spring cycles showed evaporation reduction of 7, 10, and 24% for 2, 4, and 6 t ha-1of wheat residues, respectively (Figure 6b). The results confirmed data found by Freitas et al. (2004a); they were similar to those reported by Xie et al. (2006), who found reductions of 40.7% during the watermelon cycle under treatment with no coverage, and 17.8 to 25% for coverage treatments of sand and gravel, under cold weather conditions, where the maximum annual temperature was 20.7°C.
Experiment 2
The effects of residues distributions on soil evaporation and ETo versus time were plotted for two cycles at the end of the drying with soybean and wheat residues (Figure 7). The percentage of evaporation in cycle 1 from fall/winter was 67% compared to bare soil (Figure 7a). The atmospheric demand during the study period showed small variations with ETo rates of approximately 2.4 and 2.5 mm day-1 for cycles 1 and 2, respectively (Figure 7a and b).
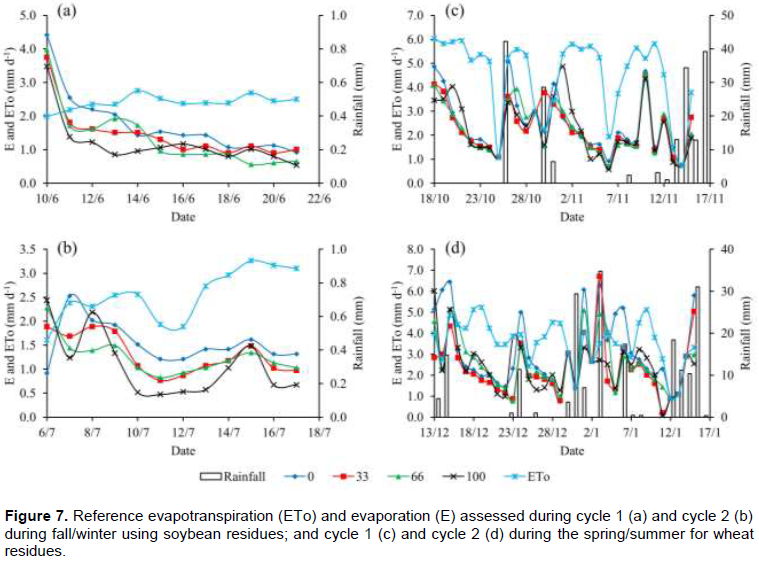
The cycle 1 from spring/summer presented evaporation rates of 95% for treatments with 33 and 100% of wheat residues, while 66% treatment had evaporation of 93% (Figure 7c). However, the lowest rates of evaporation occurred in treatments containing surfaces covered with wheat residues. In cycle 2, the evaporation rates were 74, 82, and 77% to wheat residues distributed at 33, 66, and 100% (Figure 7d).
When the soil surface showed high humidity, the evaporation exceeded the ETo, considering that the water was practically free to evaporate. On November 13, 14, and 24th and January 3, 5, and 15th, when precipitation occurred, an increased evaporation rates in bare soil were observed. On the other hand, after precipitation, treatments under residues application had the highest rates of evaporation, because those treatments retained the moisture for a longer period and supplied the atmospheric demand (Figure 7d). The occurrence of an increased evaporation in treatments under more distribution of residues can be attributed to errors from the lysimeters during rainfall periods, as mentioned by Faria et al. (2006).
Precipitations occurred during the evaluation period of spring/summer. It resulted in variable values of ETo over this period, which presented average of 4.50 and 3.56 mm day-1, respectively (Figure 7c and d). Frequency of rainfall occurred in short periods (<1 day) from the evaporation stage 1.
After the beginning of each rated cycle, the gradual reduction of the evaporation rate versus time occurred due to the drying of the soil surface layers from lysimeters. These effects were more pronounced in treatments without residues, when evaporation rates were similar to ETo only on the first day of the cycle. That indicates a short period (<1 day) for the evaporation stage 1. However, in treatments containing residues, transition of evaporation stage 1 to stage 2 was not observed, because evaporation rates were lower from the beginning. This resulted in a fast soil water decreases during the drying timing, influenced by evaporation and soil hydraulic properties. During evaluations, the soil water evaporation decreased as soil moisture decreased, featuring the evaporation stage 2, which started near the 5th day of drying (Figure 7).
Comparing the fall/winter treatments under soybean residues and spring/summer wheat residues treatments, the values ​​of evaporation were close, probably due to lower soybean residue coverage. During periods with more intense weather conditions, evaporation values ​​were close to those found during warmer period. This demonstrates dependence between water evaporation from the soil surface and atmospheric evaporative demand, also observed by Dalmago et al. (2010).
The soybean residues were less effective to protect and hold water on the soil surface compared to the grasses. A quantity of 3.5 t ha-1 of soybean residue makes the soil surface to be unprotected by 35%, while the same amounts of millet and maize residues provided 25 and 20% of bare soils (Silva et al., 2006).
The effect of crop residue distribution on evaporation reduction is shown by the curves of cumulative evaporation at the end of the drying cycle during fall/winter period under soybean residues (Figure 8a and b).
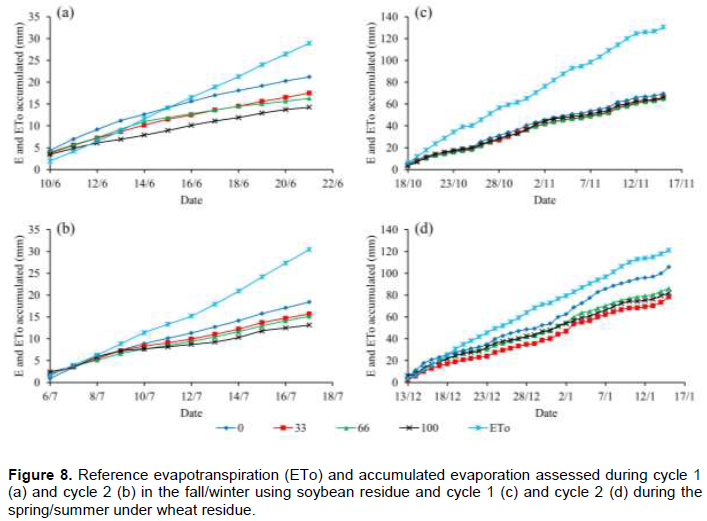
Decreases were observed in the accumulated evaporation rates with an increase in the soil surface coverage by soybean residues (100%), compared to bare soil during the two cycles evaluated. 66 and 100% distributions presented smaller increments of cumulative evaporation during cycle 1, with 16.3 to 14.3 mm compared to 21.2 and 17.5 mm from the bare soil treatment and treatment of 33%, respectively (Figure 8a). The cycle 2 showed accumulated evaporation values close to treatments of 33 and 66%, whose values were 15.7 and 15.1 mm, respectively. The 100% treatment presented the lowest cumulative evaporation with 13.2 mm compared to 18.4 mm from treatment of bare soil (Figure 8b).
Evaporation reductions due to the presence of wheat residues were visible at the end of each drying cycle during spring/summer (Figure 8c and d). However, coverage of 66% presented a smaller increment of cumulative evaporation during cycle 1, with 64.9 mm compared to bare soil. The coverage treatments of 33 and 100% had lower results of accumulated evaporation with 78.4 and 81.90 mm compared to 105.8 mm from bare soil treatment. The values of cumulative ETo were 130.43 and 121.13 mm, which resulted in a higher evaporative demand compared to the fall/winter. The different uniformity distribution were determinants before the 4th day after soil wetting and further this period observed a similarity among treatments and amount of water lost.
Figure 9 shows decreased evaporation in 17, 23, and 33% for the distribution of soybean residue of 33, 66, and 100% during the cycle 1 of the fall/winter season compared to bare soil. In cycle 2, second-degree polynomial model showed evaporation reductions of 15, 18, and 29% for residues distributions of 33, 66 and 100%, respectively.
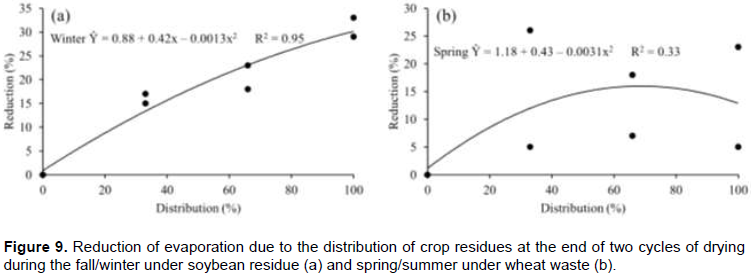
In spring/summer cycle 1, reductions in evaporation were 5, 7, and 5% for soil coverage of 33, 66, and 100% compared to bare soil (Figure 9b). While cycle 2 demonstrated a greater evaporation reductions, with values ​​of 26, 18, and 23% for soil coverage of 33, 66, and 100% compared to bare soil treatment. The evaporation reductions were smaller in cycle 2 to treatment of 33% of residue distribution with the consequence of a possible action of winds and rainfall recorded during the study period (197 mm).
CONCLUSION
The results of this study showed that significant evaporation decreases with an increasing amount of crop residues, mainly at treatments 4 and 6 t ha-1 with reductions between 20 and 43%, respectively. Soil water evaporation reduced with the uniform distribution of crop residues over the soil at rates of 33 and 29% compared to the bare soil. Soil water evaporation decreased as the percentage of coverage for the fall/winter increased. However, the same decrease was not observed during spring/summer period. The appropriate amount and distribution of crop residue minimize soil water evaporation and promote soil water retention, which makes water available to plants over a longer period of time.
CONFLICT OF INTERESTS
The authors have not declared any conflict of interest.
REFERENCES
|
Alves Sobrinho T, Vitorino ACT, Souza LCF, Gonçalves MC, Carvalho DF (2003). Water infiltration in the soil under no tillage and conventional tillage systems. Rev. Bras. Eng. Agríc. Ambient. 7(2):191-196. |
|
|
Castro LG, Cogo NP, Volk LBS (2006).Alterations in soil surface roughness by tillage and rainfall in relation to water erosion. R. Bras. Ci. Solo 30(2):339-352. |
|
|
Dalmago GA, Bergamaschi H, Krüger CAMB, Bergonci JI, Comiran F, Heckler BMM (2010). Soil surface water evaporation under no‑tillage and conventional tillage systems.Pesq. Agropec. Bras. 45(8):780-790. |
|
|
Embrapa (2013). Sistema brasileiro de classificação de solos. 3th edition. Brasília: Centro Nacional Pesqui. Solos 353 p. |
|
|
Faria RT, Campeche FSM, Chibana EY (2006). Construction and calibration of high precision lysimeters.Rev. Bras. Eng. Agríc. Ambient. 10(1):237-242. |
|
|
Faria RT, Caramori PH, Chibana EY, Brito LRS (2003). CLIMA - Programa computacional para organização e análise de dados meteorológicos. Eng. Agríc. 23(2):372-387. |
|
|
Freitas PSL, Gava R, Faria RT, Rezende R, Vieira PVD (2014). Soil evaporation under different straw mulch fractions. Afr. J. Agric. Res. 9(23):1793-1800. |
|
|
Freitas PSL, Mantovani EC, Sediyama GC, Costa L (2004b). Effects of surface mulches from crop residues on the direct soil water evaporation. Acta Sci. Agron. 26(2):193-201. |
|
|
Freitas PSL, Mantovani EC, Sediyama GC, Costa LC (2004a). Influence of the corn crop residue on the soil water evaporation. Rev. Bras. Eng. Agríc. Ambient. 8(1):85-91. |
|
|
Heinemann AB, Stone LF, DidonetAD, Trindade MG, Soares BB, Moreira JAA, Cánovas AD (2006). Solar radiation use efficiency on the wheat grain yield as a function of nitrogen fertilizer. Rev. Bras. Eng. Agríc. Ambient. 10(2):352-356. |
|
|
IAPAR (2000). Cartas climáticas do Paraná: Edição ano 2000 - versão 1.0. Londrina: Instituto Agronômico do Paraná. CD-ROM. |
|
|
Lal R (2007). Constraints to adopting no-till farming in developing countries. Soil. Till. Res. 94(1):1-3. |
|
|
Lyra GB, Pereira AR, Sediyama GC, Lyra GB, Santiago AV, Folegatti MV (2004). Daily average of the saturation-vapor-pressure deficit of the air and its influence upon the reference evapotranspiration by penman-monteith model (FAO56) in Piracicaba, SP, Brazil. Eng. Agríc. 24(2):328-337. |
|
|
Mariano DC, Faria RT, Freitas PSL, Lena BP, Johann AL (2015). Construction and calibration of a bar weighing lysimeter. Acta Sci. Agron. 37(3):271-278. |
|
|
Ritchie JT (1972). Model to predicting evaporation from a row crop with incomplete cover. WaterResour.Res. 8(5):1204-1213. |
|
|
Silva FAM, Pinto HS, Scopel E, Corbeels M, Affholder F (2006). Water fluxes in maize, millet and soybean plant-residue mulches used in direct seeding. Pesqui. Agropecu. Bras. 41(5):717-724. |
|
|
Soares WR, Sediyama GC, Ribeiro A, Costa JMN (2001). Dependence of the crop coefficient in the initial stage of crop development (Kcini) upon irrigation depth and soil texture.Rev. Bras. Eng. Agríc. Ambient. 5(1):23-27. |
|
|
Souza KB, Pedrotti A, Resende SC, Santos HMT, Menezes MMG, Santos LAM (2008). Importância de novas espécies de plantas de cobertura do solo para os tabuleiros costeiros. Rev. FAPESE 4(2):131-140. |
|
|
Stone LF, Silveira PM, Moreira JAA, Braz AJBP (2006). Evapotranspiration of irrigated common bean under no-tillage on different cover crop mulches. Pesqui. Agropecu. Bras. 41(4):577-582. |
|
|
Torres JLR, Fabian AJ, Pereira MG, Andrioli I (2006). Influência de plantas de cobertura na temperatura e umidade do solo na rotação milho-soja em plantio direto. Rev. Bras. Agrociência. 12(1):107-113. |
|
|
Triplett Júnior GB, Dick WA (2008). No-tillage crop production: a revolution in agriculture. Agron. J. 100:153-165. |
|
|
Xie Z, Wang Y, Jiang W, Wei X (2006). Evaporation and evapotranspiration in a watermelon field mulched with gravel of different sizes in northwest China. Agric. Water Manage. 81(1):173-184. |
|
Copyright © 2024 Author(s) retain the copyright of this article.
This article is published under the terms of the Creative Commons Attribution License 4.0


