ABSTRACT
In the Brazilian semiarid regions, underground dams can efficiently store water under possible scenarios of climate change. However, the annual humidity vector in these regions is vertical, and annual evapotranspiration exceeds annual rainfall, resulting in the accumulation of salts in groundwater reservoirs. This study investigated over the course of two agricultural years the hydrologic behavior, soil moisture and the seasonal behavior of electrical conductivity (EC) of the irrigation water from an underground dam constructed in the Jacu watershed in a Brazilian semiarid region. The underground dam retained more soil moisture than other nearby areas during the rainy season; however, during dry periods, its storage capacity was reduced by evapotranspiration occurring inside and outside of the groundwater dam and after rainfall the same level of evaporation occurred from soil as from the dam. During the dry season the underground dam raised the concentration of salts in the irrigation water which was categorized as C4, corresponding to the far too saline irrigation water; however, in subsequent rainy seasons, the electrical conductivity of irrigation water decreased to be included in a group of low salinity of 0.95 dS m-1 (C1). The irrigation water sodicity changed from the risk of sodium accumulation to without sodium risk category.
Key words: Evapotranspiration, soil moisture, electrical conductivity, sustainability of semiarid.
Groundwater is the only available water resource in arid regions where surface water resources are scarce or even non-existent (Alley et al., 1999). Onder and Yilmax (2005) noted that in incoming decades sustainability of water resources would be a key issue and the dependence on groundwater would increase. Sand-storage dams are a successful water harvesting technology in Kenya and a promising solution to ensure water and food security in other semi-arid regions. Assessment of the suitability of sand-storage dams for other semi-arid regions requires both an understanding of the hydrological factors for the success of a single dam and the regional effects of a network of dams (Quilis et al., 2009). Moon et al. (2012) reported that six underground dams in alluvial aquifers were built to retain flood flows and thus to acquire additional water supply for many uses as drinking water and agricultural irrigation.
An underground or groundwater dam is a facility that stores groundwater in the pores of strata for sustainable use. Groundwater dams have many advantages, e.g., unlike a surface dam, land is not submerged to store water and there is no danger of breaching due to natural or manmade disasters. The surface area can be used in the same way as before after the construction of the dam. An underground dam allows for the development of water resources in regions where the construction of surface dams is difficult due to geological conditions, and where groundwater cannot be used in its current state (low water table, etc.). Underground dams are composed of a cut-off wall to dam the groundwater flow and prevent the intrusion of seawater, as well as facilities (wells, intake shaft, and pumps) that draw up the stored groundwater (Ishida et al., 2011).
An underground dam significantly changes the groundwater level and groundwater flow from natural conditions and this change influences the quality of groundwater. It is important to evaluate the impact of groundwater dam construction on groundwater quality. Soil salinity is a serious problem in arid and semiarid areas that can lead to significant levels of groundwater salinity, which can be further aggravated by direct evaporation when impoundment results in a shallow water table (Ishida et al., 2011).
Evapotranspiration (ET), the process by which water in its liquid state evaporates from soils and due to plants to the atmosphere, is an important hydrological process. Referring to agricultural production, measurement of evapotranspiration is essential for determining crop water demand (Bakhtiari et al., 2001). Over the entire land surface of the globe, rainfall averages around 750 mm year-1, of which about two thirds is returned to the atmosphere as evapotranspiration, making evapotranspiration the largest single component of the terrestrial hydrological cycle (Fisher et al., 2005), which is important to arid and semiarid regions.
The variability of evapotranspiration (ET) on shorter timescales is poorly constrained, but is critical for the coupled cycling of water, energy, and carbon in arid and semi-arid environments. In particular, the variability of evapotranspiration affects (1) the amount of precipitation partitioned into runoff and recharge; (2) how land-atmosphere interactions influence weather and climate; and (3) processes, such as plant productivity, soil respiration, and biogeochemical cycling. Considering the broad importance of evapotranspiration, ecosystem-level observations of evapotranspiration from semiarid environments are surprisingly limited. The limited field studies that have been completed in semiarid environments demonstrate that evapotranspiration varies greatly with time (Fernandez-Illescas et al., 2001).
Soil moisture is the key link between climate fluctuations and vegetation dynamics in space and time. Meteorological and vegetation conditions control evapotranspiration when soil moisture is not limiting, however, because precipitation is much less than potential evapotranspiration in arid and semiarid environments, evapotranspiration is believed to be limited by soil moisture most of the time in dry land ecosystems (Rodriguez-Iturbe, 2000). Unfortunately, field observations required to test these relationships are often lacking, particularly in arid and semiarid environments where limitations from soil moisture are believed to be the most important (Kurc and Small, 2004).
In water-limited ecosystems soil moisture and vegetation have a coupled relationship that is basic to ecosystem dynamics. The soil moisture plays a central role in the dynamic interaction between climate, soil, and vegetation and makes explicit the coupled dependence of water balance and water stress processes on soil moisture. Through transpiration, plants have an active role in soil water use that heavily conditions the water balance. The water balance, in turn, impacts plant growth, reproduction, and germination through the onset of water stress (Fernandez-Illescas et al., 2001).
Groundwater is a preferred source of water supply. Due to increasing population growth and a higher demand for potable water, the exploitation of groundwater resources is increasing (Verplanck et al., 2008), and it is estimated that approximately one third of the world’s population consumes groundwater (UNEP, 2000). For the majority of small rural communities, groundwater remains the only source of potable water (Sharma et al., 2012).
In the Brazilian semiarid region, rural watersheds are exploited only during the rainy season, when local residents engage in shifting cultivation, largely because there is no technological process that involves the planting of subsistence crops, such as “macassar” bean, corn, sorghum, cassava and others with very low aggregate economic value, and extensive ranching. A technological alternative to increase the availability of water in the semiarid region of ​​Northeast Brazil is the installation of underground dams, which can increase agricultural productivity of small and medium-sized farms, particularly the farms that lack the water required for conventional irrigation (Brito et al., 1999).
In arid regions, groundwater plays the critical economic role of facilitating rural subsistence farming, which is the basis of human survival; thus, groundwater enables human settlement and supports individual livelihoods (Giordano, 2006). However, groundwater may have a higher soluble salt content than surface water due to its slower flow and longer period of contact with mineral and sediment-rich rocks. Additionally, groundwater quality varies due to changes in the chemical composition of sediments composing and overlying the aquifers (Jameel, 2002). In this sense Burger and Celkova (2003) reported that processes in that groundwater is drawn by evapotranspiration, and soluble salts coagulate on the surface of soil particles and sodium ions are adsorbed into the soil colloidal system. The water motion processes are determined by hydro-physical characteristics and hydraulic parameters of the porous subsurface environment and by water flow from and to the groundwater level. These processes result in the emergence and expansion of saline and alkali soils. Salt accumulation is a phenomenon that is not unique to any particular soil type in many soil classifications, but it is typically associated with flow and quantity of water, especially Solonetz (alkaline) and Solonchak (salt enrichment upon evaporation) (Bui, 2013). It occurs where evaporation is high relative to precipitation due to seasonal water deficit and leaching is insufficient to move salts out of the soil. Ben-Gala et al. (2009) said that studies of the whole-plant or crop responses to salinity often focus on yield or growth reduction in terms of solution ion concentration or electrical conductivity.
García-Garizábal and Causape (2010) observed that the electric conductivity (EC) and nitrate concentration increased in irrigated areas of Spain in the medium Ebro River basin; however, simple irrigation management was able to decrease the salt and nitrate export by 20 and 24%, respectively, and hence improved water quality. In this sense, acid mine drainage (also sometimes referred to as acid rock drainage) is a well-understood process and arises primarily when the mineral pyrite (‘fool’s gold’ or iron disulphide) comes into contact with oxygenated water (McCarthy, 2011). This process that occurs in underground mining can decrease the water quality in the watersheds.
The Komesu underground dam is the first full-scale underground dam constructed to prevent saltwater intrusion in Japan. Although the cutoff wall of the dam effectively reduces the movement of saltwater into the reservoir area, saltwater masses remained behind the dam at the time of its completion, and saltwater can intrude beneath and diffuse through the wall, particularly when the reservoir level is below the sea level because of high pumping levels during the drought years. Therefore, it is necessary to estimate in advance whether the saltwater concentration in the pumped water is likely to exceed the permissible salinity level or not because of an increase in the residual saltwater mass as a result of saltwater intrusion and to take necessary measures to suitably manage the saltwater level behind the dam (Nawa and Miyazaki, 2009).
The objective of this study was to investigate over the course of two agricultural years, the hydrologic behavior, soil moisture and the seasonal behavior of the quality of irrigation water from an underground dam in the Jacu watershed in a Brazilian semiarid region.
Location and characterization of experimental area
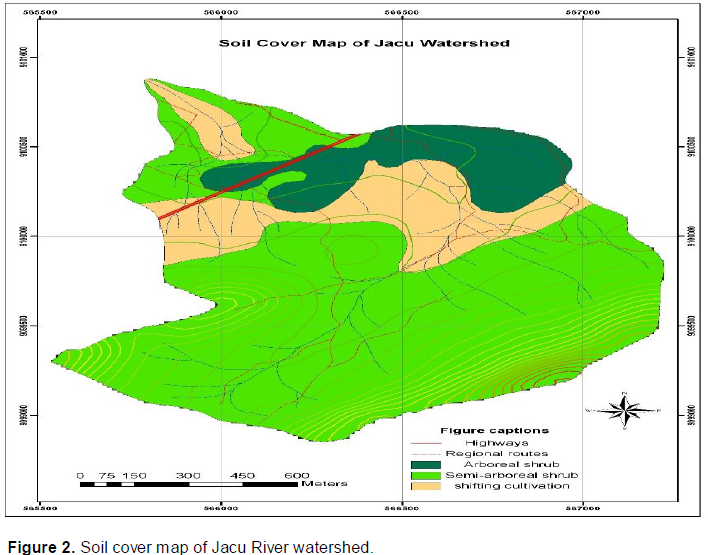
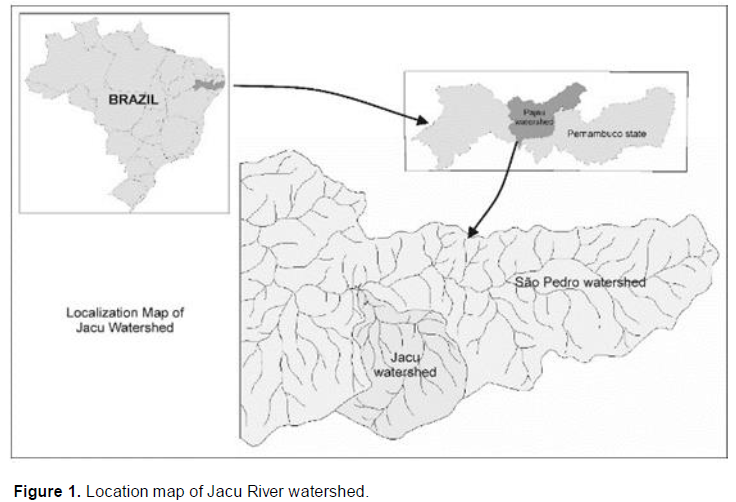
An experiment was conducted in a 2.1 km2 area watershed of the Jacu River, located in the upper Pajeu region, a semiarid environment in the Brazilian state of Pernambuco. This region, near the Serra of Lagartixa, is found in the municipal boundary between the cities of Serra Talhada and Floresta, with the geographical coordinates of 8°07'07" South latitude and 38°23'55" West longitude. The climate is categorized as type BWh by the Köppen classification system, as the environmental conditions are semiarid, hot and dry, with summer-autumn rains, an average annual rainfall of 647 mm year-1 between 1912 and 1991(SUDENE, 1990) and an annual temperature above 29°C. Entisols predominate in the region of ​​the semiarid watershed of the Jacu River, particularly in the area that includes the riverbed banks in the lower parts of the Watershed, in accordance with EMBRAPA (2006). In the Jacu watershed, 82.76% of the area is occupied by native hyperxerophilous shrub-arboreal and 17.24% by shifting cultivation. Figures 1 and 2 show the location and soil cover maps of Jacu watershed, respectively.
Installation of underground dam
The area for the installation of an underground dam was selected in August 2009 using a topographic survey conducted in accordance with Silva et al. 2007). This survey defined the best location for the placement of the dam’s components, that is, its catchment area, planting area and dam wall, given the morphology of the alluvial deposit. At the beginning of the experiment, the selected area contained remnants of dry matter that were left after the corn harvest.
For underground dam scaling, a trench perpendicular to the direction of the water flow was initially dug to an average depth of 1.90 m by excavating the trench with a mechanical backhoe until the impediment layer was reached. The stabilization of the dam wall was not required. A brick-and-mortar wall was constructed on the upstream side of the top part of the trench to standardize the slope cutoff and avoid perforation of the plastic by rock fragments, roots and other debris.
A 200 µm thick polyethylene tarp was fixed at both ends of the trench to create a functional dam, as the tarp formed a barrier that was impermeable to the subsurface water flow. Subsequently, the trench was closed with the aid of a backhoe, using the material excavated during the opening of the trench. This process left soil accumulation along the trench that covered the plastic tarp. At the time of dam construction, an existing well was used for the drainage of excess salts during high flows of the Jacu River by a water pump.
Water sample collection
To monitor water quality, a total of seven samples were collected in 500 mL containers over three years, with the first sample obtained from the well during the installation of the underground dam in December 2009. As the highest rainfall in 2010 occurred only during the month of October, the second and third samples were collected in January and December 2010. In the year 2011, which included a period when rainfall was more evenly distributed, samples were collected in March, April and May 2011. The final sampling was performed in February 2012.

The following parameters were assessed: Water pH (1:2.5); electrical conductivity; the concentrations of soluble calcium and magnesium ions, measured by atomic absorption spectro-photometry; the concentrations of sodium and potassium ions, measured by flame photometry; the concentrations of soluble carbonate and bicarbonate ions, measured by titration with 0.005 mol L-1 H2SO4; and the concentration of chloride ions, measured by titration with 0.1 mol L-1 AgNO3. The sodium adsorption ratio (SAR) values were also calculated in accordance with the method outlined by FAO (1999) and Richards (1954).
Soil sample collection
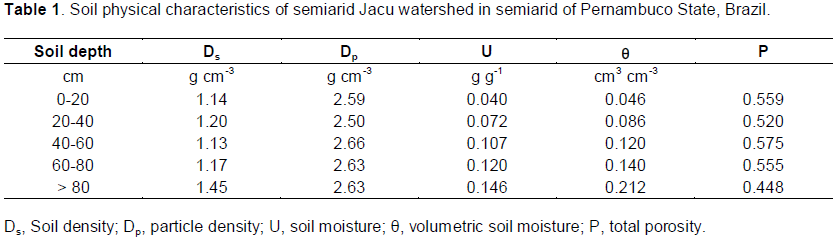
To monitor soil moisture, a total of 10 samplings at a soil depth (0-5 cm) were performed inside and outside of the dam one day after the rainfall. Each measurement was performed in triplicate. During the physical characterization of the soil (Table 1), the following parameters were determined: Soil density, assessed using the volumetric ring method; particle density, assessed using the volumetric flask method; particle size distribution, assessed using the densimeter method; moisture content, measured by mass and volume; and total porosity, calculated from the soil and particle density (EMBRAPA, 2006).
Hydrologic data
Rainfall (mm) and flow (m3 s-1) data were obtained using an automatic stage and a rain gage station linked with data logger, containing a level and flow sensor placed in the control section of the riverbed, and a pluviograph that recorded rainfall amounts and duration. The collected data in 10 minute time intervals were automatically recorded in a Data Logger (model SL2000MIM) of SOLAR Instrumentation, which was also part of the station and was powered by a photoelectric cell and a 12-volt auxiliary battery.
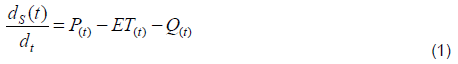
The water balance in the underground dam was used to calculate evapotranspiration considering the processes that affect the temporal dynamics of the water storage in the control volume S of dam (t):
Where ds/dt = is store water in time, P is the precipitation, ET is the evapotranspiration, and Q is the total runoff. Considering the equation 1 integrated over a 24 month time interval of the experiment, evapotranspiration was obtained by:
.

The evaporative fraction (EF), the water content in soil after rainfall, decreases in time and was calculated using the yield-density model:
Where EF (θ)t is the soil moisture at time t after the rain; Δθ is the difference between the water content observed on the first day following rainfall (θ1) and the water content observed at the end of interval without rainfall (θf); and a, b and c are the coefficients. The evaporative fraction (EF) was calculated for the inside and outside areas of the groundwater dam, and the time series between rainfall events varied from 30 to 107 days due to long dry periods. Other approaches have been used by Kurc and Small (2004) and Hunt et al. (2002) to calculate EF.
Statistical analysis
Regression analysis with a 95% confidence interval was used to determine the best fits between water quality, soil moisture and hydrologic parameters. The Curve Expert 1.5 professional software program was used to obtain the best regression models, based on the coefficient of determination and standard error.
Watershed hydrology: rainfall, soil moisture and evaporation
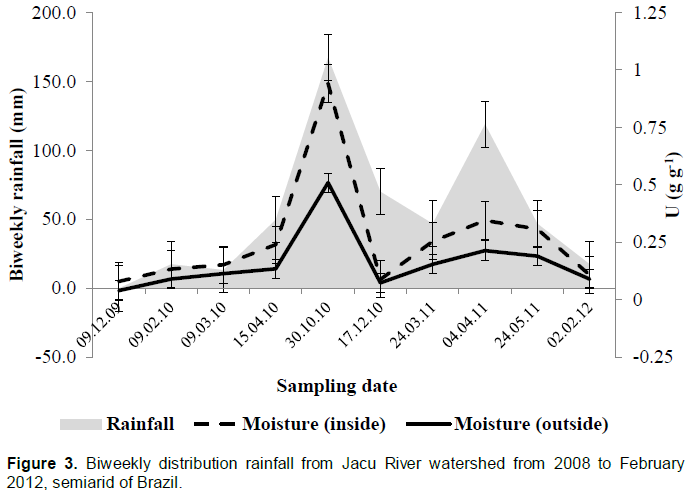
The distribution of rainfall in the watershed of the Jacu River between 2008 and February 2012 is depicted in Figure 3. It is evident that the semiarid region has a distinct hydrological rainfall pattern characterized by variability and intense rainfall, as rainfall volumes are concentrated into short periods of time (January to April 2008; February to May 2009; October 2010; and November and December 2011) with widely varying spatial and temporal occurrences of rainfall events (March 2008; May 2009 and October 2010); consequently, extreme surface and subsurface flows occur in October/December 2010 and March/April 2011, as shown in Figure 4, that illustrates the behavior of soil moisture from the groundwater dam from the inside and outside areas of the groundwater dam, that is, the regions adjacent to the dam in both the upstream and downstream directions. The standard error bars of this figure demonstrate that there are differences in soil moisture between these two areas in the time period of rainfall, which indicates that water storage in the control volume increased during this period; the water storage did not reduce because surface water did not flow fast from the dam area and did not cause water losses from the watershed that were observed in the area outside the dam.

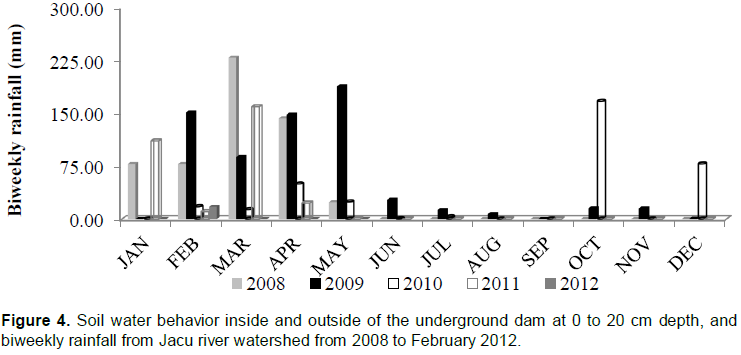
However, during the periods of no or low rainfall, there was less use of the retained moisture due to the occurrence of evapotranspiration, which acted similarly inside and outside of the dam. In other words, the occurrence of evapotranspiration in the dam during dry periods led to soil moisture losses, which reduced the efficiency of the underground dam. This result is consistent with the findings of Quilis et al. (2009), who reported losses to evaporation in underground dams, albeit smaller losses than were observed in the regions outside of the dams in question. According to the data presented in Figure 4, the time period of soil moisture retention in the groundwater dam of the Jacu River varied from two to six months.


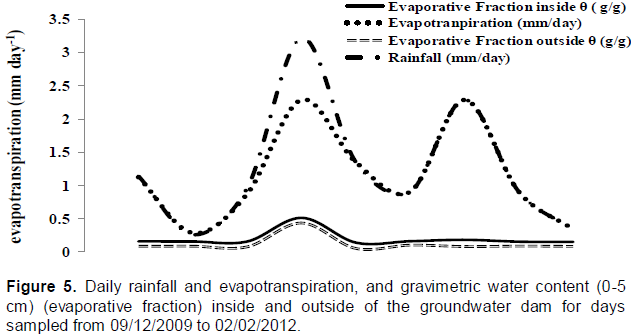
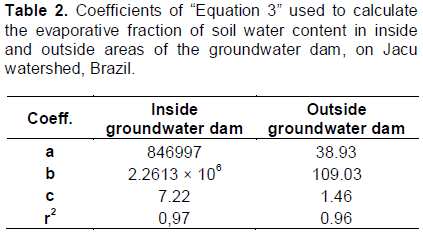
Figure 5 shows evapotranspiration rates obtained by water balance of the Jacu watershed and underground dam as well as evaporative fractions inside and outside of the dam. The coefficients of the yield-density function (Equation 3) for calculating the evaporative fraction of surface soil inside and outside of the underground dam in years 2010 and 2011 are shown in Table 2. Figure 5 shows that evapotranspiration values approached rainfall values, typical of water limited semiarid regions (Potter and Zhang, 2009; Sankarasubramanian and Vogel, 2002) which means the evapotranspiration ratio of Jacu watershed, that is, the ratio of mean annual evapotranspiration to mean annual precipitation (E/P) calculated was 0.99945, close to 1, and leaving the dryness index in Budyko’s curve to water-limited regions, confirming the local semiarid feature.
Evapotranspiration rates observed in the Jacu watershed, which has 82.76% of its area covered by shrub-arboreal and 17.24% of its area used for shifting cultivation, are of the same order of magnitude as those observed in other semi-arid areas of the world (Kurc and Small, 2004; Potter and Zhang, 2009; Sankarasubramanian and Voge, 2002; Zhang et al., 2008; Wang and Alimohammadi, 2012; Raz-Yaseef et al., 2012). The evapotranspiration occurred alike in the inside and outside areas of the underground dam, which had the same levels of evaporation from soil water content as validated by the close performance of the model to quantify the evaporative fraction (EF) inside and outside of the dam (Table 2).
The simultaneous evapotranspiration inside and outside of the underground dam and the same levels of evaporation from soil from both these areas after rainfall, mainly in dry period attest to the reduction in the efficiency of the underground dam in the Jacu watershed, which was able to maintain the soil moisture during four to six months, while the dry periods can last up to 10 months.
Quality of irrigation water
Relationships among salinity, soil moisture and flow of the Jacu watershed
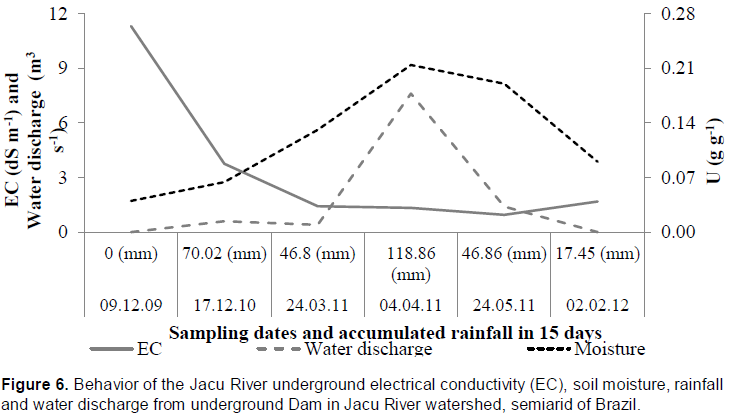
Figure 6 illustrates the behavior of the Jacu River groundwater electrical conductivity (EC) as a function of rainfall, which produced surface water and the resulting soil moisture values that were observed between September 2009 and February 2012. Initially, there was a peak in the electrical conductivity caused by the installation of the dam; however, the electrical conductivity began to decrease as the flow rate effectively increased, declining markedly in October 2010, when more intense rainfalls occurred, and subsequently remaining at these levels until the end of experimental observations. The flow levels were low from the time of installation of the dam until October 2010, after which they increased, first due to an extreme rainfall event and then due to the more regular rainfall in 2011, which also caused an increase in the soil moisture and a decrease in electrical conductivity (EC).
The observed electrical conductivity values in arid and semiarid regions, which are frequently between 1 and 5 dS m-1, but can be higher than 5 dS m-1 at times, are still satisfactory for livestock. The Australian standards recommend water salinity levels below 6.6 dS m-1 for cattle and 10 dS m-1 for sheep. These standards also establish a water salinity limit of 5.2 dS m-1 for other animal species (Ayers and Westcot, 1999), and also the pH values between 6.5 and 8.4 that were observed in this study were in accordance with established irrigation water quality guidelines.
The electrical conductivity of 11.30 dS m-1 observed in September 2009 (Figure 6 and Table 3) is categorized as C4 according to the classification diagram for irrigation water that was created by (FAO, 1999; Richards, 1954), as this EC is above 2.250 dS m-1.
The high electrical conductivity observed in 2009 was due to the installation of the dam, as the excavation, the mechanical disruption of the soil profile and the installation of the physical barrier that makes up the dam forced the translocation and concentration of water and salt from groundwater into the thalweg of the river, which is between the impediment layer of the septum bottom and the dam during the dry period. The observed salt concentration was also augmented by the natural conditions in the semiarid region, which include low rainfall that is surpassed in quantity by evapotranspiration and therefore favor salt accumulation in the soil profile and surface of the region (Hanson et al., 1993).
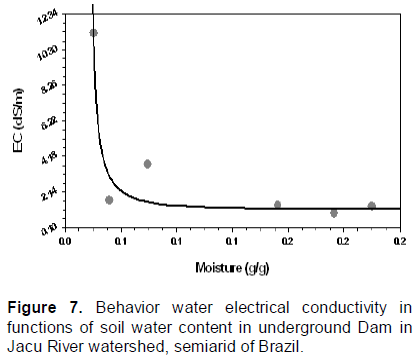
The levels of electrical conductivity were related to the soil moisture in accordance with the Hoerl regression model, which clearly predicts reductions in electrical conductivity when soil moisture levels increase as a function of flow rate increase (Figure 7). Sharma et al. (2012) evaluated water quality at 40 groundwater sites of Northeast India and found most of the groundwater samples fell in the field of C2S1 and C3S1 indicating medium to high salinity and low sodium water, which can be used for irrigation on almost all types of soil.
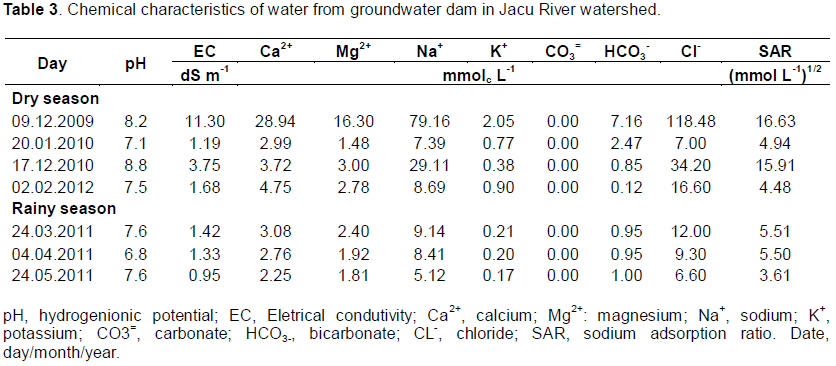
The assessment of the dam’s irrigation water, Table 3 shows the pH ranged from 6.5 to 8.4, considered adequate according to water quality guidelines for irrigation (Ayers and Westcot, 1999). These values are coherent with the values observed for carbonate ions. The values of pH higher than 8.4 indicate the presence of soluble carbonates, and Richards (1954) suggested that the presence of carbonate ions indicates pH higher than 8.5. The electrical conductivity (CE), analyzed before and after dam’s construction, respectively, ranged from 11.30 to 0.95 dS m-1.
Among the cations, sodium was the dominant ions, followed by calcium, magnesium and potassium in small proportions, whilst the dominant anion was the ions chloride. The dominant ions in irrigation water in the study region are sodium and chlorides. Leaching is the basic requirement tool for controlling the level of salts in root zones, chiefly because not only the sodium but also the chlorides in excess levels are toxic for animals and plants. Sodium saturation will replace calcium and magnesium ions on the clay surface, providing reduction in soil infiltration, surface crusting and reduced hydraulic conductivity. According Fernandes et al. (2009) the reason is its relatively large size, single electrical charge and hydration status. Excess ions levels (leading to toxicity) provoke morphological and physiological changes in the plants, due to high ionic concentration, especially sodium, that reduces the absorption of other nutrients. The sodium adsorption ratio (SAR) classified the water as S1 and S2, once that the values ranged from 3.61 to 16.63, respectively, according to the guidelines proposed by Richards (1954). In the period between 2009 and 2012, the water showed risk of sodicity, mainly for soils with high amount of clay particles and high cations exchange capacity.
Chloride toxicity and resulting sodium adsorption ratio (SAR) based classification of irrigation water
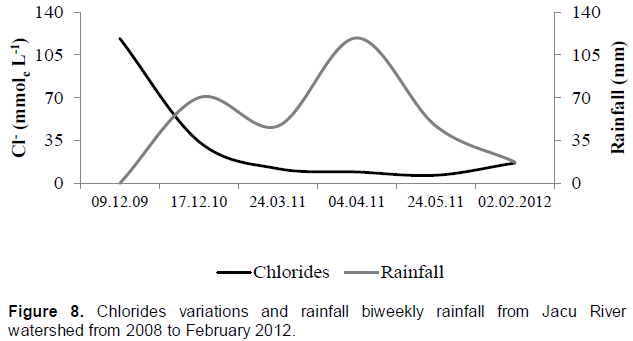
Concentrations of chloride in groundwater after the establishment of underground dam was 118.48 mmol L-1 and among 35.45 and 34.20 mmol L-1 during the dry season in 2009 and 2010, respectively (Figure 8). During the three rainy seasons observed in this study, there was a marked decrease in the chloride concentrations to 12.00, 9.30 and 6.60 mmol L-1. These results indicate a positive effect of rainfall on the dilution of chloride concentration. In the water samples collected in December 2009, December 2010, March 2011 and April 2011, the chloride concentration was above 7.05 mmol L-1, limit for human supply, which corresponds to 250 ppm Cl-. In contrast, the chloride concentration in the samples collected in May 2011 was 6.60 mmol L-1, which is below the threshold indicated by WHO. This decrease occurred because, starting in April 2011, rainfall provided increased soil moisture that increased the water volume of the dam, diluting the chloride that was present in the water and thereby reducing the chloride concentration.
Using the classification system proposed by Richards (1954), the irrigation water was categorized as either S1 or S2 because its SAR values ​​ranged from 3.61 to 16.63; these classification levels imply that between the years 2009 and 2012, the water would present a danger of sodicity in soils of fine texture and high cation-exchange capacity.
This danger was not observed in the water of the Entisol of the Jacu River, as the irrigation water from this source demonstrated a without-sodium risk (Table 3). Thus, the monitoring of the electrical conductivity (EC) and SAR of the water from the dam is essential for accurately assessing the risk that this water may pose with respect to increasing the salinity and the levels of exchangeable sodium in the soil.
The underground dam retains more soil moisture, surface water and subsurface water than other nearby areas during the rainy season; however, during the dry period, its efficiency may be reduced by evapotranspiration inside and outside of the underground dam area and the same level of evaporation from soil from both these areas after rainfall. During the dry season when the underground dam was built, salts were concentrated in the irrigation water due to the forced convergence of groundwater in the dam, and thus, the water was classified as C4, corresponding to the far too saline irrigation water; however, in the subsequent rainy seasons, the electrical conductivity (EC) of irrigation water decreased being included in a group of low salinity 0.95 dS m-1(C1). The construction of a underground dam in the Jacu River watershed does not present problems related to the sodicity of the irrigation water, which shifts from the S2 category (with risk of sodium accumulation) to the S1 category (without sodium risk) by the end of the evaluation period.
The authors have not declared any conflict of interests.
REFERENCES
|
Alley WM, Reily TE, Frank OL (1999). Sustainability of water resources. USGS. Geological survey circular 1186, Denver, Colorado.
View
|
|
|
|
Ayers RS, Westcot DWA (1999). Water quality in agriculture (A qualidade da água na agricultura). FAO, 29, Campina Grande, UFPB, Brazil.
|
|
|
|
|
Bakhtiari B, Ghahreman N, Liaghat AM, Hoogenboom G (2001). Evaluation of Reference Evapotranspiration Models for a Semiarid Environment Using Lysimeter Measurements. J. Agric. Sci. Technol. 13:223-237.
|
|
|
|
|
Ben-Gala A, Borochov-Neorib H, Yermiyahua U, Shanic U (2009). Is osmotic potential a more appropriate property than electrical conductivity for evaluating whole-plant response to salinity? Environ. Exp. Bot. 65:232-237.
Crossref
|
|
|
|
|
Brito LT, Cavalcanti N, Anjos NB, Rego MM (1999). The exploration of technological alternatives for increasing the availability of water in the semiarid region. Agriambi 3:111-115.
|
|
|
|
|
Bui EN (2013). Soil salinity: A neglected factor in plant ecology and biogeography. J. Arid Environ. 92:14-25.
Crossref
|
|
|
|
|
Burger F, Celkova A (2003). Salinity and sodicity hazard in water flow processes in the soil. Plant Soil Environ. 49:314-320.
|
|
|
|
|
EMBRAPA (2006). National Soil Research Center. The Brazilian system of soil classification. Brasilia, Brazil. 2nd ed. 306 p.
|
|
|
|
|
FAO (1999). Soil salinity Assessment. Methods and interpretations of electrical conductivity measurements. In: Rhoads, J.D.; Chanduvi, F.; Lesch, S. Roma, Food and Agriculture Organization, ONU. Irrig. Drain. Paper 57.
|
|
|
|
|
Fernandes JG, Freire MB, Cunha JC, Galvinicio JD, Correia MM, Santos PR (2009). Quality of the water for irrigation in the Irrigated Perimeter Cachoeira II in the municipality of Serra Talhada/PE. Agric. Sci. Braz. J. 1:27-34.
|
|
|
|
|
Fernandez-Illescas C, Porporato A, Laio F, Rodriguez-Iturbe I (2001). The ecohydrological role of soil texture in a water-limited system. Water Resour. Res. 37:2863-2872.
Crossref
|
|
|
|
|
Fisher JB, DeBiase TA, Ye QY, Xu M, Goldstein AH (2005). Evapotranspiration models compared on a Sierra Nevada forest ecosystem. Environ. Model. Software 20:783-796.
Crossref
|
|
|
|
|
García-Garizábal I, Causape J (2010). Influence of irrigation water management on the quantity and quality of irrigation return flows. J. Hydrol. 157:77-85.
Crossref
|
|
|
|
|
Giordano M (2006). Agricultural groundwater use and rural livelihoods in sub-Saharan Africa: A first-cut assessment. Hydrogeol. J. 14:310-318.
Crossref
|
|
|
|
|
Hanson B, Grattan SR, Fulton A (1993). Water management in University of California irrigation program, Agricultural salinity and drainage: A handbook for water managers. University of California.
|
|
|
|
|
Ishida S, Tsuchihara T, Yoshimoto S, Imaizumi M (2011). Sustainable use of groundwater with groundwater dams. JARQ 45:51-61.
Crossref
|
|
|
|
|
Jameel A (2002). Evaluation of drinking water quality in Thiruchirapalli. Indian J. Environ. Prot. 44:108-112.
|
|
|
|
|
Kurc SA, Small EE (2004). Dynamics of evapotranspiration in semiarid grassland and shrubland ecosystems during the summer monsoon season, central New Mexico. Water Resour. Res. 40:W09305.
Crossref
|
|
|
|
|
McCarthy TS (2011). The impact of acid mine drainage in South Africa. S. Afr. J. Sci. 107:5-6.
Crossref
|
|
|
|
|
Moon S, Lee JY, Lee BJ, Park K, Jo Y (2012). Quality of harvested rainwater in artificial recharge site on Jeju volcanic island, Korea. J. Hydrol. (414-415):268-277.
Crossref
|
|
|
|
|
Nawa N, Miyazak K (2009). The analysis of saltwater intrusion through Komesu underground dam and water quality management for salinity. Paddy Water Environ. 7:71-82.
Crossref
|
|
|
|
|
Onder H, Yilmax M (2005). A tool of sustainable development and management of groundwater resources. European Water 11:35-42.
|
|
|
|
|
Potter NJ, Zhang L (2009). Interannual variability of catchment water balance in Australia. J. Hydrol. 369:120-129.
Crossref
|
|
|
|
|
Quilis RO, Hoogmoed M, Erstsen M, Foppen JW, Hut R, Vries AD (2009). Measuring and modeling hydrological processes of sand-storage dams on different spatial scales. Phys. Chem. Earth 34:289-298.
Crossref
|
|
|
|
|
Raz-Yaseef N, Yakir D, Schiller G, Cohen S (2012). Dynamics of evapotranspiration partitioning in a semi-arid forest as affected by temporal rainfall patterns. Agric. For. Meteorol. 157:77-85.
Crossref
|
|
|
|
|
Richards LA (1954). Diagnosis and improvement of saline and alkaline soils. U. S. Dep. Agric. Handbook 60 U.S. Government Printing Office, Washington, D.C.
|
|
|
|
|
Rodriguez-Iturbe I (2000). Ecohydrology: A hydrologic perspective of climate-soil-vegetation dynamics. Water Resour. Res. 36:3-9.
Crossref
|
|
|
|
|
Sankarasubramanian A, Vogel RM (2002). Annual hydroclimatology of the United States. Water Resour. Res. 38:1083.
Crossref
|
|
|
|
|
Sharma P, Sarma HP, Mahanta CH (2012). Evaluation of groundwater quality with emphasis on fluoride concentration in Nalbari district, Assam, Northeast India. Environ. Earth Sci. 65:2147-2159.
Crossref
|
|
|
|
|
Silva MSL, Anjos JB, Ferreira GB, Mendonca CES, Santos JCP, Oliveira Neto MB (2007). The groundwater dam: an option for sustainable family farming in semiarid Brazil. Embrapa Solos 36 p.
|
|
|
|
|
SUDENE (1990). Characterization of the Brazilian semiarid.
View
|
|
|
|
|
UNEP (United Nations Environmental Program) (2000). Global Environment Outlook, 2000, Earthscan Publication Ltd., United Kingdom.
|
|
|
|
|
Verplanck PL, Mueller SH, Goldfarb RJ, Nordstrom DK, Youcha EK (2008). Geochemical controls of elevated arsenic concentrations in groundwater, Ester Dome, Fairbanks district, Alaska. Chem. Geol. 255:160-172.
Crossref
|
|
|
|
|
Wang D, Alimohammadi N (2012). Responses of annual runoff, evaporation, and storage change to climate variability at the watershed scale. Water Resour. Res. 48:5.
Crossref
|
|
|
|
|
Zhang L, Potter N, Hickel K, Zhang Y, Shao Q (2008). Water balance modeling over variable time scales based on the Budyko framework-Model development and testing. J. Hydrol. 360:117-113.
Crossref
|
|