Knowing plant traits and their contribution to genetic diversity is key to identify favorable genotypes and breed new cultivars. This article aims to describe and quantify the genetic divergence between soybean cultivars grown in the Cerrado in southwestern Piauí, Brazil, and identify favorable genotypes for hybridization. To do this, 13 soybean cultivars were grown in the region and assessed concerning vegetative and reproductive performance traits. Randomized block design was adopted, with four replications. Genetic divergence was determined by using the generalized Mahalanobis distance procedure, the Tocher’s optimization method, and the unweighted pair-group method with arithmetic mean (UPGMA). Under the conditions analyzed, the Tocher’s method and the UPGMA grouped the cultivars in a similar way. Genetic variability enabled the identification of dissimilar genotypes, and leaf area, thousand-seed weight, and pod length were the traits providing greater contribution. Hybridization between the cultivars Pampeana 10 RR x FT Campo Novo RR, BRS Sambaíba, M9350, M9144 RR, P99R03, or P99R09; between M8766 RR x Pampeana 20 RR, Pampeana 30 RR or P99R09; and between P99R09 x Pampeana 20 RR or Pampeana 30 RR showed to be favorable in order to obtain segregating populations with higher variability.
Soybean (Glycine max (L.) Merrill) stands out in the global agribusiness, due to the relevance of its products and the possibility of cultivation in various environments (Rocha et al., 2012). The significant growth of soybean production in Brazil is linked to advances related to the creation of cultivars adapted to different regions and the availability of new production technologies (Freitas, 2011) which enabled increasing the productivity and cultivation area, especially in low-latitude regions. On the world scene, Brazil stands out as the second largest soybean producer, with 99 million tons (t) for the 2015/16 harvest, behind only the United States (106.9 million tons) and
ahead of countries such as Argentina (56.5 million tons) and China (11.8 million tons), its main competitors (USDA, 2016). This is a plant species of great economic interest, because it occupies a prominent place in the food industry, due to its high content of protein (around 40%), for animal feed, and oil (around 20%), for human consumption (Paiva et al., 2006; Sá, 2006; Klahold et al., 2006), and it is also the main source of raw materials to produce biodiesel (Goldemberg et al., 2008).
According to Behling et al. (2009), improved cultivars with genes capable of expressing higher productivity, better adaptation, and great resistance or tolerance to adverse factors represent the most significant contribution to efficiency in the productive sector. Plant improvement is associated with the existence of genetic variability, genotype selection and adjustment to the environment, and progress depends on the ability to determine selection criteria to promote the desired changes (Reis et al., 2004). Genetic variability in soybean breeding programs, in order to enable the emergence of new combinations by broadening the genetic basis of this crop, is crucial to meet new demands, such as increasing yield and quality (Costa et al., 2004). Much of the genetic variability in this crop is preserved and kept in germplasm banks in many eastern and western countries. In Brazil, several studies have been conducted to verify the existence of genetic variability in this crop (Priolli et al., 2004; Almeida et al., 2011; Rigon et al., 2012; Val et al., 2014). To determine the genetic divergence of a population, a number of multivariate methods may be applied (Clemente; Cahoon, 2009), such as the Tocher’s optimization method, the hierarchical unweighted pair-group method with arithmetic mean (UPGMA), and dendrograms.
Knowing the genetic divergence between potential parents is important for hybridization purposes, as this enables the identification of genotypes that, when crossbred, provide greater heterotic effect on progeny, increasing chances to obtain better genotypes in yield and yield stability in segregating generations (Nunes et al., 2011). Addressing this, at a population level, involves agronomic and morphological variables and multivariate biometric techniques, gathering pieces of information from a set of traits. When this is undertaken through cluster analysis, potential parents are grouped according to classification criteria, so that there is homogeneity within the same group and heterogeneity between the various groups (Cruz et al., 2014). Knowing the interrelationship between plant traits has proven to be crucial, as it provides significant information for the selection process (Nogueira et al., 2012). The Cerrado in southwestern Piauí, Brazil, is a part of the last agricultural frontier in the country, named as “MAPITOBA” (on the border of the states of Maranhão, Piauí, Tocantins, and Bahia), and it has favorable conditions for producing grains (Freitas, 2011). However, there are rare scientific information and technical data on agronomic performance and adaptation of soybean cultivars in this region, as well as those concerning the identification of favorable genotypes to breed new cultivars adapted to local conditions. Thus, this article aims to describe and quantify the genetic divergence between soybean cultivars grown in the Cerrado in southwestern Piauí and identify favorable genotypes for hybridization.
Experimental location and climatic conditions
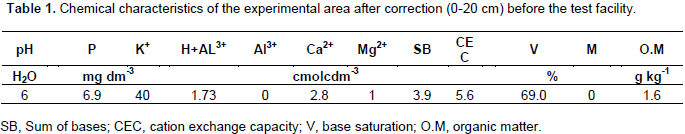
The experiment was conducted in 2014 and 2015 at São João Farm, in Serra do Pirajá, Currais, Piauí, Brazil. The municipality is located in the center-southern portion of the state, in the mesoregion “SudoestePiauiense” and the geographic microregion “Alto MédioGurgueia,” between the geographical coordinates 44° 18’ W and 45°05’ W longitude and 8’ 26’ S’ and 9’ 02” S latitude. It has an average annual temperature of 29°C and rainfall of 944.4 mm (IBGE, 2001) with a frequent occurrence of prolonged Indian summer weather (Andrade Júnior et al., 2009). The soil in the experimental area is classified as sandy. Its chemical features after correction is shown in Table 1.
Experimental establishment and management
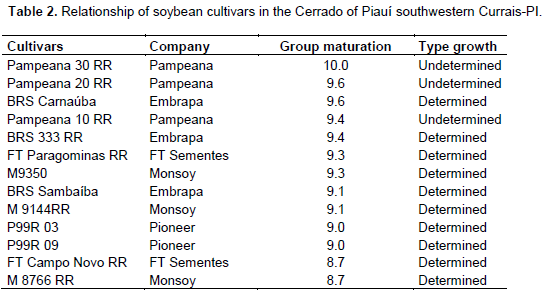
The experiment was carried out using randomized block design, with 13 treatments and 4 replications. The treatments were represented by the cultivars (Table 2). The experimental plots consisted of nine 5-m-long rows, spaced at 0.50 m. For data collection, the 2 peripheral rows and 0.50 m in the ends were disregarded, they were seen as borders. The total experimental area was 1.300 m2. Sowing was done manually on December 13, 2014. Fifteen days after emergence; plant thinning was carried out. Management and cultural practices during the cycle were uniformly conducted in all treatments, according to the guidelines for a soybean crop in Cerrado regions (Arantes and Souza, 1993).
Variables determined
In the phenological stage R6 (full grain) (Fehr and Caviness, 1977), there was an assessment, with 5 replications per plot, concerning these traits: plant height (PH) - shoot length from the ground level to the main stem apex; plant branching (PB) - quantifying the number of branches on the main stem; leaf area (LA) - determined with the aid of the equipment LI-3100 Area Meter (LI-COR, Inc. Lincoln, NE, USA); and shoot dry weight (SDW) - weighing the dry weight after drying in an oven, at 65°C, until reaching constant weight. After harvesting, done by hand in May, there was an assessment of: number of pods per plant (NPP) - quantifying the number of pods formed in the whole plant; average number of grains per pod (ANGP) - by counting; pod length (PL) - average length of 30 pods per plant; thousand seed weight (TSW) - following the methodology proposed by Brasil (2009); and productivity (PROD) – calculated through the average production in the plot converted into kg ha-1 (corrected for humidity of 13% L.H.).
Statistical analysis
Data underwent the normality test, as well as homogeneity and analysis of variance concerning all traits and subsequent grouping of average values according to the Scott-Knott test (Bhering et al., 2008); then, multivariate analysis of variance was conducted. Through the matrix of phenotypic mean values of the traits for each lineage and the matrix of residual variance-covariance, generalized Mahalanobis’ distances (D2ij) were calculated, as described by Cruz et al. (2014). The cluster analysis was performed by using the D2ij matrix between cultivars, resorting to the Tocher’s optimization method and the hierarchical UPGMA, and the identification of the relative contribution of each trait to genetic divergence was based on Singh’s criteria (Cruz et al., 2014). All analyses were processed through the software GENES (Cruz, 2008).
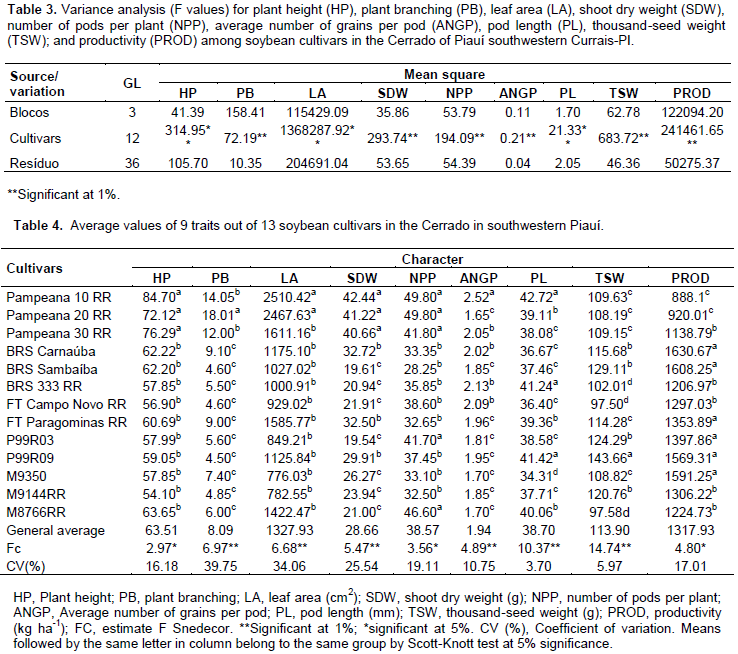
The summary of the analysis of variance for the nine traits assessed is shown in Table 3. The results demonstrate the existence of significant differences between the mean values of cultivars for all traits assessed through the F-test, suggesting the existence of genetic variability between populations. Regarding plant height, the cultivars were gathered into two groups, according to the Scott-Knott test (p ≤ 0.05) (Table 4). The highest average heights were observed in the cultivars Pampeana 10 RR (84.7 cm), Pampeana 30 RR (76.29 cm), and Pampeana 20 RR (72.12 cm), the others showed average values ranging from 54.10 cm (M9144 RR) to 63.65 cm (M8766 RR), not differing from each other. This result may be assigned to the type of crop growth, since the greatest height was observed in the Pampeana cultivar group that had indeterminate growth, while the others had determinate growth although, this may be influenced by crop management and weather factors.

According to Rocha et al. (2012), plant height is a critical trait in determining the cultivar variety to be introduced in a region, since it is related to grain yield, weed control and losses during mechanical harvesting. This trait is related with productivity and the operational efficiency of harvesters, where soybean is expected to achieve heights between 60.0 cm and 110.0 cm (Shigihara and Hamawaki, 2005). Thus, the three Pampeana cultivars, the BRS Carnauba and Sambaíba, FT Paragominas RR, and M8766 RR fit the desired height range. Taller plants may favor lodging, as they have thinner stems (Guimarães et al., 2008), which is a fact that was not observed in this experiment.
Observing the distribution of mean values for traits and their respective significances, a correlation structure was suggested between plant height and the group of variables shoot dry weight, leaf area and plant branches, since the cultivars Pampeana 10 RR, 20 RR, and 30 RR stood out, showing the highest overall average values when compared to the other cultivars concerning these traits (Table 4). Thus, it is assumed that they have the highest potential for growing plant shoots, a significant trait for the growth of the photosynthetic apparatus and vegetative structures. However, larger shoots are not always turned into higher productivity, thus attention and preference must be devoted to crops more efficient in converting photoassimilates to the reproductive organs (Gubiani, 2005). So, according to Sediyama et al. (1985), combining these cultivars with those showing higher contrast, the trait concerned might be convenient, in order to obtain segregating populations with the heterotic effect and enabling the selection of better genotypes.
As for the average number of pods per plant, the cultivars were also grouped into two contrasting groups through the Scott-Knott test, where the cultivars Pampeana 10 RR, 20 RR, and 30 RR, as well as the P99R03 and M8766 RR, showed the highest levels, ranging from 41.7 to 49.8 pods per plant. The other 8 cultivars were grouped to the number of pods, ranging from 28.25 (BRS Sambaíba) to 38.6 (FT Campo Novo RR) per plant. This trait is regarded as the main variable contributing to grain yield in legumes, as it is positively correlated with the production (Santos et al., 2015) the number of grains per pod may influence seed size, its weight, and could be of consequence to the crop yield. Four groups were formed by pod length, with the largest ranging from 41.24 mm (BRS 333 RR) to 42.72 mm (Pampeana 10 RR), and the smallest ones have 34.31 mm, observed in the M9350. The cultivar Pampeana 10 RR had the highest average number of grains per pod (2.52), followed by the group formed by Pampeana 30 RR, BRS Carnaúba, BRS 333 RR, and FT Campo Novo, which ranged from 2.02 to 2.13 grains per pod, and the group of the others, ranged from only 1.65 to 1.96 grains per pod.
Except for Pampeana 10 RR, all others showed grain yield below the average value reported by Santos et al. (2011), when studying the divergence between soybean genotypes grown in irrigated lowland (2.14), by Almeida et al. (2011) in soybean cultivars grown in the 2005 offseason, in southern Tocantins, Brazil (2.13). It is observed that only the cultivar Pampeana 10 RR showed consistency among the reproductive traits number of pods per plant, pod length, and average number of grains per pod, remaining in the group with the highest average values, something which may be due to the higher vegetative growth observed. Even so, it was not the cultivar showing the highest productivity. Four average value groups were established for thousand-seed weight. The cultivar P99R09 was better, with 143.66 g. The second group consisted of P99R03; M 9144 RR; BRS Sambaíba; and BRS Carnaúba. Group three consisted of the cultivars Pampeana 10 RR, 20 RR, and 30 RR; FT Paragominas RR; and M9350. And the cultivars BRS 333 RR; FT Campo Novo RR; and M8766 RR had the lowest average values for the trait, from 97.50 to 102.01 g. This trait is a determining factor for productivity, since it is related to grain yield and may be used to estimate whether there was good efficiency during the grain filling process, and it also expresses, indirectly, the size of these seeds and their physiological quality.
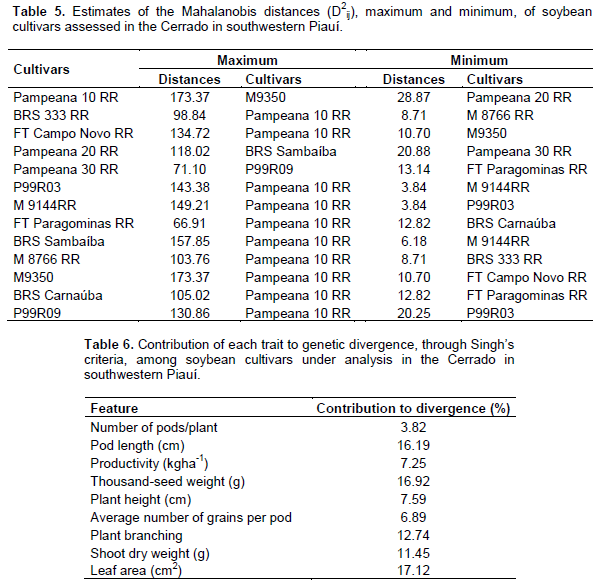
Regarding productivity, the formation of three contrasting groups is observed. The most productive consisted of P99R03; FT Paragominas RR; BRS Sambaíba; M9350; BRS Carnaúba; and P99R09, with productivity ranging from 1,353.89 to 1,630.67 kg ha-1. The second group had an average productivity from 1,138.79 to 1,306.22 kg ha-1 and the least productive group consisted of Pampeana 10 RR and Pampeana 20 RR, with 888.15 and 920.01 kg ha-1, respectively. The overall average productivity was 1,317.93 kg ha-1, it is below that observed by Rocha et al. (2012), that is, 2,670.30 kg ha-1, in 32 soybean genotypes under low latitude conditions, in Teresina, Piauí, Brazil. Productivity is a complex trait and its expression depends on other traits (Nogueira et al., 2012), including climatic factors. When studying populations, it provides a basis to select the most divergent and those with high productivity; it is among the traits prioritized for improvement (Rotili et al., 2012). Considering the multivariate effect, based on the maximum distance between cultivars, it was observed that the cultivar Pampeana 10 RR was the most divergent when compared to 10 cultivars, followed by the contrast between M9350 and Pampeana 10 RR, between BRS Sambaíba and Pampeana 20 RR, and between P99R09 and Pampeana 30 RR. Regarding the least divergent, the most similar pair was P99R03 and M9144 RR (Table 5). The relative contribution of each trait to genetic dissimilarity (Table 6), according to Singh’s criteria, shows that the leaf area (17.12%), thousand-seed weight (16.92%), and pod length (16.19%) were the traits that contributed most to genetic divergence, and they must be prioritized for parental selection in improvement programs. The smallest contribution was observed in the number of pods per plant, with 3.82% of the proportion in estimated variation.

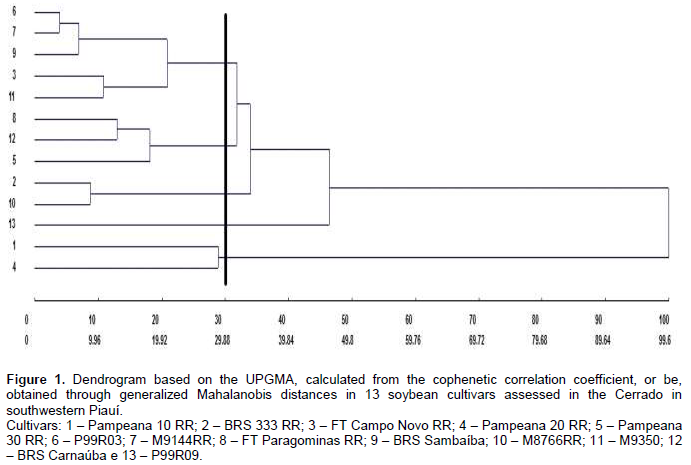
Productivity, in turn, contributed little to divergence (7.25%), suggesting genetic similarity among the genotypes for this trait and the need to obtain segregating populations to maintain improvement. The small relative contribution of productivity to genetic dissimilarity, in a study on genetic divergence, was also found by Dotto et al. (2010) with corn, Cabral et al. (2011) with beans, and Santos et al. (2011) with soybean. Genetic diversity between cultivars was found through the formation of contrasting groups by using the UPGMA, grouping in these types of graphs is performed subjectively, by selecting a threshold point on the distance scale (Fuzatto et al., 2002). In this study, the threshold level for grouping genotypes was defined as 70% similarity (Figure 1). The cultivars P99R03 and M9144RR were those with the shortest distance (D2 = 3.85), in turn, the longest distance from the other cultivars was assigned to Pampeana 10 RR and BRS 333 RR (D2 = 99.6), and 100% dissimilarity is considered for establishing the dendrogram.
These results may be used for hybridization purposes in breeding programs, because such information on these cultivars enable them to be used as sources to achieve better genetic bases.
Through this method, it was possible to observe the formation of two different groups. The first group consisted of the cultivars Pampeana 10 RR and 20 RR, a result which may have been influenced by the fact that these cultivars showed the highest values ​​for the leaf area (2,510.42 cm2 and 2,467.63 cm2, respectively) (Table 4), which was the most significant trait to distinguish cultivars (Table 6); the second group consisted of the cultivar P99R09, which had the highest average value for the trait thousand-seed weight; the third group was formed by the cultivars BRS 333 RR and M8766 RR; the fourth group consisted of the cultivars Pampeana 30 RR, BRS Carnaúba, and FT Paragominas RR; and the fifth group was formed by the other cultivars. The Tocher’s optimization technique distinguished the cultivars into 5 groups contrasting with each other (Table 7). The first group consisted of the cultivars P99R03, M 9144 RR, BRS Sambaíba, M9350, BRS Carnaúba, FT Campo Novo RR, FT Paragominas RR, and BRS 333 RR, representing around 61% of the cultivars under analysis. The second group consisted of 2 cultivars (Pampeana 20 RR and Pampeana 30 RR). Groups III, IV, and V consisted of only 1 cultivar each: Pampeana 10 RR, M 8766 RR, and P99R09, respectively.
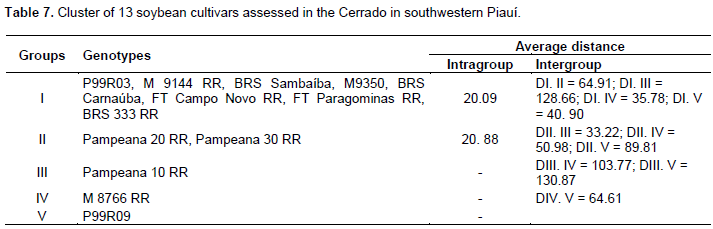
According to Peluzio et al. (2014), the formation of groups is of great importance for parental selection, because the new hybrid combinations to be formed must be based on the magnitude of their dissimilarity and parental potential. By relating the Tocher’s optimization method and the UPGMA, there was a concordance between them, and 5 groups show a similar constitution. The most dissimilar soybean cultivars are combined in rather distant groups; they may be regarded as favorable in artificial crossbreeding (Oliveira et al., 2005). However, in addition to dissimilarity, it is necessary that the parents correlate high average values for the other desired agronomic traits (Nunes et al., 2011; Peluzio et al., 2014). Thus, the distance between the cultivar Pampeana 10 RR and the others suggests that it may have a high heterotic effect after crossbreeding with another plant variety. As reported by Asmus (2008), the best hybrid combinations to be tested in an improvement program must involve divergent parents with a high performance. Thus, considering the group of cultivars under analysis, in principle, the first intersection recommended is between the cultivars Pampeana 10 RR x M9350, since the greatest Mahalanobis distance was found between them, also we also observe its allocation in various groups by using the Tocher’s method (Table 7) and the UPGMA (Figure 1).
The cultivar Pampeana 10 RR may be crossbred with the cultivar M8766 RR, belonging to group IV, due to the magnitude of the Mahalanobis distance (Table 5). Given the magnitude of the Mahalanobis distances (Table 5), the cultivar Pampeana 10 RR may also be crossbred with the cultivars M9350, BRS Sambaíba, M9144 RR, and P99R03, which, in turn, belong to group I, formed by the Tocher’s method. These cultivars have lower pod number and length, plant height, average number of grains per pod and branches, dry weight of shoots and leaf area when compared to the cultivar Pampeana 10 RR, but they are more productive, especially the cultivars BRS Sambaíba and P99R03 (Table 4). According to Cruz et al. (2014), the establishment of groups with homogeneous genotypes within and heterogeneous between the groups is the starting point for a careful evaluation of them, aiming at their use in improvement programs. Indeed, the identification of better genotypes was effective, for each trait under analysis, as well as the identification and recommendation of the favorable crossbreeding between cultivars. In this way, the following hybridizations are predicted as favorable: Pampeana 10 RR x FT Campo Novo RR; Pampeana 10 RR x P99R03; Pampeana 10 RR x M9144 RR; Pampeana 10 RR x BRS Sambaíba; Pampeana 10 RR x M9350; Pampeana 10 RR x P99R09; M8766 RR x Pampeana 20 RR; M8766 RR x Pampeana 30 RR; M8766 RR x P99R09; P99R09 x Pampeana 20 RR; and P99R09 x Pampeana 30 RR.
1. There was a partial concordance regarding the formation of groups with similarity in their constitution through the parental optimization method provided by Tocher and the UPGMA.
2. The traits that most contributed to the divergence were leaf area (17.12%), thousand-seed weight (16.92%), and pod length (16.19%).
3. Genetic variability enabled the identification of dissimilar cultivars and those with high average values for the traits under analysis.
4. The hybridizations Pampeana 10 RR x FT Campo Novo RR; Pampeana 10 RR x P99R03; Pampeana 10 RR x M9144 RR; Pampeana 10 RR x BRS Sambaíba; Pampeana 10 RR x M9350; Pampeana 10 RR x P99R09;
M8766 RR x Pampeana 20 RR; M8766 RR x Pampeana 30 RR; M8766 RR x P99R09; P99R09 x Pampeana 20 RR; and P99R09 x Pampeana 30 RR are favorable to obtain segregating populations with higher variability.