Twenty maize genotypes (19 inbred lines and a commercial hybrid) were studied assessing the extent of genetic diversity for 21 qualitative and quantitative morpho-metric traits and 18 expressed sequence tags-simple sequence repeats (EST-SSR) markers. A wide range of variation was observed among the 20 maize genotypes for quantitative traits predominantly for plant height, ear height, days to tasseling, days to silking, and kernel yield per plant. Among the qualitative traits, green-glume base, green inter-node, conico-cylindrical, flint grain texture, and white stone type were found predominant. The 18 primer pairs produced 92 different markers with polymorphism information content (PIC) value ranging from 0 to 0.87. Three different dendrograms based upon the dis/similarity coefficients were constructed. Poor and no correlations were observed among the sets of dendrograms patterns depicted from qualitative and quantitative traits and molecular markers. However, wide variation among genotypes of different clusters and within clusters was observed for different methods of clustering. It was concluded that the selection of suitable clustering system of genotypes should be determined by the purpose of clustering.
Among cereals, maize (Zea mays L., 2n = 2x = 20) with the highest average yield per hectare ranks third after wheat and rice in total area and production in the world (FAOSTAT, 2012). Being a cheap source of nutrition, it is used as staple food, livestock feed/forage, and industrial raw material in developing countries. Increased utilisation as poultry feed and its potential use as a forage and biofuel source makes it an important cereal crop for the future. Bearing the C4 physiological pathway and depicting a wide range of genetic variability and wider adaptability, maize is grown in most parts of the world up to 3000 m above sea level (masl) (Dowswell et al., 1996).
The existence of adequate genetic variability in populations is crucial for the success of maize improvement programmes. Although, serious threats to maize diversity for over a half century have been suggested around its centres of origin (Dyer et al., 2014), the maize breeders do not only preserved, but created more useable genetic diversity at various research centres in the world. It is now well recognised that better understanding of existing genetic diversity helps in developing heterotic pools for breeding superior hybrids and composites and line development (Ranatunga et al., 2009). The high level of heterosis can be exploited in new hybrids when parents are genetically diverse belonging to contrasting pools than closely related groups (Mungoma and Pollack, 1988).
The assessment of genetic diversity among genotypes based on morphological data may not reliably portray the exact genetic relationships due to environmental interactions (Voichita et al., 2011). Therefore, molecular markers have been used along with phenotypic traits in assessing the genetic diversity. In maize, various types of molecular markers have been used to investigate relationships among inbred lines from different heterotic groups (Melchinger et al., 1991; Lubberstedt et al., 2000; Pop et al., 2010).
Inbred lines in maize represent the basic resource in maize improvement since 1908 when Shull (1908) and East (1908) showed that the loss of vigour of inbred lines was completely restored with higher yield of hybrids than the varieties from which inbred lines were derived. The limitation of poor seed production from inbred lines was overcome by producing double cross hybrids (Jones, 1918, 1922) and eventually by developing improved inbred lines to produce single cross hybrids since 1960s. However, the use of maize inbreds is not only restricted to hybrid maize production (Anderson and Brown, 1952), but they are critical for various types of genetic studies including quantitative trait locus mapping (Austin et al., 2001), development of linkage maps (Burr et al., 1988), molecular evolution (Henry and Damerval, 1997), physiological studies (Crosbie et al., 1978) and in studying the molecular genetic diversity (Kejun et al., 2003).
A meaningful exploitation of maize inbred lines for genetic analysis requires a detailed knowledge of genetic relationship and an understanding of genetic diversity among them. Therefore, utilization of molecular markers that directly evaluate genetic differences between inbred lines along with morphological traits will give a better way to group the inbreds and to understand their heterotic relationships. The ultimate exploitation of genetic diversity among inbred lines is expected to boost maize production particularly in the poor yielding state of Jharkhand, India. Therefore, in the present study, an attempt was made to assess the extent of genetic diversity available among a set of maize inbred lines maintained at Birsa Agricultural University using qualitative and quantitative traits, and through DNA based expressed sequence tags-simple sequence repeats (EST-SSR) markers.
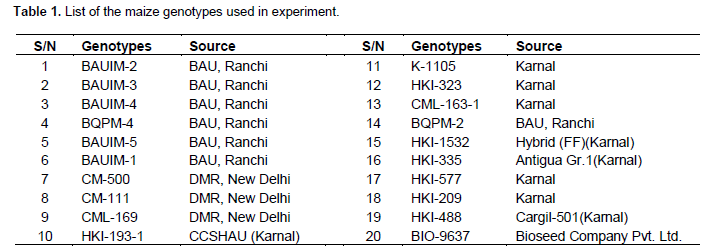
A total of 20 maize genotypes (19 inbred lines and one commercial hybrid, that is, BIO-9637) were selected (Table 1) from a large collection of various sources being maintained at the Birsa Agricultural University (BAU), Ranchi, Jharkhand. The six BAUIM series inbred lines were developed at BAU through continuous inbreeding from 2005 onward. The other inbred lines were from Directorate of Maize Development, New Delhi and Haryana Agricultural University that being maintained at BAU for use in the hybrid breeding programme.
Observations taken
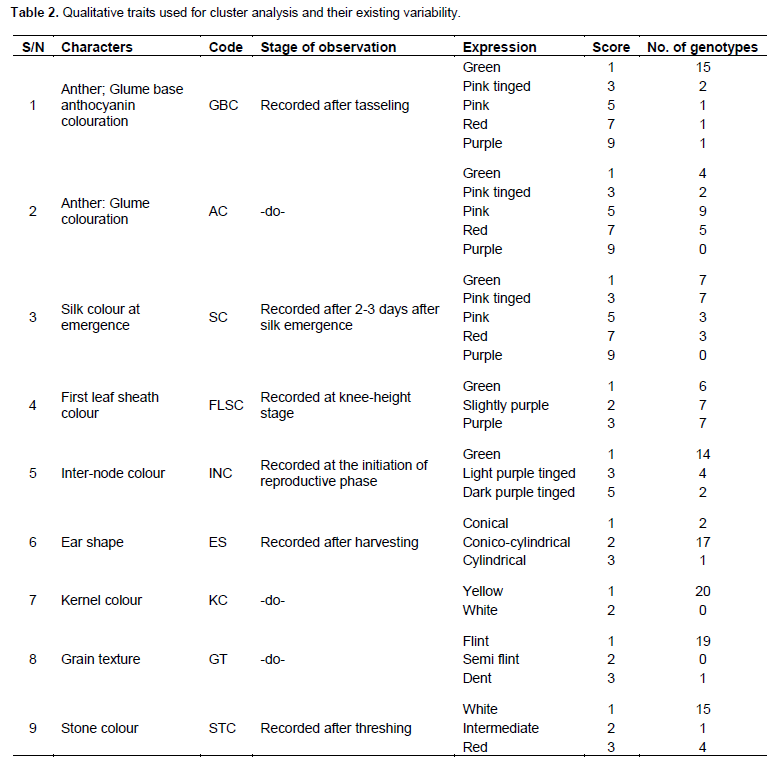
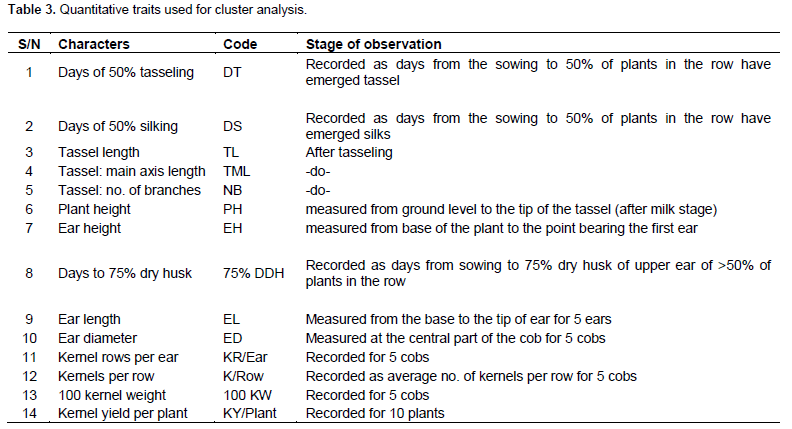
The 20 maize genotypes were grown for evaluation in the research field of Plant Breeding and Genetics Department of BAU, Jharkhand in a randomized complete block design (RCBD) with three replications. Each entry was planted in 2 rows of 4 m in length. The plant to plant spacing within rows was maintained at 20 and 70 cm between rows. All the recommended package of practices was followed to obtain normal growth of the crop. All the 20 genotypes were observed for three different observation/marker systems (9 qualitative traits, 14 quantitative traits from 10 randomly selected plants from each replication as per the reference from UPOV standards (Geneva) with some modifications and DNA markers from 18 SSR primers) (Tables 2 and 3).
DNA marker analysis
DNA isolation, quality and quantity check
Fresh green leaf samples for DNA isolation were collected from each genotype and the extraction and purification of the genomic DNA from each accession was carried out following the CTAB method with minor modifications. DNA quality and quantity of each genotype was assessed by electrophoresing the DNA in 0.8% agarose gel (Sigma A9539) with known standards. All the DNA samples were uniformly diluted to have a final concentration of 10 ng/μl.
SSR analysis
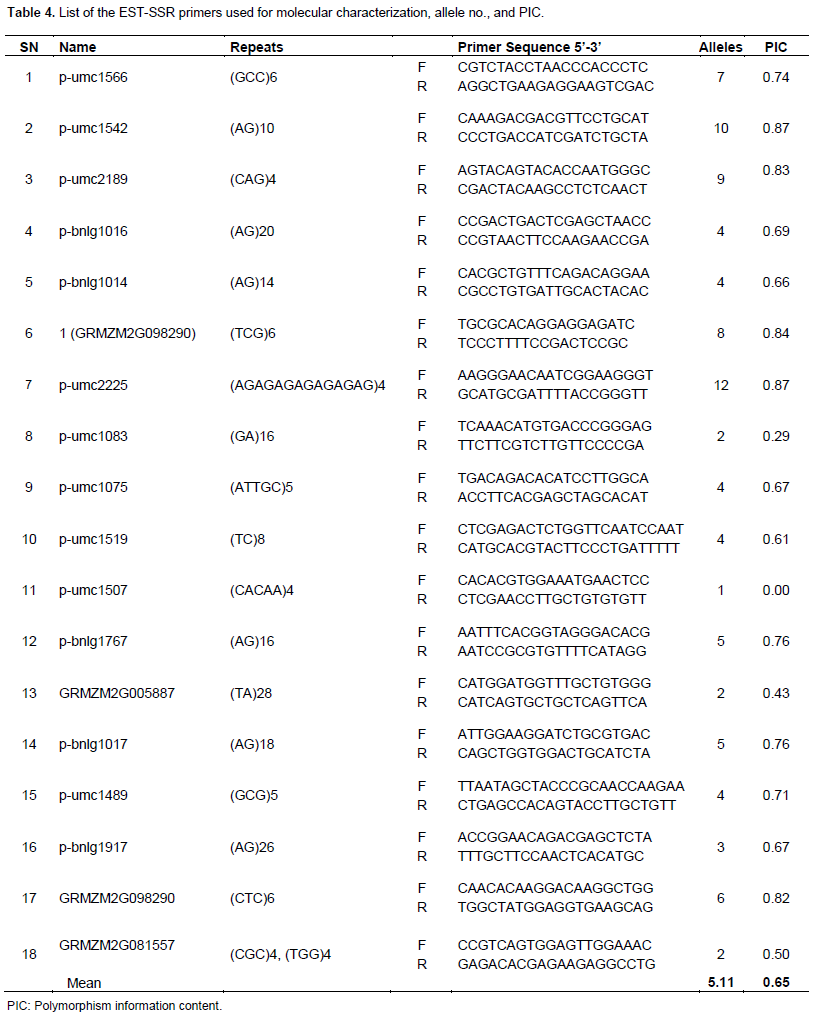
A total of 18 EST-SSR primer pairs, designed using Primer-3 according to the sequences conferring for several drought related traits available on Maize GDB (Maize Genetics and Genomics Database, www.maizegdb.org/ssr.php) and GRAMENE, from SIGMA Aldrich Inc. were used for PCR amplification of repeat sequences from the genomic DNA of each sample. The primer pairs used are shown in Table 4. PCR reactions were performed using programmable thermal cycler from 10 μl volume containing 1 μl DNA, 0.10 μl (50 pmole/μl of each primer, 1 μl (10x) PCR buffer, 0.80 μl (10 mM) dNTPs, 0.5 μl (1 U/μl) Taq polymerase and 6.5 μl sterile water. Amplifications were done under conditions of 94°C for 4 min followed by 35 cycles of 94°C for 30 s, 40°C for 30 s, 72°C for 30 s and final extension at 72°C for 4 min. PCR products were electrophoresed in 2% agarose gel at constant power (90 Volts) for 3 to 4 h using Gen-X gel apparatus.
Scoring and data analysis
Qualitative multistate traits that depict ordinal scale of data were converted into binary characters (Sneath and Sokal, 1973) based on the variations present in each trait. The presence and absence of phenotypes were given the score of ‘1’ and ‘0’, respectively. The quantitative data recorded on different traits were transformed to standardised Z-scores with zero mean and a unit standard deviation or variance using MS-EXCEL. Only clear and unambiguous bands of SSR markers were scored. Markers were scored for the presence and absence of the corresponding band among the genotypes. The scores ‘1’ and ‘0’ were assigned for the presence and absence of bands, respectively. The three sets of data gathered (qualitative traits, quantitative traits, and SSR markers) were subjected to cluster analysis based on similarity coefficient values. Sequential Agglomerative Hierarchical Non-overlapping (SAHN) clustering was performed on three similarity coefficient matrices obtained from observations on three different marker systems utilizing the Unweighted Pair Group Method with Arithmetic Averages (UPGMA) to prepare dendrograms. The correspondence between the qualitative traits, quantitative traits, and SSR based similarity coefficient matrices were tested for their correlation in clustering patterns using the Matrix Comparison Plot procedure (Mantel’s Test, 1967). A scatter plot was produced taking a pair of matrices on axes and third matrix as residual effect. Data analysis was done using NTSYSpc version 2.02i (Rohlf, 1998).
Polymorphism information content (PIC)
PIC values or expected heterozygosity scores for SSR (polyallelic) markers were calculated in MS-EXCEL using the formula:
Hj = 1 – Σp2i,
where pi is the frequency for the i-th allele (Nei, 1973).
Polymorphism analysis
Categorisation of experimental materials for qualitative traits was made as shown in Table 2. The majority of genotypes possessed green glume base, green inter-node, conico-cylindrical ear shape, flint grain texture, and white stone. There were fewer genotypes under scoring categories of other traits. In general, wide variation was observed among the genotypes as was also observed by Ranatunga et al. (2009).
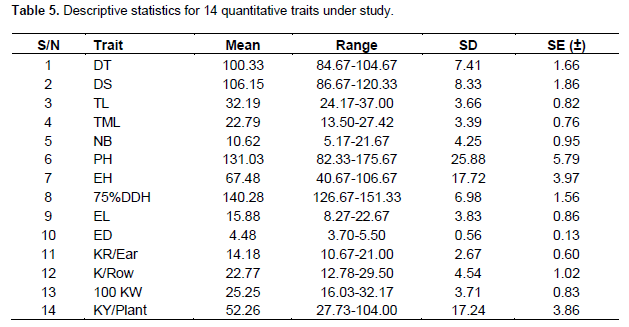
The mean, range, standard deviation, and standard error (SE) of mean for each of the 14 quantitative traits observed are given in Table 5. Among the 14 traits, wider range of variation was observed across the 20 different maize genotypes for plant height (PH), ear height (EH), days to tasseling (DT), days to silking (DS) and kernel yield per plant (KY/Plant) with standard deviation of 25.88, 17.72, 7.41, 8.33, and 17.24, respectively. The existing range of these traits indicated possibilities for grouping the maize genotypes into various groups of poor performers and good performers. Better understanding of the influence of environment on these quantitative traits would help in grouping these genotypes with better accuracy (Ranatunga et al., 2009). Yadav and Singh, (2010) also reported that the traits tassel branching, plant height, kernels/row, ear height, ear length, and ear width are important in discriminating the inbred lines. Azad et al. (2012) recognized greater contribution of plant height, ear length, ear diameter, number of grains/ear, thousand kernels weight, and kernel yield/plant to the existing variability among 30 inbred lines.
All the primer pairs were found to be multi loci except UMC-1507 and the number of alleles per locus in the lines ranged from 1 to 12 with an average of 5.11 for a total of 92 alleles. The average number of alleles per locus was in accordance to Morales et al. (2010), who used 21 SSR primers in heterotic maize populations and reported an average of 5.14 and Saavedra et al. (2013) who obtained an average of 4.81 from 11 SSR primers. The PIC value for the primer pairs ranged from 0.00 to 0.87 with an average of 0.65 (Table 4). Seventy seven percent primers had PIC value greater than 0.50 and 50% greater than 0.70. These results suggest that the genotypes were holding a substantial amount of polymorphism at DNA level. These values are similar to those reported by other researchers. Shiri (2011) obtained average PIC value of 0.53 for 40 SSR primers having a range from 0.23 to 0.79 and Karen et al. (2013) reported average PIC value of 0.68 with a range of 0.23 to 0.82.
Cluster analysis and dendrograms
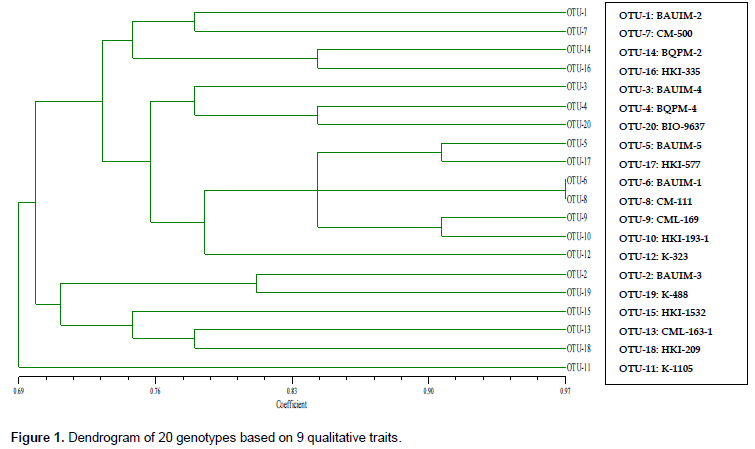
Dendrograms constructed from the dis/similarity coefficients (table not given) based on three types of observations on qualitative, quantitative, and molecular markers revealed the existence of considerable amount of distances across the genotypes. Cluster analysis using nine qualitative traits resulted in grouping of genotypes into three major clusters of 14, 5 and 1 (K-1105) genotype/s (Figure 1). The similarity coefficient ranged between 0.69 and 0.97. The pair of maize genotypes BAUIM-1 and CM-111 in cluster-I was almost genetically similar with a similarity coefficient of 0.97 but exhibiting considerable variation from others. Inbred CML-163-1 was found to be most diverse from inbreds BAUIM-4, BQPM-4, CM-500, and K-1105 having similarity coefficient less than 0.60 (table not given). Similarly, BQPM-4 was also different from BAUIM-3 and K-488 with similarity index of 0.56 and 0.59, respectively (Figure 1).
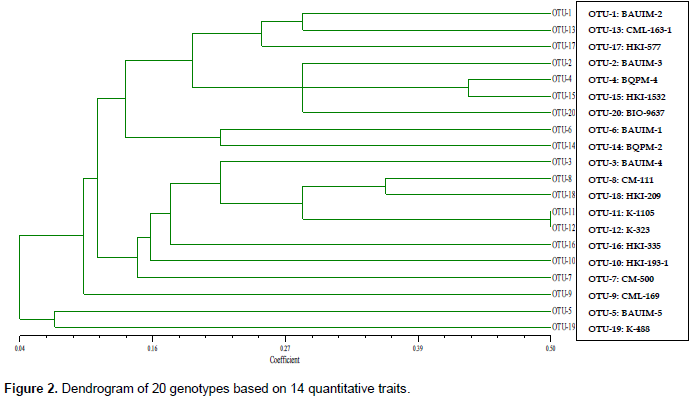
The dendrogram constructed on quantitative traits comprised four major clusters: cluster-I with 9 genotypes, cluster-II with 8 genotypes, cluster-III with 1 genotype (CML-169), and the cluster-IV with 2 genotypes (BAUIM-5 and K-488) (Figure 2). The similarity coefficient ranged from 0.04 to 0.50, showing a poor similarity between the genotypes among and between the clusters. This clustering was distinctly different from that based on other two methods using quantitative traits and SSR markers. BAUIM-5 and K-488 (under same cluster) had a similarity coefficient of almost zero value. These inbreds were the most distinct from other inbred lines. Similarly, inbreds BAUIM-4, CML-169 and HKI-209 (under same cluster) with very low similarity coefficient were also distinctly differing from other inbreds such as BAUIM-5, BQPM-2, HKI-577, and K-488 belonging to different clusters.
Clustering pattern of 20 genotypes based on EST-SSR markers (Figure 3) revealed that the genotypes were differing among themselves with similarity coefficients ranging from 0.60 to 0.77. Out of 20 genotypes, 9 genotypes were under cluster-I and one genotype (BAUIM-5) in cluster-II but linked with cluster-III, which included the rest 10 genotypes. Genotypes HKI-488 and BIO-9637 were found almost genetically similar with similarity coefficient of 0.77 under the cluster-III. Inbreds BQPM-4 and CML-163-1 were found to be most diverse with similarity coefficient 0.49. Based on the similarity coefficient between paired inbreds, CML-163-1 and K-488 were found to be the most distinct from other inbreds and themselves too.
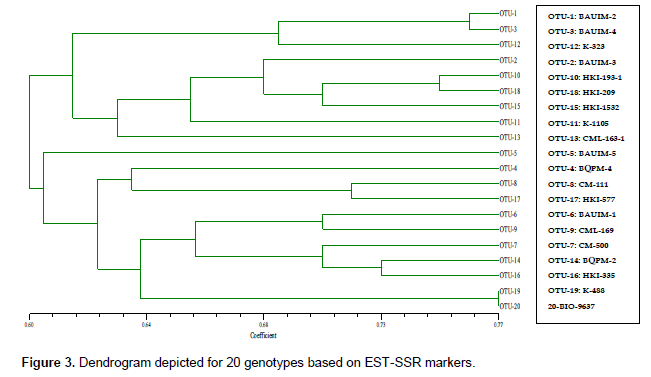
The clustering pattern derived from qualitative traits was the most distinct with many sub-clusters. The dendrogram constructed from molecular data revealed that the genotypes were more alike, which is evident from the higher similarity coefficient value. The dendrogram based on quantitative traits showed that the genotypes were much diverse based on their performance and was not in accordance with the other methods of clustering. Thus, under the study of morphometric traits and SSR markers genotyped for 20 maize genotypes used in the present study were clearly differentiated from one another. In the previous studies of Ranatunga et al. (2009), Ben-Har et al. (1995) and Smith et al. (1997) found no correlation in the clustering patterns from different methods and Yadav and Singh, (2010) also reported little agreement among the different methods of cluster analysis.
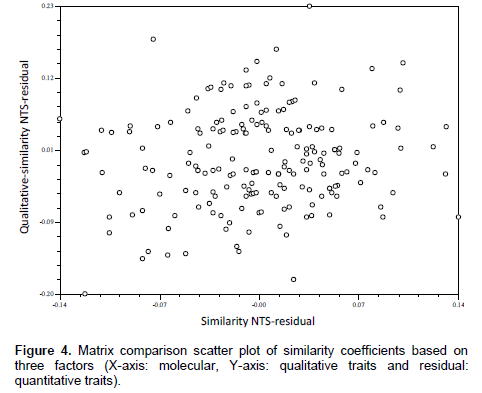
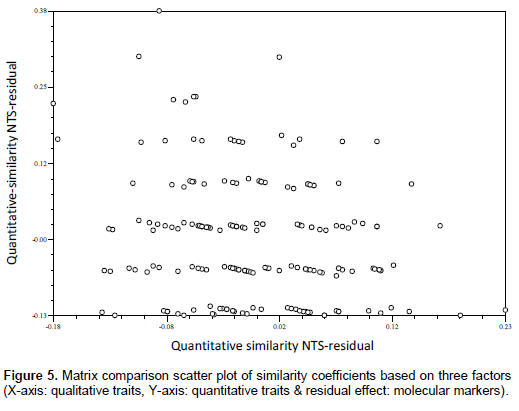
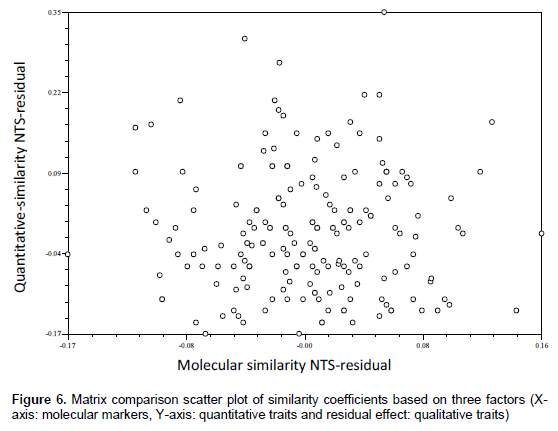
The comparison of matrices also revealed no or poor correlated pattern between the similarity coefficients (Figures 4, 5 and 6). However, some level of agreement in paired similarity coefficient matrix was observed in matrix comparison plot in Figure 4; which is also evident in clustering pattern based on qualitative traits and molecular markers, where some genotypes were found to be under same clusters in both dendrograms. Such disagreement in the clustering pattern might arise when the gene sequences for the morpho-metric traits under study were not covered by those sequences by the primers used. Laviola et al. (2012) suggested that this disparity between data corresponding to molecular variability and those related to the variability available for breeding purposes (phenotypic variability) could arise from the fact that neutral molecular markers, such as RAPD or SSR, commonly used in molecular diversity studies, may be located in non-coding regions of the genome (Collard et al., 2005) and therefore be of limited use in predicting the phenotypic diversity of individuals, especially in complex quantitative traits, such as yield. Therein, Yadav and Singh (2010) suggested that lines that display high phenotypic dissimilarity need not be genetically dissimilar and vice-versa.
The three methods of diversity assessment revealing different clustering patterns suggested that preference for a particular method should be determined by the purpose of clustering; for instance, grouping of genotypes for quantitative traits should be done on quantitative traits. Molecular markers can be used for any traits; however, their use should be in a more exhaustive way. The inbreds under the present diversity analysis were found to be distinct between clusters and within clusters. So, the inbreds from distinct clusters having high genetic distance can be used as parents to exploit heterosis for quantitative traits such as grain yield. The results of the present study would be a valuable source of information for future maize breeding programme that could be established on the basis of genetic distances among the inbred lines studied.
This study was a part of the M.Sc. thesis research of the first author. The first author highly acknowledges the Directorate of Agricultural Research and Education (DARE), Ministry of Agriculture, Government of India and Government of Nepal for providing opportunity to pursue the M.Sc. (Ag.) program in Department of Plant Breeding and Genetics, Birsa Agricultural University (BAU), Kanke, Ranchi, under the Nepal Aid Fund Scholarship Scheme-2013. The authors also acknowledge the ICAR and the BAU for providing research platform and materials.
The authors have not declared any conflict of interests.