ABSTRACT
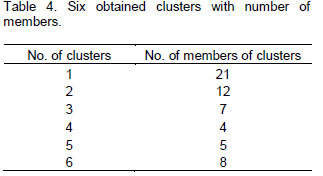
Forty-eight genotypes were planted in BIEKOL station field in 2009-2010. This study was carried out in augmented design with three check cultivars in three blocks (a total of 57 genotypes). In order to know uniformity, variance analysis of check genotypes showed that replications were not significant indicating no need for genotypes correction. Mean, standard deviation and coefficient variation for traits were different. The most and the least % CV were related to yield and duration of heading. In cluster analysis, yield components had important roles in cluster distinction. These traits became significant in variance analysis of clusters. In this case, cluster 6 with 8 and cluster 1 with 21 members had the most means in traits.
Key words: Wheat, coefficient of variation, mean, standard deviation, cluster.
Mazandaran Province is a
Caspian province in the north of
Iran. Located on the southern coast of the
Caspian Sea, it is bordered clockwise by the
Golestan,
Semnan,
Tehran,
Alborz,
Qazvin, and
Gilan provinces. However, while wheat is grown in over 60,000 ha in this province, its economic value is smaller than that of rice and citrus. Genetic diversity of the wheat landraces must be investigated for use in wheat breeding. More information about the genetic diversity within and relationships among landraces would be invaluable for the conservation and utilization of existing genetic resources. As regards wheat origin, Iran is one of the locations of diversity of common wheat with a long cultivation history. In addition, wheat genetic resources are sent from CIMMYT to Mazandaran Agricultural Research Center as international nurseries.
Basically, calculation of cluster numbers is based on numbers of principal components; however, 4 clusters were selected on the basis of Squared Euclidean Distance cluster because of the more obtained groups to each other than to those in other groups. Thus it can be used to distinguish genetic similarity or distance in wheat genotypes. Wheat has vast genetic diversity in aspects of quantitative and qualitative traits, environmental adaptability and types of tolerances Poelman (1987). Based on Hair et al. (1995) finding, acceptable genetic distance of within cluster should be less than that between clusters. Principal components analysis (PCA) is a method for complement of cluster analysis (Kantety et al., 1995; Johns et al., 1997; Dubreuil and Charcosset, 1998). According to Hailegiorgis and Mesfin (2011), genetic divergence of 49 bread wheat revealed that nine principal components (PC1 to PC9) accounted for nearly 80% of the total variation, thus these genotypes groups are organized into 9 clusters. Fag et al. (1996) used cluster analysis method on 120 wheat genotypes and obtained different groups based on studied traits. van Beuningen and Busch (1997) evaluated 289 spring wheat cultivars from USA, Canada, and Mexico grown in Minnesota during 1990 and 1991 and evaluated in three environments a total of 35 different cultivars.
However, six cultivars could not be grouped into 17 major clusters; major clusters grouped cultivars of common origin, parentage, and/or era of release. The goal of this study is genetic similarity and distance in spring wheat bread by cluster method.
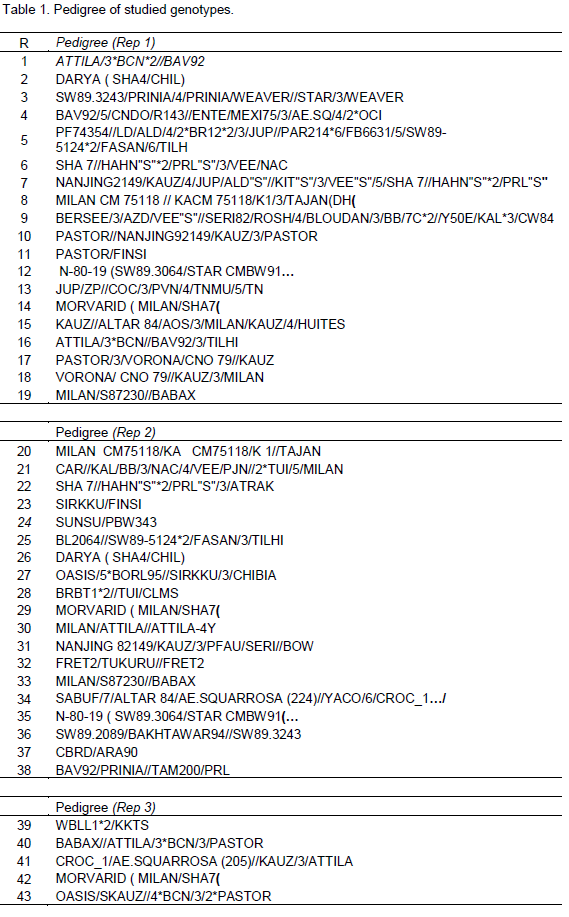
This trial was carried out in BIE KOLA (Longitude 53, 13° E and Latitude 36°, 43° and 15° meter sea level) station of Mazandaran Agricultural and Natural Resources Center. The experimental materials consisted of fifty-one varieties/lines of spring wheat (Table 1). The experimental materials consisted of 48 varieties/lines of spring wheat with three check cultivars in three blocks, a total of 57 in 3 blocks with 19 genotypes. The most genotypes were international materials from CYMMIT that we investigate every year. The varieties/lines were planted in augmented design. The field area was 6 × 5 × 0.2 = 6 m2. Studied traits including; Date of heading (DHE, Days), Plant height (PLH, cm), Spike length (SPL, cm), Stem length (SL, cm), Stem diameter (SD, mm), flag leaf width (FLW, cm), flag leaf length (FLL), first- inter-node (FDN), second-inter-node (SDN), third inter-node (TDN), forth inter-node (FODN), spikes per m2 (SM, No.) Seeds per spike (SS, No.), kernel weight 1,000 (KW, g), yield (yield, gm-2), biomass (BIO, g) and harvest index (HI, %). Used methods were:
1) Calculation of yield means, standard deviation and coefficient variation of traits.
2) Analysis of variance to obtain clusters based on traits.
3) Genotypes clustering based on traits.
To ensure uniformity of blocks, simple variance analysis method was used for yield of checks Milan/Sha4, Sw89.3064/STAR, Sha4/Chil by MSTATC program and in order to estimate relationships between traits, which include yield means, standard deviation and coefficient variation of traits and cluster analysis SPSS program was used (Table 5).
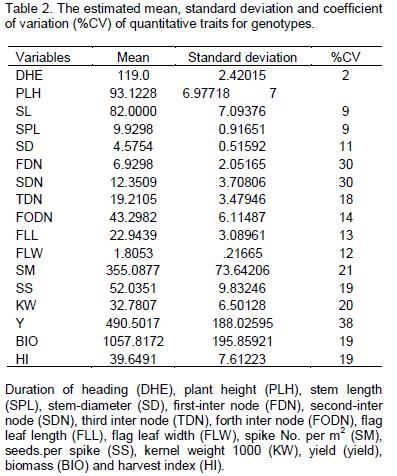
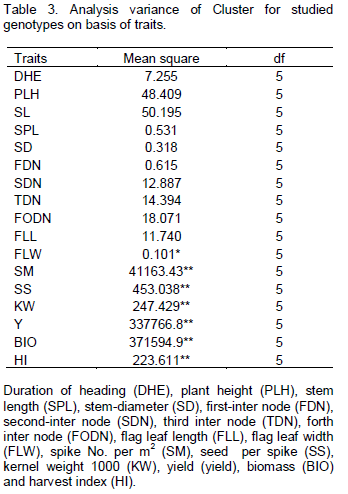
In order to determine traits, divergence was carried out in the calculations as shown in Table 2. CV% is a parameter which is not related to unit of measured traits and will be effective in comparing the studied traits. CV% of the traits varied from 2% for DHE to 38% for Y (Table 2). Obvious differences of CV% values among genotypes declared that genotypes had genetic divergence in some traits. Aghaee et al. (2010) reported that DHE had the lowest CV%, while yield and weight of seeds per spike has the most CV% value. In this case, results showed that coefficient of variation of two traits (PLH) and (DHE) were little, which can be through favorable rainfall. Variation was observed in yield versus yield components. Cluster analysis was used for grouping of genotypes by UPGMA and Euclidean distance method. Table 3 indicated analysis of variance of 6 clusters based on traits. Distribution pattern of all the genotypes into various clusters showed the presence of considerable genetic divergence among the genotypes for most of the studied .traits. Maximum and minimum mean data were observed within cluster 6 and 1 respectively. Thus, selected clusters had high yield, high yield components and high harvest index. In this way, we selected cluster 6, that is, genotypes with the highest yield and yield components in all clusters. Cluster 1 was the lowest group in yield and yield components (Table 4 and Figure 1). Kumar and Lal (2009) used multiple cluster for selecting of genotypes and on the basis of cluster means, he reported cluster 6 has been identified for selecting parents for incorporating grain yield per plant, tillers per plant and plant height; cluster 5 for spike length, grains per spike and early maturity, and cluster 3 for 1,000 grain weight. Selection of plants was argued on the basis of character associations. Chai (2000) reported that results using Euclidean Distance were greater than those using Mahalanobis distance.


The author(s) have not declared any conflict of interest.
The author thanks his colleagues Mrs. Ziadlou and Mr. Poor-ramazan and boss of Biekola Station, Mr. Spahbodi for their support throughout this research.
REFERENCES
|
Chai S (2000). Cluster analysis methods appropriate for classification of drought-resistant wheat ecotypes. Ying Yong Sheng Tai Xue Bao, 11(6):833-838. PMid:11767553 |
|
|
Dubreuil P, Charcosset A (1998). Genetic diversity within and among maize populations: A comparison between isozymes and nuclear RFLP loci. Theor. Appl. Genet. 96:577-587.
Crossref |
|
|
|
|
|
Fag XW, Xiong EH, Zhu W (1996). Cluster analysis of elite wheat germplasm. Jiang Agric. Sci. 4:14-16. |
|
|
Hailegiorgis T, Mesfin M (2011). Genetic divergence analysis on some bread wheat genotypes grown in Ethiopia. J. Central Eur. Agric. 12:344-352.
Crossref |
|
|
|
Hair JR, Anderson RE, Tatham RL, Black WC (1995). Multivariate data analysis with readings. 4th edition, Prentice-Hall, Englewood Cliffs, NJ. |
|
|
Johns MA, Skrotch PW, Neinhuis J, Hinrichsen P, Bascur G, Munoz-Schick (1997). Gene pool classification of common bean landraces from Chile based on RAPD and morphological data. Crop Sci. 37:605-613.
Crossref |
|
|
|
|
Kantety RV, Zeng X, Jeffrey LB, Zehr BE (1995). Assessment of genetic diversity in dent popcorn (Zea mays L.) inbred lines using inter-simple sequence repeat (ISSR) amplification. Mol. Breed. 1:365–373.
Crossref |
|
|
|
Kumar B, Lal GM (2009). Genetic variability, diversity and association of quantitative traits with grain yield in bread w heat (Triticum aestivum L.). Asian J. Agric. Sci. 1(1):4-6 |
|
|
Poelman JM (1987). Breeding Field Crop . Van Nostrand Reinhold. New York. P. 724.
Crossref |
|
|
|
|
|
van Beuningen LT, Busch RH (1997). Genetic diversity among North American Spring Wheat Cultivars: III. Cluster Analysis Based on Quantitative Morphological Traits. Alliance of crop, soil. Environ. Sci. Soc. 37:981-988. |