The Sunflower plant (Helianthus annuus L.) is an oilseed of great importance on the world stage, and it is considered as the fifth largest producer of grains and the fourth in oil production (Howell et al., 2015).
In Brazil, the sunflower cultivation is concentrated in the Midwest region, which accounts for 88.8% of the national production (Conab, 2013), but there is the possibility of cultivation in several Brazilian regions as it presents a short cycle (90 to 130 days) and has desirable characteristics for biodiesel production, such as hardiness, content and quality of the oil extracted from the grains (Souza et al., 2010). There is the example of the Northeast region, which despite contributing with only 5% of the Brazilian production (Ibge, 2012), it shows a good expansion potential, given its favorable characteristics to the sunflower cultivation, such as the great diversity of fertile soils in this region.
Sunflower cultivation in the Northeast of Brazil is mainly situated in regions of semiarid climate, which has limitations to express the potential crop productivity due to the low rainfall (< 700 mm per year) and poor distribution of rainfall, since the lack of water in the soil is a limiting factor to the growth and development of plants (Lechinoski et al., 2007). Thus, it becomes necessary to resort to the practice of irrigation, in order to reduce and / or eliminate the problems of inappropriate water supply in the agriculture of the semiarid region.
In agricultural systems where chemical fertilizers are not used, organic matter is the main source of nutrients, like in the case of subsistence agriculture of the semiarid region of the Northeast of Brazil (Tiessen et al., 2001; Jiang et al., 2014). In this context, the adoption of organic fertilization with cattle biofertilizers becomes a viable alternative because of the ease of obtainment and relatively low cost. However, there are few studies that address the organic fertilization in sunflower cultivation in semiarid, especially when related to the use of biofertilizers.
Thus, the study aimed to evaluate the growth of sunflower plants under different hydric availability. in two soils with the application of cattle biofertilizer.
The experiment was conducted from September 2011 to March 2012, in a greenhouse, on the premises of the Centre for Human and Agricultural Sciences, of the State University of Paraíba, Campus IV, Catolé do Rocha, Paraíba, Brazil, altitude of 275 m.
The soil used in the experiment were classified as Entisol and Alfisol (Usda, 2014), from Catolé do Rocha and Brejo dos Santos municipalities in Paraíba state. Samples of these soils were collected at a depth of 0 the 20 cm of depth, air-dried, sieved through a 2.0 mm mesh sieve and characterized chemically and physically using the methods adopted by Embrapa (1997), presenting the following results: Entisol: sand = 820 g kg-1; silt = 125 g kg-1; clay = 55 g kg-1; field capacity = 22.82% of the volume; permanent wilting point = 6.54% in volume; available water = 16.28% in volume; pH (H2O) = 7.44; Ca = 4.44 cmolc kg-1; Mg = 2.81 cmolc kg-1; Na = 0.26 cmolc kg-1; K = 0.57 cmolc kg-1; H = 0.00 cmolc kg-1; Al = 0.00 cmolc kg-1; OM = 6.9 g kg-1; P = 53.3 mg kg-1; Alfisol: sand = 655 g kg-1; silt = 228 g kg-1; Clay = 117; Field capacity = 19.60% of the volume; permanent wilting point = 5.70% in volume; available water = 13.06% in volume g kg-1; pH (H2O) = 7.81; Ca = 3.97 cmolc kg-1; Mg = 2.45 cmolc kg-1; Na = 0.15 cmolc kg-1; K = 0.18 cmolc kg-1; H = 0.06 cmolc kg-1; Al = 0.00 cmolc kg-1; OM = 4.5 g kg-1; P = 14.3 mg kg-1.
The treatments were arranged in a completely randomized design with 2 × 2 × 5 factorial, referring to two levels of available water (100 and 50% WA), two soils (Entisol and Alfisol) and five rates of cattle biofertilizer (0.0, 2.5, 5, 7.5 and 10 % of the substrate volume), totaling 20 treatments with nine replications and 180 experimental plots. Each experimental unit consisted of a plastic vessel with capacity for 30 liters and a sunflower (Helianthus annuus L.) plant of the hybrid cultivar Helium 253.
The sowing was performed at a depth of 5 cm, using seven seeds per pot, distributed equidistantly. The seedling emergence began on the fourth day after sowing (DAS), at the ninth DAS the first thinning was made, leaving three plants per pot and the second pruning at 15 DAS, leaving only one plant, the most vigorous one. The biofertilizer rates were applied three times in 20 days, starting after the second pruning.
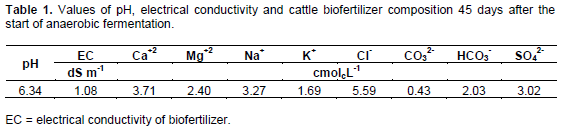
The cattle biofertilizer was obtained through anaerobic fermentation by mixing equal parts of fresh cattle manure and slightly saline water - EC = 0.8 dS m-1, adding 2 kg of leaves and branches of the leguminous plant beans-macassar (Vigna unguiculata L.), in the plastic biodigester with capacity for 200 liters, kept tightly closed for 45 days. During the fermentation the methane gas produced was released through a duct connected to the upper base and its end submerged in water (Santos, 1992). As a result of being applied in liquid form, composition analysis was performed following common procedures for water sample for irrigation, according to the data in Table 1, congenerous suggestion of Cavalcante et al. (2010).
Soil water content was monitored daily by TDR probe model PR2/6 (Time Domain Reflectometry) in the treatments of 100 and 50% of the WA in four depth intervals: 0-10; 10-20; 20-30 and 30-40 cm; from the readings made with the probe model PR 2 for each depth, the values were put in a spreadsheet that accounted for the water content of each layer (four layers of 10 cm each), making a balance of water content along the existing soil profile as determined in accordance with the following equation:
WA = (CC–CA)/100) x V (1)
Where: WA = water available in cm; CC = Moisture at field capacity (dry weight basis); CA = Current capacity of soil and V = Soil volume.
Based on the probe readings a water balance was performed, which recorded the consumption of water by such treatments. Irrigation of the vessels was done daily by hand with the aid of a graduated cylinder.
At 90 DAS the irrigation was suspended, based on the criterion of the physiological maturity of the grains (Silva et al., 2007a.); on this same period, all the plants were in the phenological stage R9 (chapter inclined down, with back and bracts with a color between yellow and brown). At this time, we determined the plant height (HP), stem diameter (SD), number of leaves per plant (NLP), the dry mass of the shoot (DMS), of the root (DMR) and total (DMT) where the HP was obtained using a millimeter ruler measuring the distance between the neck of the plant and the insertion of the chapter, the SD was determined using a digital caliper series 799 measuring the plant’s cervical region at a height of 5 cm of soil, DMS, DMR and DMT were evaluated with a precision balance after drying in an oven with forced air ventilation at 65°C until a constant weight was obtained. It was also measured the total leaf area (TLA) obtained through Equation 2:
TLA = 1.7582 L1.7067 (2)
Where the “L” is the width of the leaf blade (Maldaner et al., 2009).
The results were submitted to variance analysis, F test and regression using the statistical program Sisvar© (Ferreira, 2011).
A quadratic behavior of growth in height was observed on sunflower in function of the rates of biofertilizer in Entisol with 100% WA, where the maximum growth (135.07 cm) was estimated at the level of 3.3% v/v biofertilizer (Figure 1A). From the maximum point there is a tendency to reduction in plant height, a fact possibly related to the toxic effect of the gradual increase in biofertilizer rate, given that the soil is at field capacity and the cattle biofertilizer is made with nutrients readily available for the plants, thereby promoting an excessive increase in nutrients in the soil solution. Similar results were observed by Rivera-Cruz et al. (2008), who found an increased growth of the banana tree with a rate of up to 3% of biofertilizer applied in the crown projection, tending to decline since then.
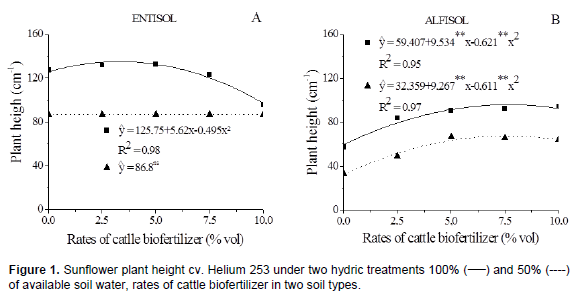
However, plants grown in Entisol with 50% WA in the soil, the data did not fit any mathematical model, and an average of 86.8 cm per plant was found. It is believed that in this condition the solubility of biofertilizer in the soil did not occur, so that the nutrients were not available for the plants, such a fact being contrary to that observed in the condition of 100% WA, which favors the solubility of the biofertilizer’s nutrients and their availability in the soil solution (Figure 1A).
In Alfisol, the increase in the level of biofertilizer resulted in a boost in plant height until the biofertilizer levels of 7.68 and 7.59% v/v, reaching maximum heights of 96.55 and 67.45 cm with 100 and 50% WA in the soil, respectively (Figure 1B). Regardless of the soil used, plants cultivated with 100% WA surpassed those grown with 50% WA, evidencing the effect of hydric stress on the plants. The increments found in this study were also similar to Silva et al. (2007b), who studied sunflower plants submitted to irrigation according to crop evapotranspiration and plants without hydric supplementation, finding an increase in plant height of about 20.8%. Paiva Sobrinho et al. (2011) also found that sunflower plants have a boost in height when there is an increase on the amount of available water in the soil, these responses having also being confirmed by Silva et al. (2007b) Nobre et al. (2010) and Freitas et al. (2012).
For the stem diameter variable, plants cultivated in Entisol maintained at 100% WA conformed to the polynomial model, with maximum diameter estimated at 23.07 mm, achieved with the estimated rate of 3.97% v/v of biofertilizer (Figure 2A). The stem diameter of the sunflower cultivated in Entisol submitted to 50% of WA positively conformed to the linear model, so that the unit increase of level of the soil biofertilizer provided a direct increment in diameter of 0.16 mm, with a maximum value of 17.97 mm regarding the highest rate of input.
In regard to Alfisol, it was observed that the stem diameter of sunflower plants increased linearly with higher rates of biofertilizer applied to the soil, reaching maximum diameter of 16.02 and 11.08 mm when fertilized with biofertilizer 10% in volume and kept at 100 and 50% WA, respectively (Figure 2B). The larger stem diameter in plants cultivated with 10% of biofertilizer is associated with increased fertility of Alfisol, given the low levels of organic matter, phosphorus and potassium verified in this soil in comparison to the studied Entisol.
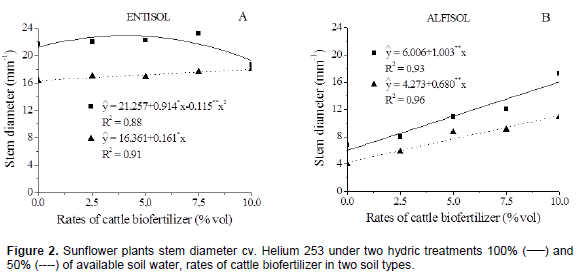
The reduction in the level of available water in the soil from 100 to 50% WA, independently of the soil studied, caused reductions in stem diameter of sunflower cultivar Helium 253, indicating that this plant does not support hydric deficit, since it provokes stem growth reduction in both height and diameter, possibly due to the fact hydric stress slows cell growth and elongation (Taiz and Zaiger, 2013). This information was also verified by Silva et al. (2007b) and Gomes et al. (2010), both studied sunflower plants submitted and not to hydric stress throughout the crop cycle. The authors ascertained increments in stem diameter of the plants, in the order of 26.48 and 22.22% for treatments without hydric stress in relation to plants under hydric stress. These results characterize sunflower as a plant highly sensitive to hydric stress.
As for the rates of biofertilizer, we verified a quadratic behaviour on Entisol maintained at 100% WA, noting that the largest number of leaves (20.76 plant-1) was obtained in plants cultivated at a rate of 3.44% v/v. However, plants subjected to water deficit (50% WA in the soil) did not fit to the specific mathematical models, obtaining an average of 19.87 leaves plant-1 (Figure 3A). Reductions were observed in the number of leaves of sunflower plants when subjected to biofertilizer levels above 3.44% v/v on the treatments kept without hydric stress. This fact may be related to excess nutrients applied to the soil via biofertilizer, as verified by Oliveira et al. (2009), where high levels of organic matter in the form of manure can cause nutritional imbalance in the soil and, consequently,

When studying the number of plant leaves cultivated in Alfisol, there was a linear increase with increments of 0.74 and 0.65 leaves per plant for each unit increase of biofertilizer rate for levels of 100 and 50% of WA in the soil, respectively (Figure 3B). The superiority of the number of leaves in conditions of 100% WA and the reduction in the number of leaves on plants under condition of hydric stress is explained by Taiz and Zeiger (2013), so that the lack of water in the plant tissues due to drought limits cell division and CO2 assimilation rate, thus reducing plant growth.
However, the significant increase in the number of leaves as a result of the increase of irrigation depth is in accordance with Paiva Sobrinho et al. (2011), that evaluating sunflower under different levels of irrigation (60, 70, 80, 90 and 100% in relation to field capacity), observed a significant effect of increase in water availability on the number of leaves, being 87.34% the one that provided the highest number of leaves per plant (10.25).
An increase in leaf area of plants cultivated in Entisol at the level of 100% WA was observed when fertilized with cattle biofertilizer until the estimated rate of 3.13% v/v, with a value of 423.78 cm2, decreasing with an increase of the rate (Figure 4A). This happens probably for nutritional imbalance, caused by an excess of nutrients, due to the natural fertility of the soil present elevated levels even before the application of biofertilizer, and also favor a possible increase of salt content in the soil solution (Epstein and Bloom, 2006).
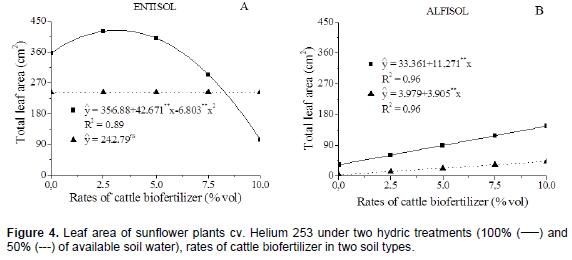
On the plants led to 50% WA in Entisol, the data of leaf area did not adjust to the mathematical models studied, obtaining a mean of 242.79 cm2 plant-1 (Figure 4A), possibly under this condition of hydric availability the biofertilizer dilution did not occur, unlike it was verified in Alfisol which has higher content of silt and clay giving the this soil higher amount of micropores when compared to Entisol, which has 82% of sand in its granulometric fraction, which confers it a greater number of macropores, resulting in a greater water loss and hence in insufficient solubility of biofertilizer for the plants. This is confirmed by the positive effect of biofertilizer in Alfisol with water availability at 50% WA in the soil where your greatest clay content promoted greater water retention in the soil (Figure 4B).
For the leaf area of sunflower plants grown in Alfisol, a linear and growing behavior was observed, with an increase of 11.3 and 3.9 cm2 in leaf area for each unit increase of biofertilizer rate, on the blades 100 and 50% WA, respectively (Figure 4B), achieving leaf area of 146.07 and 43.04 cm2 when submitted to 10% of biofertilizer. Probably the biggest leaf area in the soil maintained at 100% of WA may be related to the higher solubility and thus availability of organic matter applied to the soil through the biofertilizer, thus improving the relationship between macro and micronutrients. In addition to the fact that the addition of biofertilizer increases the content of organic matter in the soil and consequently increases the water retention level in the soil. According to Silva Júnior and Siqueira (1997) the mineralization of organic fertilizers improves soil structure, aeration and capacity to hold water, for assisting in the formation of aggregates, and exercising with this direct effect on soil microporosity.
With respect to the water content in the soil, similar results were obtained by Silva et al. (2007b) and Paiva Sobrinho et al. (2011), who verified that 93.43% of field capacity promoted greater leaf area of sunflower cultivars Charrua and Olisun 3 evidencing that the sunflower crop requires high availability of water in the soil.
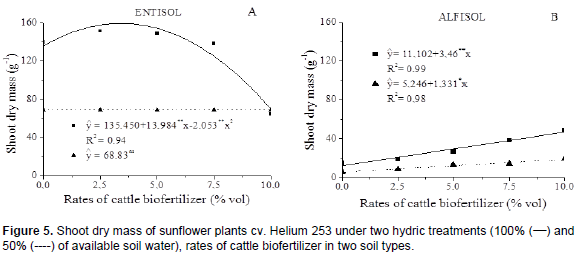
A quadratic behavior of cumulative shoot dry mass of cultivar Helium 253 sunflower’s was observed depending on the biofertilizer rates applied to Entisol kept at 100% of WA, verifying the maximum accumulation of biomass of 159.25 g plant-1, in the estimated amount of 3.40% v/v.
However, when the soil was maintained at 50% of WA, dry biomass data did not fit the proposed mathematical models, averaging 68.83 g plant-1, these results, 43% lower than those observed in plants grown with 100% WA (Figure 5A).
However, a linear growth of the shoot dry mass in Entisol with 100 and 50% WA, with an increase of 3.46 and 1.33 g plant-1 for each unitary increase in biofertilizer rate, reaching maximum values of 46.51 and 18.56 g plant-1 at rate of 10% (v/v), respectively (Figure 5B).
The superiority of plants kept at 100% WA in the soil is observed on the order of 131.36 and 162.98% in comparison to plants submitted to 50% WA in Entisol and Alfisol, respectively. This fact shows that the Helium 253 sunflower hybrid did not support the water stress, thus evidenced the importance of adequate water supply throughout the culture cycle, in order to occur effective plant growth, resulting in great productions of biomass, in agreement with Silva et al. (2011) and Paiva Sobrinho et al. (2011), who also observed greater biomass weight of sunflower cultivated without hydric deficit in the soil.
Plants cultivated in Entisol were greater than those grown in Alfisol, with Entisol superiority of 262.65% in aerial biomass of sunflower Helium 253. This may be related to increased K, Ca and organic matter of Entisol, because according to Zobiole et al. (2010), the export order of the hybrid BRS 191 was as follows: N > P = K > Mg = S > Ca. These authors also mention the importance of adequate supply of N, K and Ca, due to high demand of the culture for these elements. These findings were also confirmed by Christin et al. (2009) by verifying the reduction in plant height and number of leaves of the sunflower grown with potassium and nitrogen deficiency in the order of (53.33 and 25%) and (77 and 66.7%), respectively, when compared to those grown without nutritional deficiency.
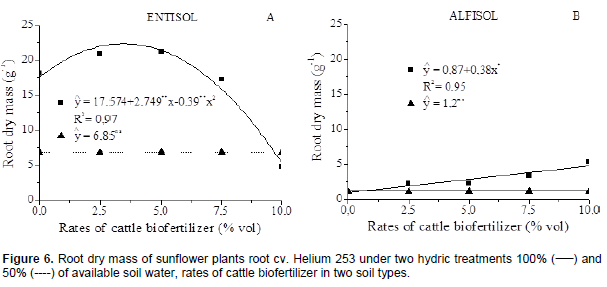
The root biomass per plant was influenced by the biofertilizer rates applied at Entisol and Alfisol at 100% WA, observing the maximum value of 22.30 and 5.18 g plant-1 with application of 3.14 and 10% of the volume, respectively. In the unfolding of the triple interaction of biofertilizer rates within the blade of 50% of WA in both soils, root dry mass per plant did not fit any proposed mathematical model, with averages of 6.85 and 1.2 g plant-1, respectively (Figure 6A and B). This reduction in root dry weight of the plants submitted to hydric stress in the soil may be a reflection of lower absorption of essential elements, according to a research conducted by Paiva Sobrinho et al. (2011), who found that 60% WA in the soil caused a reduction of perspiration, leading to lower water absorption and therefore lower nutrient absorption by the plants promoting limitations to their growth. Vazin et al. (2011) found a reduction of 38% of the shoot dry mass of the sunflower in vegetative phase and only 6% in the production phase when submitted to hydric stress compared to plants grown without soil water deficit.
Plants cultivated in Entisol overlapped the root dry mass of those cultivated in Alfisol, regardless of the water level in the soil. Possibly, the greater content of phosphorus and organic matter in Entisol provided a bigger root growth. Phosphorus is a primary macronutrient, and albeit absorbed in smaller quantities than nitrogen and potassium, its presence on the soil is essential for the growth and production of plants, and organic matter can increase its availability.