Full Length Research Paper

ABSTRACT
The insufficiency of nutrients in the soils has been identified as one of the factors that have affected the productivity of crops. An investigation was carried out to assess the trophic level of soil in the region. Using a non-probability sampling technique, a total of 70 representative surface soil samples were collected between February and April, 2021. The sampling depth ranged from 0 to 30 cm, according to the root length of the crop. The collected soil samples were analyzed to assess the pH, EC, OM, available macronutrients, and micronutrients. The macronutrients were determined using a flame photometer, and micronutrients were determined with ICP-OES. The organic matter status was low in Trenabougou soils. The soils are moderately acidic in reaction (pH 5.84) with low soluble salt content (EC 0.27 dS/m). Some macronutrients were low or medium in fertility status. The nitrogen, potassium, and magnesium nutrient index values were below 1.25, indicating low fertility status. Nevertheless, sulphurous and calcium were found at medium fertility levels with a nutrient index of 1.87 and 2.17. The concentrations of micronutrients like iron, copper, and zinc were high in soils. Nevertheless, nickel, manganese, and boron were in the limited range suitable for plant growth.
Key words: Available NPK, Nutrients, Nutrient Index, Siby, Mali.
INTRODUCTION
Trenabougou is situated at an altitude of 338 m (1108.924 ft) above mean sea level, between latitude 13°71'02" N and longitude 58°46'42" W. The main activity of the community is agriculture, fishing, and commerce. Due to the importance of agriculture in this locality, a soil fertility assessment was necessary. A study was carried out to evaluate the status of available significant nutrients in the soils of Trenabougou. Physicochemical parameters, macronutrients, and micronutrients are the most critical factors affecting crop yield. Soil fertility can be determined by analyzing the nutrients available in the soil. This can help determine the optimal fertilizer application. In addition, the study area lacks previous investigations. The only study held on this area was done by Ramisch (2005), though the survey was not mainly focused on this area. A study on the nutrient balances of farming systems in Sub-Saharan Africa revealed that most countries are experiencing severe nutrient deficits (Day and Aillery, 1988). In the research area, crops have experienced issues with yield and growth for more than ten years. The ability of the soil to provide nutrients to its plants is one of the most important factors that can affect its productivity.
Without these nutrients, the soil can lose its stability and productivity (Naidu et al., 2019). The cultivable soil of Trenabougou cannot provide adequate nutrients to their plants due to its low concentration of macronutrients, such as nitrogen, phosphorous, potassium, magnesium, calcium, and sodium (Gårdestedt et al., 2009). Aside from the macronutrients present in the soil, the availability of micronutrients also promotes crops' most critical growth and production factors, though their concentrations are required at low levels. The soil of the study area is deficient in micronutrients, especially in nickel (Ni), boron (B) and manganese (Mn), which subsequently affects plant production capacities. The soil of Trenabougou is rich in organic matter, which may help retain water and provide the nutrients with the plants need (Ramisch, 2005; Diarra, 2007). Understanding the various interactions between nutrients and the soil can help improve the efficiency of cropland. Excess concentrations of nutrients can also affect the productivity of the soil, which can cause plants to overload the nutrients. The main objective of this investigation is to evaluate soil physicochemical, macro, and micronutrients in the study locality. Therefore, the second objective of this study is to determine the quantity of fertilizers that farmers should use to ensure that their crops receive adequate nutrients.
MATERIALS AND METHODS
Study area
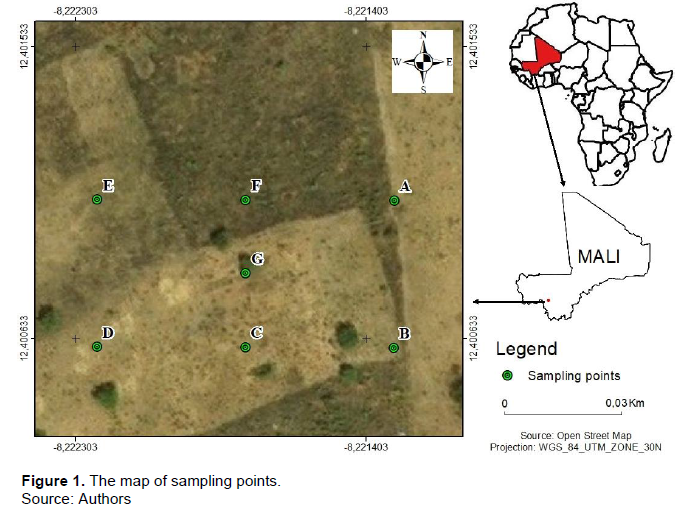
The study area is located in Trenabougou, a small farming hamlet near Siby. It lies between latitude 13°71'02'' N and longitude 58°46'42'' W with an altitude of 338 m (1108.924 ft) from mean sea level, as shown in the map of the study area (Figure 1). Siby is a rural commune that extends over 1,001.25 Km2. The region is characterized by three main seasons: a rainfall season, a cold period, and a dry period. The rain is seasonal, and it varies from 300 to 1000 mm annually and is mainly received from June to October. The cold period starts around September and ends in February. In summer, the maximum temperature ranges from 32 to 44°C. The area is vital for food crop cultivation, and the economic source of the farmers in this region mainly depends upon the crops of millet, sorghum, groundnut, and cotton. Indeed, the first mangoes that appear on the Malian market at the beginning of February come from Siby and its immediate surroundings, a region of primeurs.
Sampling and preparation of soil samples
This study used a non-probability sampling technique, especially convenience sampling. Several sampling points were selected for convenience, and 70 soil samples were taken from 7 sampling sites due to the importance of crops growing in the region. The samples were thoroughly mixed according to the Fisher device to obtain 4 composite samples (S1, S2, S3 and S4). Samples were collected from 0 to 30 cm depth according to the rooting depth of food crops. The air-dried soil samples were crushed using a wooden rolling pin and sieved through a 2 mm sieve. They were then placed in a plastic bag for further physico-chemical, macro and micronutrient analysis.
Physicochemical property analysis
The collected soil samples were analyzed using standard techniques for soil physicochemical properties (pH, EC, OC, and OM). The organic soil matter (OM) content was measured according to the ignition method after burning at 500 to 600°C overnight (Schollenberger, 1945). Soil pH was determined in a 1/2.5 (soil/water ratio w/v) suspension with a pH metre model (OAKLON pH 550) according to the method of Grewelling and Peech (1960). The cation exchange capacity (CEC) was assessed with the Agronomic Soil Tests method. Titration was used to measure CaCO3. Electrical conductivity (EC) was measured using a portable probe conductivity metre (Systronics conductivity metre 304). The studied soil samples' texture was measured using the hydrometer method based on Stoke's law (Bouyoucos, 1962), and the physicochemical values are shown in Table 1.
The concentration of exchangeable potassium (K), sodium (Na), and calcium (Ca) extraction in the soil was determined using the method of Ghosh et al. (1983). An amount of 10 g of dried soil was shaken with 50 ml of neutral standard ammonium acetate solution (NH4OAc) for 30 min and filtered immediately through a dry filter paper (Whatman N°1). The flame photometer determined the content of the macronutrients (N, P, K, and Ca) using the Ghosh et al. (1983) technique, shown in Table 2.
The soil's micronutrients, such as Fe, Cu, Mn, Zn, Mn and B concentrations, were measured using an Inductively Coupled Plasma Optical Electron Spectrometer (ICP-OES). 2 g of each grounded air-dried soil sample was digested in 8 ml of aqua regia (6 ml of HNO3 and 2 ml of HCl) with microwave digester Anton Paar (Multiwave 5500). The extract was filtered with Whatman filter paper N°1 and then made 50 ml with MilliQ water. The sample's solution was analyzed using ICP-OES, and water was used as a blank.
Soil nutrient index determination
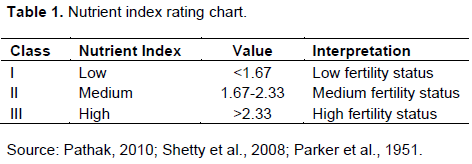
The soil fertility analysis aims to determine the nutrients plants need for healthy growth. The nutrient index (NI) measures how nutrients are available for plants to take in the soil. The nutrient index categorization and calculation were done by many scientists, such as Parker et al. (1951), Shetty et al. (2008) and Pathak (2010). The nutrient index of the study area was calculated by using the following formula:
Nutrient Index (N.I.) = (NL × 1 + NM × 2 + NH × 3) / NTS (1)
where NL: number of samples in low class (I) of nutrient level; NM: number of samples in medium class (II) of nutrient level; NH: number of samples in high class (III) of nutrient level; and NTS: total number of samples analyzed in the study area.
In this research study, available nitrogen (N), available phosphorus (P) and available potassium (K) were used to determine the fertility status in Trenabougou soils. The interpretations of each class are shown in Table 1.
Statistical analysis
The difference between soil characteristics was assessed using descriptive statistical parameters (range, minimum, maximum, standard deviation, and mean). The relationship between macronutrients and micronutrient concentrations in investigated soils was also determined using SPSS software, with Pearson correlation coefficients and 2-tailed predictions.
RESULTS AND DISCUSSION
Soil physicochemical properties description
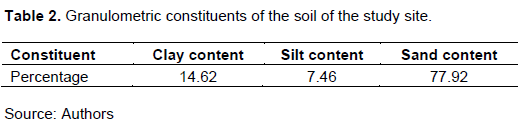
Soil samples analyzed for their particle size revealed that the soil had a low proportion of clay (14.62%) and silt (7.46%), and high sand (77.92%) content. The percentages of soil indicated that the study area has a sandy texture with almost 78% sand, shown in Table 2.
The contents of the soil's various physicochemical elements have been analyzed, and the data are presented in Table 3. The analyses have shown that the soil has a relatively poor pH value in the study area. The soil pH has a minimum value of 4.85 and a maximum of 6.87 in all soil samples, which means that the investigated soil was strong to slightly acidic, as shown in Figure 2. This low pH might be due to the lack of base saturation and the presence of some metallic elements. The acidity of the area may also be explained by the excessive use of agrochemicals and the acidic rainfall (Amar and Shanmugasundaram, 2020).
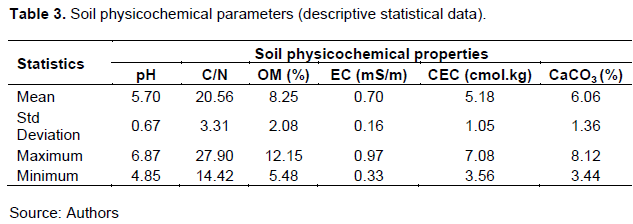
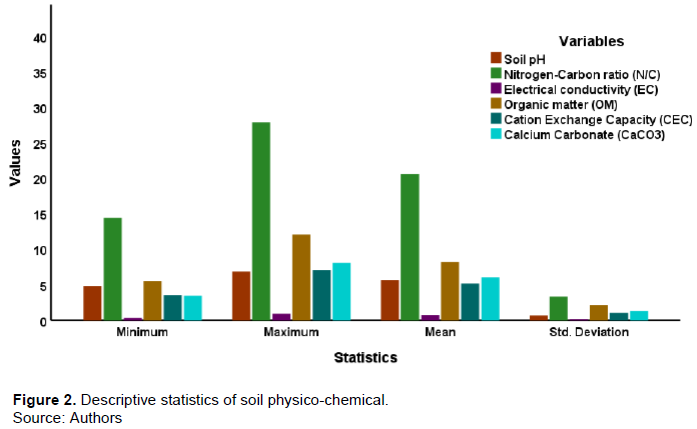
The analyses have indicated excellent organic matter decomposition because the carbon-nitrogen ratio was felt in the optimum range with a maximum value of C/N less than 28 (Mathew et al., 2016; Gore et al., 2017).
Based on the interpretation given by ISSWC (Indian Society of Soil and Water Conservation) for judging salt problems of soils, the electrical conductivity ranged from 0.33 to 0.97 EC (mS/m), which means that the EC values of Trenabougou soil are less than 1 mS/m, indicating that the study area soils are free from salt according to the interpretation of ISSWC (M, 1965). Calcium carbonate contents in the analyzed samples were found to be very low. The lowest and highest values of CaCO3 were 3.44 and 6.06%, respectively, as reported in Table 2. The good calcium carbonate content of soil varies from 60 to 80% (AGvise laboratory, 2021). The cation exchange capacity (CEC) in the soil is a valuable measure of soil fertility. It shows how well the soil can hold the nutrients against leaching scenarios. CEC content varies by soil type, ranging from less than 10 cmol/kg in sandy soil to more than 15 cmol/kg in low organic matter soil and more than 60 to 80 cmol/kg in finer textured soils with high organic matter content. A high percentage of sand may explain the low CEC content of Trenabougou soil, as interpreted earlier. Sandy soils generally have less than 10 cmol/kg (AGvise Laboratory, 2021; Ross and Ketterings, 1996).
Soil macronutrients (N, P, K, Ca, Mg, S)
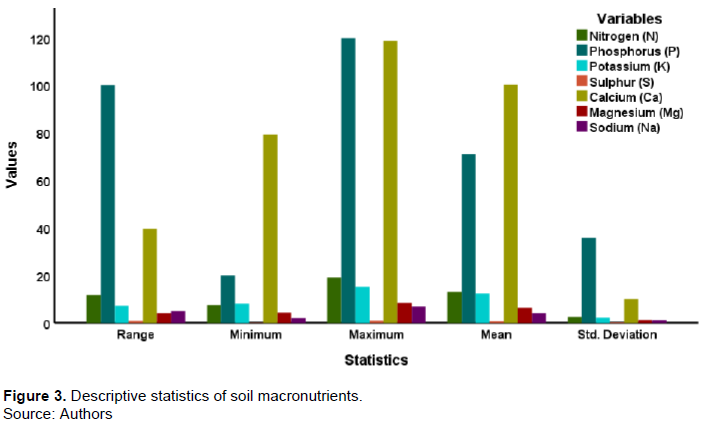
The macronutrients found in soil are divided into primary and secondary. These compounds are needed in large quantities to sustain plant growth. The primary macronutrients are required at high concentrations in soils, such as nitrogen (N), phosphorus (P), and potassium (K) (Belt et al., 2016; Mugo et al., 2020). These three primary nutrients are more necessary than the other secondary macronutrients since they are more required for plant development. Secondary macronutrients include calcium (Ca), magnesium (Mg), and sulphur (S), and they are also needed to sustain plant health in lower quantities compared to primary macronutrients. For a concise description and understanding, the macronutrient concentrations are indicated in Table 4.
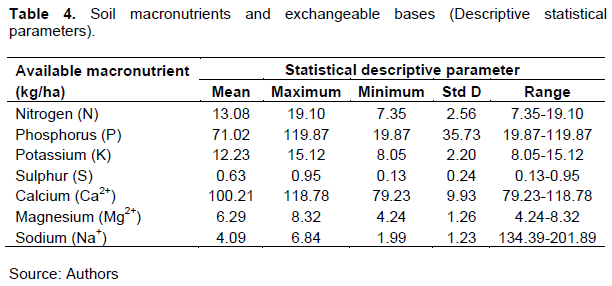
The available nitrogen (N) content of Trenabougou soils was between 7.35 and 19.10 kg/ha, with a mean value of 13.08 kg/ha. Nitrogen content is minimal compared to the optimum value of N in cultivable soil fixed at 240 to 480 kg/ha (Tech, 2021). Based on the obtained nitrogen value, the soils of the investigated area are deficient in nitrogen, which may cause plant chlorosis and thin stems (Baethgen and Alley, 1987). The average phosphorus value was found at 71.02 kg/ha, as shown in Figure 3. The maximum and minimum phosphorus contents were 119.87 and 19.87 kg/ha, respectively. Similar results have also been reported that the ideal according to the interpretation of previous studies (Arokiyaraj et al., 2011; Banerjee et al., 2011). The analyzed samples were deficient in potassium; the range was between 8.05 and 15.12 kg/ha, with an average of 12.23 kg/ha. These values are far from the required potassium content in farming soil, recorded at 110 to 280 kg/ha (Wolf and Beegle, 2011). This means the potassium content is too low to satisfy the plant's need for reasonable productivity.
The minimum value of sulphur was recorded at 27 cmol/kg, whereas the maximum content was found at 40.08 cmol/kg. Similarly, the statistical average value of sulphur was determined at 34.63 Cmol/kg in Mansala-Kayikoro soils, as shown in Table 4.
The large amounts of exchangeable cations, such as calcium, magnesium, and sodium, are taken up by plants and are major mineral constituents in most soils. Due to their importance in agriculture, these elements were quantified as indicated in Table 4 and Figure 1. Calcium was found in the range of 38.32 to 45 Cmol/kg. Calcium is uptaken by the plants in ionic form (Ca2+), and its deficiency causes yellowish to brownish plant leaves. This statement was confirmed in a study by Kiran (2018). In addition, magnesium content was also found to be low in the samples since the descriptive statistic range was recorded at 58.97 to 70.00 Cmol/kg, which is inadequate according to the interpretation of Mg value in the soil in previous studies (Carpenter et al., 2006; Wolf and Beegle, 2011). The most observed symptom of magnesium deficiency is known to cause chlorosis on the older leaves and yellow colouration in dicots. The total sodium in the soil ranged between 134.39 and 201.89 Cmol/kg. The sodium concentration seemed to be high in the analyzed soil samples; for instance, the mean of Na was recorded at 174.77 Cmol/kg, which is above the permissible level for the plant. The availability of salt in soil depends upon the parent rock from which it was formed, and irrigation is another way to increase sodium concentration in soil. A high salt concentration in the soil harms the plants as the water uptake is reduced (Weil, 2014). The most commonly found macronutrients in Mansala-Kayikoro soil were below the limit range. This means that the additional fertilizer and manure needed to increase the plant's growth will be required.
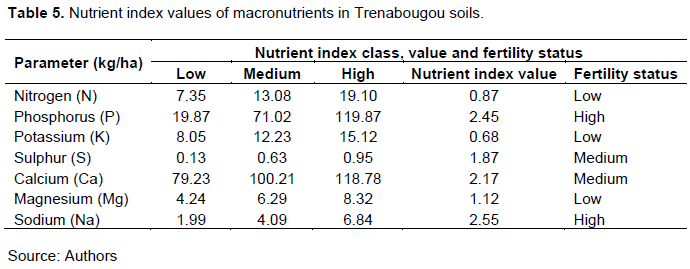
Determination of the soil nutrient index
Previous studies determined the soil nutrient index into three classes: low, medium, and high (Doran, 2019; Winters et al., 1951). The interpretations have shown that soil fertility status is low if the index value is less than 1.67; between 1.67 and 2.33, the status is medium; and if the index value is greater than 2.33, fertility status is high, as indicated in Table 2. The concentrations of macronutrients (N, P, K, S, Ca, Mg, and Na) were assessed to determine the study area's nutrient index. In Trenabougou soil, almost all the macronutrients were low or medium in fertility status. As indicated in Table 5, the nutrient index values of nitrogen (N), potassium (K) and magnesium (Mg) were below 1.25, meaning they have a low fertility status. Nevertheless, sulphur (S) and calcium (Ca) were found at medium fertility levels with a nutrient index of 1.87 and 2.17. However, we have noticed that potassium (K) and sodium (Na) were found at high fertility levels with nutrient indexes of 2.45 and 2.55. By referring to the interpretations of Kumar and Srinivasamurthy (2017), the fertility status of the investigated soil may be classified as low fertility status.
Micronutrients (Fe, Mn, Zn, Cu, and B)
Iron (Fe) status
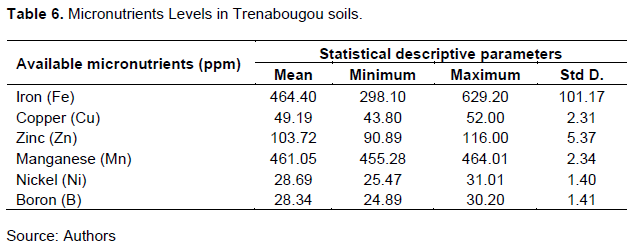
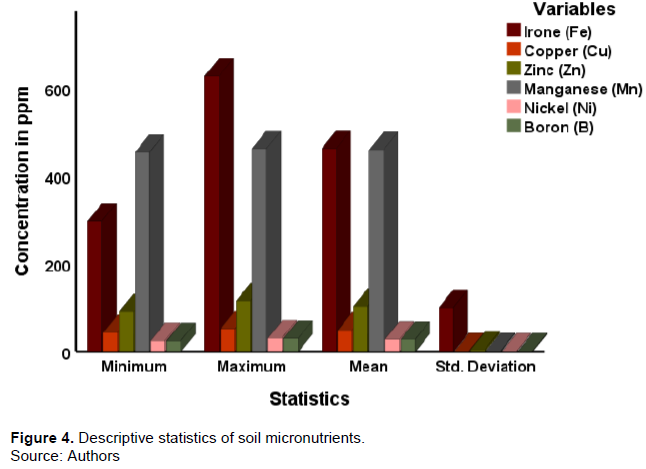
Iron (Fe) ranged from 298.10 to 629.20 ppm with mean and standard deviation values of 464.40 and 101.17, respectively (Table 6). The samples were in the good range in terms of concentrations of Fe. This high concentration of Fe is due to the lack of organic matter and low pH level in the study area, which might have promoted iron oxidation and precipitation, consequently increasing Fe availability (Kumar et al., 2021).
Copper (Cu) status
The copper content was found to be low in the investigated samples. It ranged from 43.80 to 52.00 ppm, with a mean value of 49.19, indicating the ideal concentration of Cu for crops' healthy and productive growth. Previous studies have confirmed that the Cu concentration should range between 2 and 50 ppm for good crop productivity (Planetprobs.net, 2021). Copper toxicity to roots could occur when total Cu exceeds 50 ppm in sandy soils and up to 150 ppm for silty-clay or clay soils. The low pH level and high concentration of Fe in the study area should explain the high concentration of Cu.
Zinc (Zn) status
The available Zn content in Trenabougou soils ranged between 90.89 and 116.00 ppm with an average value of 103.72 ppm, shown in Table 6. Zinc levels were slightly above the optimum requirement in the analyzed soil samples. Zinc availability in soils depends upon the geochemical composition and weathering of the parent material. The normal Zn concentration needed for plant uptake is between 20 and 100 ppm. Like all plant nutrients, Zn must be dissolved in water before roots can take it up. So, the constant addition of agrochemicals could increase the adequate levels of Zn in these soils. These results are in accordance with those of Kihara et al. (2020), who found sufficient Zn content in African soils.
Manganese (Mn) status
Available Mn analyzed ranged betwee 455.28 and 464.01 ppm, with an average value of 461.05 ppm, indicating that Mn is slightly high in Trenabougou soils. The normal concentration range of Mn in plants is typically from 20 to 300 ppm. The availability of Mn in the soil is affected by the low pH level and high content of Fe in the study area. These observations are in accordance with the findings of Kumar and Srinivasamurthy (2017).
Nickel (Ni) status
The available Ni in the study area ranged between 25.47 and 31.01 ppm, with a mean value of 28.69, as indicated in Figure 4. As a matter of choice, Ni's concentration is between 1 and 20 ppm for healthy and productive soil. For optimal soil and plant health, it is essential to fix the concentration of Ni at around 1 to 20 ppm. It is also important to investigate Ni's effects on soil health to minimize crop contamination if its concentration is below 30 ppm (Naidu et al., 2019; Mugo et al., 2020).
Boron (B) status
Available B ranged between 24.89 and 30.20 ppm with a mean value of 28.34 ppm (Table 6). Although boron is essential to plant development and growth, it is typically not required in large quantities. The ideal boron content for most crops is around 20 to 100 ppm. The recent high rainfall in the region has caused a deficiency in the B levels in the study area. This issue is likely caused by the complexation of the soil with silicate minerals and the high pH levels. The observations found in this study are in line with the findings of the previous studies conducted by the researchers (Singh, 2018; Dhotare et al., 2019).
Correlation between micronutrients in Trenabougou soils
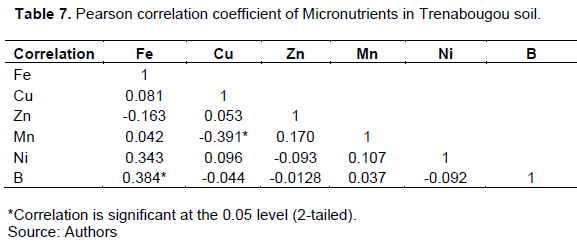
The correlation between soil micronutrients at P = 0.05 levels is shown in Table 7. The concentration of micronutrients was affected by soil physicochemical properties like organic matter, the texture of the soil, pH level and some factors such as parent material and rainfall in the study area. A strong and positive correlation micronutrients was significant at 0.05 or 95% confidence level (2-tailed). This strong relationship between micronutrients would be due to the high pH and other soil factors such as lithogenic properties (Shirgire et al., 2018; Romera et al., 2021). Nevertheless, a negative correlation was observed between Fe-Cu, Mn-Cu, B-Cu, Zn-Ni, Zn-B and Ni-B with R-values of -0.163, -0.391, -0.044, -0.093, -0.128 and -0.092, respectively in Trenabougou soils, shown in Table 7. The correlations between these elements were negative at 0.05% significance in soil samples. A negative correlation between the soil micronutrients was also observed, suggesting that Fe, Ni and Zn are increasing while Cu, B, and Mn are decreasing in the soil (Dhaliwal et al., 2019).
CONCLUSION
The soils of Trenabougou are classified as having low, medium and high categories based on calculating the nutrient index. The study's results revealed that the soil fertility levels in the area were inadequate. Most soil samples had low concentrations of nitrogen, potassium, and magnesium. Sulphur and calcium were found at medium concentrations, and phosphorous and sodium were high in Trenabougou soils. Soil samples revealed acidic characteristics and low electrical conductivity. Iron, copper, and zinc concentrations were high in soils, and other micronutrients like nickel, manganese, and boron were in the limited range, suitable for plant growth.
Simultaneously applying organic manures and chemical fertilizers can help improve the efficiency of the nutrients in the study area.
CONFLICT OF INTERESTS
The authors have not declared any conflict of interests.
ACKNOWLEDGEMENTS
The authors thank the Indian Council for Cultural and Relations (ICCR) for their financial support by giving the scholarship. They also thank the School of Engineering and Technology/Nanotechnology for the educational materials.
REFERENCES
|
Amar A, Shanmugasundaram R (2020). Nutrient Index Values and Soil Fertility Ratings for Available Sulphur and Micronutrients of Tiruchirappalli District of Tamil Nadu, India. International Journal of Current Microbiology and Applied Sciences 9(3):337-347. |
|
|
Belt O, Chaudhari UE, Wanjari AK, Kumre ND, Ahmad ANM, Barde MP (2016). Assessment of macro and micro nutrients in alkaline soil from Satpuda region. Advances in Applied Science Research 7(3):175-178. |
|
|
Day JC, Aillery MP (1988). Soil and moisture management in Mali: a case study analysis for West Africa. Agricultural Economics 2(3):209-222. |
|
|
Dhaliwal SS, Naresh RK, Mandal A, Singh R, Dhaliwal MK. (2019). Dynamics and transformations of micronutrients in agricultural soils as influenced by organic matter build-up: A review. Environmental and Sustainability Indicators 1(2):100007. |
|
|
Dhotare VA, Guldekar VD, Ingle SN, Bhoyar SM (2019). Appraisal of Macro and Micronutrient Status of Soils of Washim Road Farm of Dr. PDKV Akola, Maharashtra, Using GPS. International Research Journal of Pure and Applied Chemistry 20(1):1-7. |
|
|
Diarra AN (2007). Diagnostic Sur La Fertilite Des Sols Dans La Zone Cotonniere Du Mali Etudes Sur Les Matieres Organiques Du Sol. Rapport P 64. |
|
|
Gårdestedt C, Plea M, Nilsson G, Jacks B, Jacks G (2009). Zinc in soils, crops, and meals in the Niger inland delta, Mali. Ambio 38(6):334-338. |
|
|
Gore YD, Sadanshiv NS, Wagh NS (2017). Evaluation of micronutrient status of soils and their relation with some chemical properties of soils of Wardha district, Maharashtra. An Asian Journal of Soil Science 12(2):271-274. |
|
|
Kumar KSA, Srinivasamurthy CA (2017). Soil fertility status and nutrient index for primary nutrients in Western Ghats and Coastal Karnataka under different Agroecological Systems 12(2):314-319. |
|
|
Kumar S, Kumar S, Mohapatra T (2021). Interaction Between Macro? and Micro-Nutrients in Plants. Frontiers in Plant Science P. 12. |
|
|
Mathew MM, Majule AE, Marchant R, Sinclair F (2016). Variability of Soil Micronutrients Concentration along the Slopes of Mount Kilimanjaro, Tanzania. Applied and Environmental Soil Science P. 7. |
|
|
Mugo JN, Karanja NN, Gachene CK, Dittert K, Nyawade SO, Schulte-Geldermann E (2020). Assessment of soil fertility and potato crop nutrient status in central and eastern highlands of Kenya. Scientific Reports 10(1):1-11. |
|
|
Naidu BV, Sobhana V, Sudhakar P, Sen S, Obulapathi N, Sneha MV, Tiwari P (2019). Soil nutrient status of mulberry gardens in varied clusters of Andhra Pradesh. Emergent Life Sciences Research 05(02):43-51. |
|
|
Parker FW, Nelson WL, Winters E, Miles IE (1951). The broad interpretation and application of soil test information. Agronomy Journal 43(3):105-112. |
|
|
Pathak H (2010). Trend of fertility status of Indian soils. Current Advances in Agricultural Sciences 2(1):10-12. |
|
|
Ramisch JJ (2005). Inequality, agro-pastoral exchanges, and soil fertility gradients in southern Mali. Agriculture, Ecosystems and Environment 1(5):353-372. |
|
|
Romera FJ, Lan P, Rodríguez-Celma J, Pérez-Vicente R (2021). Editorial: Nutrient Interactions in Plants. In Frontiers in Plant Science 12:782505. |
|
|
Shetty YV, Nagamma MS, Kumar MD, Jayaprakash SM (2008). Fertility Status in Arecanut Garden Soils of Karnataka 21(4):503-506. |
|
|
Shirgire ST, Savalia SG, Misal NB. (2018). Assessment of available macro and micronutrient status of coastal jamnagar district in Saurashtra region of Gujarat. Journal of the Indian Society of Soil Science 66(2):182-187. |
|
|
Singh SP (2018). Soil Fertility Evaluation for Macronutrients Using Parkers Nutrient Index Approach in Some Soils of Varanasi District of Eastern Utter Pradesh, India. International Journal of Pure and Applied Bioscience 6(5):542-548. |
|
Copyright © 2024 Author(s) retain the copyright of this article.
This article is published under the terms of the Creative Commons Attribution License 4.0


