Due to its social (Duarte et al., 2007) and economical (Ferreira et al., 2003) importance all over the world, tomato hydroponic production has been growing steadily in the last few years. The hydroponic cultivation of tomato has permitted yield increments of the order of 20 to 25% in comparison with soil cultivation systems (Martinez et al., 1997) as well as the production of fruits of better quality (Sainju et al., 2003).
Increases in yield and quality of tomatoes in hydroponics are directly dependent on the adequateness of the nutrients solution (Adams, 1994) to the plant nutrients demand, which varies with the plant phenological stage of development. According to Silva and Giordano (2000), the stages of fruit set and growth are those in which most of the nutrients are absorbed, mainly N and K (Cardoso, 2007; Fernandes et al., 2007) since both are very important for growth, productivity and quality of fruits.
Several research works trying to establish the adequate relation between N and K during the various phases of tomato plant growth have been reported (Adams, 1994; Fernandes et al., 2002; Montoya et al., 2002; Vivian et al., 2008; López - Acosta et al., 2011) since this is one of the most important problems affecting tomato production. According to López - Acosta et al. (2011), one of the relevant aspects of that relation is that it determines the equilibrium between the vegetative and the reproductive phases of the plant development since K plays a moderator role when the high availability of N may have a negative effect on plant growth.
One has to consider also that concentrations of N and K, in the nutrient solution, for the production of tomato in nutrient film technique (NFT) hydroponics is not yet set, because there is no universal nutrient solution due to various factors that influence its composition, such as the cultivar used, the climatic conditions of the cultivation region and cultural management. Having those aspects in mind, the objectives of this research were to evaluate the effects of N and K concentrations in the nutrients solution on the plant vegetative and reproductive stages, specially fruit yield and quality.
Experimental site
The experiment was carried out from January 7 to April 10 of 2011 at the College of Agriculture of the Universidade Estadual Paulista - UNESP, on its campus of Jaboticabal, state of São Paulo, Brazil, latitude of 21° 15’ 22’’ South and 48° 18’ 58’’of longitude W at an altitude of 595 m.
Management system and climatic characteristics
The experiment was carried out under hydroponics, the NFT system in an arc type of green house with a height of 2.8 m, width of 7.5 m and length of 40.0 m, laterally and frontally closed by a black polypropylene screen which resulted in a shading of 30%, covered with a low density 150 µm thick polyethylene film to absorb ultraviolet radiation. During the experimental period, a meteorological equipment placed inside the green house indicated the maximum and the minimum temperatures as 29.5 and 19.5°C, respectively. Relative humidity during that period varied between 50 and 93%.
Treatments and experimental design
The experiment was divided in two phases. The first one lasted from the transplanting of the plants to the cultivation channels up to the beginning of plant flowering. It consisted of doses of N and a constant dose of K. The N doses were of 137.5, 192.5, 247.5, and 302.5 mg L-1, these doses corresponding to the N:K proportions of 1:2, 1:1.4, 1:1.1, and 1:0.9, respectively. The electrical conductivity of these treatments were of 1.9, 2.2, 2.4, and 2.7 dS m-1, respectively. The treatments were based on the N concentration of Muckle (1993) nutrients solution for tomato growing in a NFT system. The Muckle (1993) nutrients solution shows the following nutrients concentrations: 192, 46, 275, 144, 32, 42, 3.0, 4.2, 1.9, 0.46, and 0.09 mg L-1of N, P, K, Ca, Mg, S, B, Fe, Mn, Zn, and Mo, respectively. The experimental units were distributed according to a completely random design with nine repetitions. Each experimental unit was composed of three cultivation channels with four plants in each one.
The second phase of the experiment started on February 21, 2011 and it consisted in the use of nutrients solution with different concentrations of K. The experimental units were distributed also in accordance with a completely random design in a 4 x 3 factorial corresponding to four concentrations of N (137.5, 192.5, 247.5, and 302.5 mg L-1) of the first phase and three K concentrations (137.5, 206.25, and 275.0 mg L-1) which were established based on the best N concentration of the first phase. The electrical conductivity of those treatments were of 1.75, 1.9, and 2.3 dS m-1, respectively. The nutrients solution of the first and second phases were prepared with ammonium, calcium, and potassium nitrates; potassium, ammonium, copper, manganese, and zinc sulfates; potassium and calcium chlorides; potassium and magnesium acetates; potassium monophosphate, monoamonium phosphate, phosphoric, nitric, and boric acids, ammonium molibidate and Fe-EDDHMA.
Plant material and management practices
The F1 hybrid ‘Débora Max’ (SAKATA) was used. Seed sowing took place on 4 January, 2011 in phenolic foam with a capacity of 180 cells. Ten days later, when the cotyledonary leaves were expanded, the seedlings were transplanted to 5 cm wide polypropylene channels inside which circulated the complete Muckle’s (1993) nutrients solution.
On 29 January, 2011, the plantlets, then bearing five true leaves, were transferred to the definitive cultivation channels. These channels, made of 8 inches of diameter PVC tubes longitudinally sawn to a length of 2 m, were covered with Tetra Pak® paper and were positioned at a 5° angle so as to permit the returning of the nutrients solution which was not absorbed by the plants to the 100 L reservoir. For each channel (experimental unit) there was a reservoir. Plants were spaced of 1.0 m between channels and of 0.5 m between two successive plants in the channel.
Submerse Chosen© Power Head CX-300 model pumps located at the head of the channels pumped the nutrients solution uniformly to the plants at an outflow of 1000 L h-1 by means of a 5/8 diameter, 2.3 m long rubber hose. The operation of the pump was controlled by a timer which kept the nutrients solution circulating without interruption from 7 AM to 6 PM and at 11 PM for 15 minutes.
The initial reservoir volume was daily replenished with water. The pH of the nutrients solution was maintained between 5.5 and 6.5 with the help of 6 N sulfuric acid and 8 N sodium hydroxide. The treatments electrical conductivity was reestablished whenever a drop of 20% of the initial value was verified to occur using the stock nutrients solution with the same concentration of the nutrients solution of that treatment. Each 15 days the nutrients solutions were renewed. Plant growth was supported by two poles to which they were tied with the help of plastic tape up to 1.6 m of height. Axillary buds were eliminated and the application of products to control pests and diseases was accomplished. To prevent the development of black background, at the beginning of the flowering period, 2.5 g L-1 of calcium nitrate were applied once a week with the jets directed at the racemes. After fruits started to develop two of that application was made each week.
During the first phase, more precisely on 19 February, 2011, nine days after flowering had started, the following variables started to be evaluated : a) insertion height of the first floral cluster (HFC, cm), b) internode length (IL, cm), c) stem diameter (SD, mm), measured 3 cm above soil surface with the help of a digital caliper, d) leaf N content (NL, g kg-1 of dry matter) following procedures found in Malavolta et al. (1997).
At the second phase, which lasted from March 29 through April 28 of 2011, fruits from the first, the second, and the third clusters were harvested and the following variables were evaluated: a) fruit yields of the first, second, and third clusters (PC1, PC2, and PC3) in grams, b) fruit mean mass in each cluster (FMC1, FMC2, and FMC3), in grams, c) soluble solids – in each cluster the juice of two fruits had its soluble solids content determined with the help of an analogical ATAGO refractometer, model N1 (SSC1, SSC2, and SSC3), the results being expressed in °Brix, d) Productivity (g plant-1).
Data analysis
The data were statistically analyzed by means of the AgroEstat program (Barbosa and Maldonado Júnior, 2011). Polynomial regression studies were run for the N concentrations during the vegetative stage and for the interaction between N and K concentrations during the reproductive stage. Productivity was analyzed by the quadratic polynomial response surface technique (Z = b0 + b1 x (N) + b2 x (K) + b3 x (N)2 + b4 x (N x K) + b5 x (K)2, where: b0 = intercept, b1 = linear coefficient for the dose of N, b2 = linear coefficient for the dose of K, b3 = quadratic coefficient for the dose of N, b4 = coefficient for the interaction between the doses of N and K, b5 = quadratic coefficient for the dose of K). When significant (test F, P < 0.05) this model was used to study the interaction between factors N and K concentrations. The graph was made with the help of the STATISTICA statistical program.
Data biometrics and leaf nitrogen content
The variables measured during the vegetative stage (leaf N content, stem diameter, internode length, and first cluster height) were not significantly influenced by the treatments (Table 1). The mean N content in the leaves (NL) resulting from the four N concentrations (which resulted in N:K relations between 1:2 and 1:0.9) were lower than the levels considered adequate for tomato production, that is, between 40 and 60 g kg-1 (Trani and Raij, 1997). Notwithstanding these results, the tomato plants did not show N deficiency symptoms. The N levels found in this experiment were also lower than those reported by Fernandes et al. (2002), that is, 32 g kg-1 of N in a research work in which the authors employed N concentrations of 112 and 168 mg L-1 which resulted in N:K relation of 1:1.4 during the vegetative stage and of 1:1.8 during the reproductive stage, respectively.
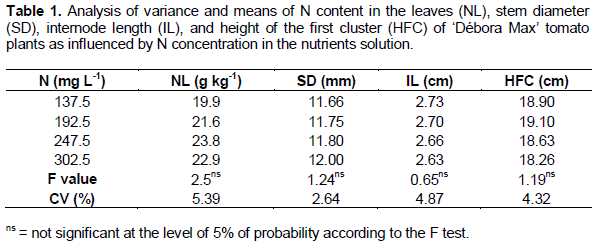
Ronchi et al. (2001) reported results conflicting with the ones of the present study - when they increased N concentration in the nutrients solution from 0 to 224 mg L-1, they verified that N content, at the beginning of flowering, increased from 8.1 to 44.1 g kg-1. The difference between their results and ours is thought to be due to the fact the initial N concentrations in their work (0 and 56 mg L-1) were considerably lower than the one (137.5 mg L-1) we found in the present work.
The fact that the differences between treatments were not statistically significant authorizes the adoption of the lowest N concentration to make the nutrients solution, that is, 137.5 mg L-1 or 9.8 mmol L-1 of N, since it is the most economical. This decision defined the proportion N:K of the nutrients solution as of 1:2 to be used during this stage. On the other hand, during this phonological stage, the N:K proportion is normally narrower or slightly in favor of N. So, the observed relation diverged from those reported by Adams (1994), that is, from 1:1.1 to 1:1.3 during the period from 11 to 13 weeks after seed sowing with 175 mg L-1 of N. Fernandes et al. (2002) and Vivian et al. (2008) reported N:K relations of 1:1.4 during the vegetative stage, when 112 mg L-1 of N was used to form the nutrients solution.
The mean internode length (IL) was of 2.7 cm and the mean first cluster height (HFC) was of 18.7 cm. (Table 1). The mean stem diameter (SD) of the tomato plant at the beginning of flowering was 11.8 mm and it was similar to the value reported by Vivian et al. (2008), that is, 10.9 mm when they applied a N dose of 112 mg L-1 and a N:K relation of 1:1.4 at the vegetative phase. Genuncio (2009) reported to have observed a stem diameter of 13.7 mm, when a dose of 150.3 mg L-1 of N was applied (with a N:K relation of 1:1.5), that is, a diameter larger than the one found in this study. Ronchi et al. (2001) verified positive effects on stem diameter with increasing doses of N up to 224 m L-1 in the nutrients solution. Those differences are interpreted as being due to the authors having made use of low N concentrations (0 and 56 mg L-1) in their experiment.
The lack of the effect of the N concentrations on the evaluated characteristics was not expected since N plays several roles in metabolic processes and its increment promotes higher growth rates in the plants (Sainju et al., 2003). However, such a fact may be explained to the supplying of the nutrient according to the plant demand at the lowest concentration and due to the short period (24 days, that is, from January 29 to February 21, 2011) during which the plants remained submitted to the treatments so that there was not time enough for the differences to become clear. The tomato plant grows slowly until flowering starts (Haag et al., 1981) when the plant is with 0.74% of its total dry matter content, this explaining why the demand for N up to that point is so small. It is necessary to add to those hypotheses the fact that the N in the nutrients solution is readily available at the supplied amount, and this is a condition seldomly found in the soil - the conditions prevailing in the soil usually determine a low utilization of the applied N.
Productivity of clusters
The first cluster production of fruits (PC1) was not influenced by the factors and their interactions (Table 2). But, a significant adjustment to a polynomial equation of first degree for the N concentration was verified (Figure 1). The largest production of fruits by cluster 1 (PC1), that is, of 312.38 g, was verified when N concentration in the nutrients solution was of 137.5 mg L-1. With increasing doses of N up to 302.5 mg L-1, fruit production decreased linearly (Figure 1), corresponding to 15.1% less than maximum production. PC1 was lower than that reported by Fernandes et al. (2002), that is, 919.7 g, in an experiment in which they worked with only one cluster and used a nutrients solution with 168 mg L-1 of N during the reproductive stage.
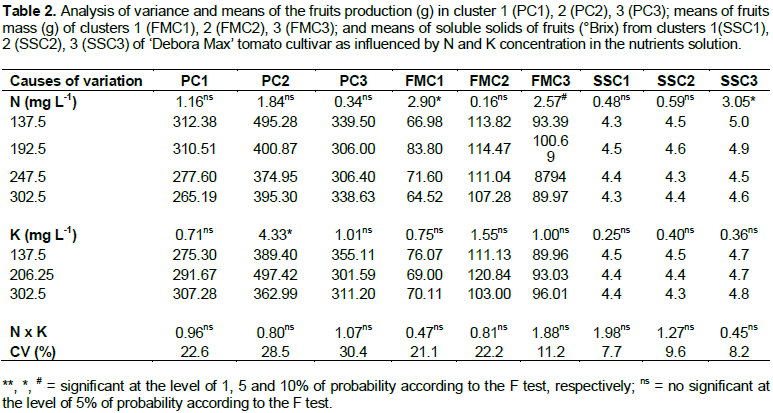
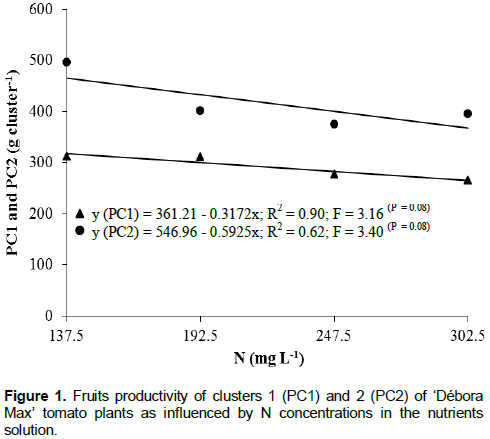
Other two factors may have contributed for the results reported by those authors, one of them the cultivars they used and the other one the elimination of the apical meristem. The non elimination of the apical meristem - a procedure adopted in the present study - resulted in the plant keeping its indeterminate type of growth what caused part of the plant photosynthates to be consumed for vegetative growth. In Fernandes et al. (2002), the elimination of the apical meristem above the third leaf after the first cluster, permitted higher amounts of photosynthates to be used for the formation and growth of fruits. In a similar procedure, Fernandes et al. (2007), applying 174.4 mg L-1 of N during the reproductive stage of tomato plants in a hydroponic system (NFT), harvested 572.5 g of fruits. The yield of fruits from the second cluster (PC2) was influenced only by K doses and not by the interaction of treatments (Table 2). However, a linear adjustment in relation to N concentration was verified (Figure 1).
The largest PC2 (495.29 g) resulted from the lowest N concentration (137.5 mg L-1) with a linear reduction in fruit production with increasing doses of N (Figure 1). A larger production from the second cluster (1,018 g) was reported by Cardoso (2007) - in his experiment, the author grew ‘Rebeca’ cultivar tomato plants with two clusters per plant to which 335.4 mg L-1 of N were applied during the reproductive stage. In his experiment, the author made the apical pruning so as to allow only three leaves above the second cluster in addition to six fruits per cluster and this procedure caused a reduction in photosynthates drainage for the development of vegetative organs. The PC1 and PC2 results are different from the results of studies in which fruit production was incremented by increasing N dose in the nutrients solution (Ferreira et al., 2003; Genuncio et al., 2006). These differences though, may be ascribed to several factors, both genetic and environmental, mainly the relation between N and K.
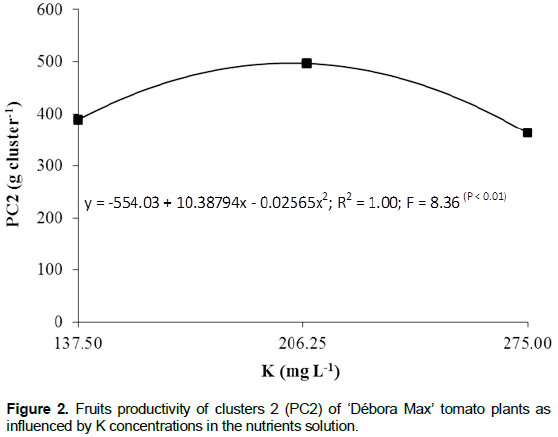
There was an adjustment of second degree equation for K concentration, with the highest PC2 (497.7 g) resulting from the K dose of 202.5 mg L-1 (Figure 2). This production was 27.8 and 37.1% higher to the PC2’s resulting from K doses of 137.5 and 275 mg L-1, respectively. Almeselmani et al. (2009) also reported positive effect of K on the yield of fruits of hydroponically cultivated tomato. On the other hand, high doses of K in the nutrients solution may result in nutritional unbalance to the plant either by competition with other elements such as Ca and Mg (Martinez et al., 1997; Sainju et al., 2003) or due to increment in salinity of the medium (Papadopoulos, 1998). Guler and Guzel (1999) verified fruit yield increments with increasing doses of N and K but at the highest concentrations of K (300 to 450 mg L-1) productivity reductions were observed. These reductions being attributable to increment in the salinity at the root zone (electrical conductivity of 2.5 dS m-1). The fruit yield of cluster 3 (PC3) was not significantly influenced by the treatments (Table 2). The adjustment of the polynomial equation was not significant either. The mean fruit yield was of 322.6 g. There was a significant adjustment of the surface of response productivity (Table 3).
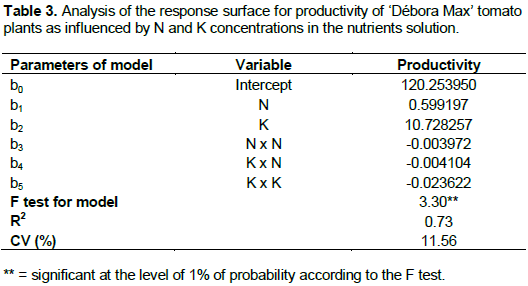
Increasing N and K concentrations determined increa-sing productivity up to the concentrations of 177.2 and 188.7 mg L-1 of N and K, respectively, when a production of 1170.8 g plant-1 was verified (Figure 3). The N concentration which resulted in the highest productivity is practically the same as that pointed by Ho et al. (1999), that is, 180 mg L-1 and lower than that indicated by Guler and Guzel (1999), that is, 250 mg L-1.
Maximum yield resulted from the N:K proportion of 1:1.1 and this is in agreement with Adams (1994), Ho and Adams (1995), Genuncio et al. (2010) and López-Acosta et al. (2011) who propose a N:K in which K is favored during the reproductive phase considering the basic role played by that element in the synthesis and translocation of photosynthates to the fruits. As shown in Figure 3, N and K concentrations larger than 177.2 and 188.7 mg L-1, respectively, lead to yield losses, this negative effect being exerted mainly by N. Increasing N concentration in the nutrients solution may reduce fruit production basically because N tend to increase vegetative growth in detriment of the reproductive growth (Papadopoulos, 1998).
Fruit mass of clusters
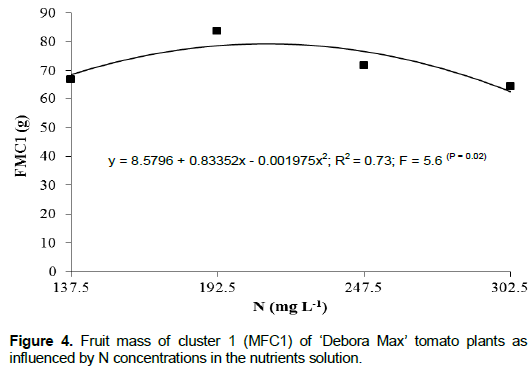
The fruit mass of the first cluster (FMC1) was significantly influenced only by N concentration, with no significant interaction between N and K (Table 2). An adjustment of a polynomial second degree equation was verified for FMC1 means consequent of the N concentration in the nutrients solution (Figure 4). The largest FMC1 (96.5 g) resulted from the N concentration of 211 mg L-1, which was 23% larger than that resulting from the N concentration of 302.5 mg L-1. This result may be explained by the fact that high availability of N in the growing medium may cause excessive vegetative growth of the plant thus reducing the production of fruits (Sainju et al., 2003).
The FMC1’s (85.7, 96.5, 93.8 and 80 g) as determined by the N concentrations used in this study (Figure 4) were lower than those reported by Montoya et al. (2002), whose results indicated that their largest fruit production (112 g) resulted from the K dose of 117 mg L -1 in comparison with the doses of 234 and 351 mg L-1 of that element and with N kept constant at 140 mg L-1. Fernandes et al. (2002), using the respective doses of N and K concentrations of 168 and 335.4 mg L-1, reported average of 154.7 g from just one cluster. Their fruit mass was larger than the one of this study probably because of their plants being cultivated with just one cluster and also because they made the apical pruning of the plants keeping only three leaves above the cluster and this caused a larger proportion of photosynthates being carried to the fruits. According to Peluzio et al. (1999), the source-sink relation is also capable of having a significant influence on fruit mass. Cardoso (2007), making use of a nutrients solution with the same concentrations as those used by Fernandes et al. (2002) for tomato plants with two clusters per plant, verified a fruit mass of 183.6 g.
Fernandes et al. (2004) and Vivian et al. (2008), growing tomato plants in a hydroponic system, verified fruit mass of 126.8 and 170.2 g, respectively, both making use of doses of 168 and 335.4 mg L-1 of N and K, respectively.
The results herein reported are, in general, in agreement with those found in the literature, that is, fruit mass reduction with increasing doses of N in the nutrients solution during the reproductive phase. The relation N:K should favor the concentration of K during the fruit growth period so as to improve quantitative and qualitative characteristics (Ho and Adams, 1995), among them the mass of fruits. N and K concentrations either isolated or in interaction did not affect the fruit mass of the second cluster (FMC2), according to Table 2. The polynomial equation also had no significant adjustment and the mean mass of fruits was of 111.6 g. Fruit mass from the third cluster (FMC3) was significantly influenced only by N concentration, with no significant interaction between the factors N and K (Table 2). No significant adjustments of the polynomial equations were verified and the mean FMC3 was of 93 g.
Soluble solids of clusters
N and K concentrations did not have any significant effect on the soluble solids contents of the cluster 1 (SSC1) and of the cluster 2 (SSC2) (Table 2). No significant interaction of those two factors was observed either. Significant adjustments of the polynomial equation for the evaluated characteristics were not observed. SSC1 and SSC2 means were both of 4.4 °Brix. This value is within the range of 4.0 to 6.0 °Brix observed by Shi et al. (1999) and Silva and Giordano (2000) and above the value suggested for high quality fruits by Mencarelli and Saltveit Júnior (1988), that is, of 3.0 °Brix. In a study similar to the present one, Genuncio et al. (2010) observed no significant effect of the N:K relations of 1:1.5 (103:153 mg L-1) and 1:2 (103:204 mg L-1) on the soluble solids content and reported mean values of 5.5 and 5.7 °Brix for four tomato cultivars. Only N concentration had a significant effect on soluble solids content of fruits from cluster 3 (SSC3) (Table 2). But there was no adjustment of the polynomial equation and the mean was of 4.7 °Brix, this value being within the range of values of high quality fruits (Mencarelli and Saltveit Júnior, 1998; Silva and Giordano, 2000).
Adequate doses of K is beneficial to fruit quality by increasing soluble solids content (Sainju et al., 2003). Soluble solids content between 5.0 and 5.4 °Brix (higher than the one of the present study) were reported by Feltrin et al. (2005) when fertigated tomato plants grew in a nutrients solution with 339 mg L-1 of K during the reproductive phase.
A large amount of K is necessary for the production of high quality fruits. On the other hand, it is necessary to emphasize that this amount of K must be equilibrated with the doses of the other nutrients (Papadopoulos, 1998). In addition to that, for tomato production, not only the amounts of N and K but also the adequate relation between those two nutrients is of primordial importance to get fruits of commercial quality (Hernández - Díaz et al., 2009).
The N and K concentrations of 137.5 and 275 mg L-1, respectively, which resulted in the N:K relation of 1:2, were the best ones for the vegetative phase. During the reproductive phase, fruit production is maximized when N and K concentrations are of 177.2 and 188.7 mg L-1, respectively, this meaning a N:K relation of 1:1.1. The soluble solids content of fruits in clusters 1, 2, and 3 was not influenced by N concentrations (from 137.5 to 302.5 mg L-1) or K concentrations (from 137.5 to 275 mg L-1) in the nutrients solution.


